

Forex Trading Alert originally sent to subscribers on June 2, 2015, 10:31 AM.
Earlier today, the data showed that the euro zone consumer price index increased by 0.3% in the previous month, beating analysts’ forecast. In this environment, EUR/USD rebounded sharply and broke above resistance area, but did this move change anything?
In our opinion the following forex trading positions are justified - summary:
- EUR/USD: Short positions (stop-loss order at 1.1667)
- GBP/USD: Short positions (stop-loss order at 1.5913)
- USD/JPY: none
- USD/CAD: Long positions (stop-loss order at 1.1706)
- USD/CHF: none
- AUD/USD: Short positions (stop-loss order at 0.8194)
EUR/USD
The situation in the medium term remains almost unchanged as an invalidation of the breakout above the 23.6% Fibonacci retracement and sell signals generated by the indicators support further deterioration.
What can we infer from the very short-term picture? Let’s check.
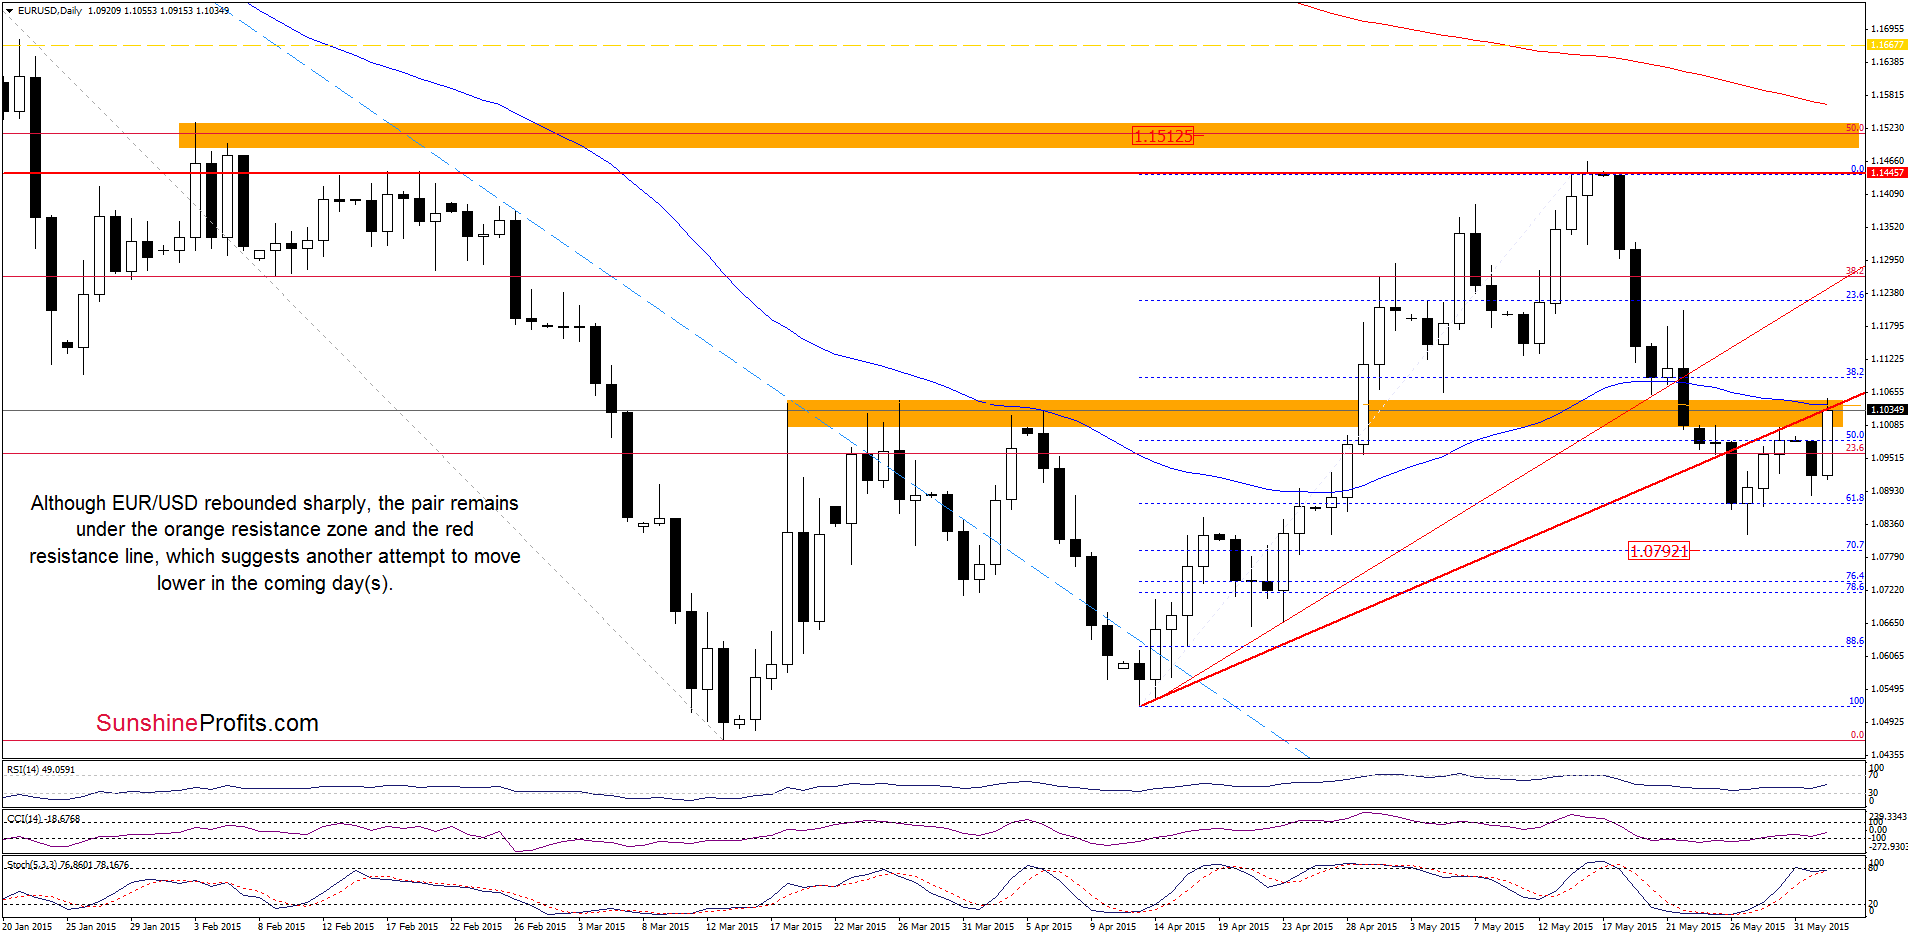
On the above chart, we see that EUR/USD reversed and erased yesterday’s losses. Although this is a positive signal, the exchange rate reached the orange resistance zone, which triggered a pullback in the previous week. Taking into account the fact that this area is currently reinforced by the 50-day moving and the Stochastic Oscillator is very close to generate a sell signal, we think that history will repeat itself once again and we’ll see another downswing from here in the coming days. If this is the case, the initial downside target would be yesterday’s low of 1.0886.
Today’s move higher (above the rising red support / resistance line) doesn’t change anything in our opinion – it was sharp, but unconfirmed and at the moment of writing these works EUR/USD is already moving back lower.
Very short-term outlook: bearish
Short-term outlook: mixed with bearish bias
MT outlook: mixed
LT outlook: mixed
Trading position (short-term; our opinion): Short positions (which are profitable) with a stop-loss order at 1.1667 are justified from the risk/reward perspective at the moment. We will keep you informed should anything change, or should we see a confirmation/invalidation of the above.
USD/CAD
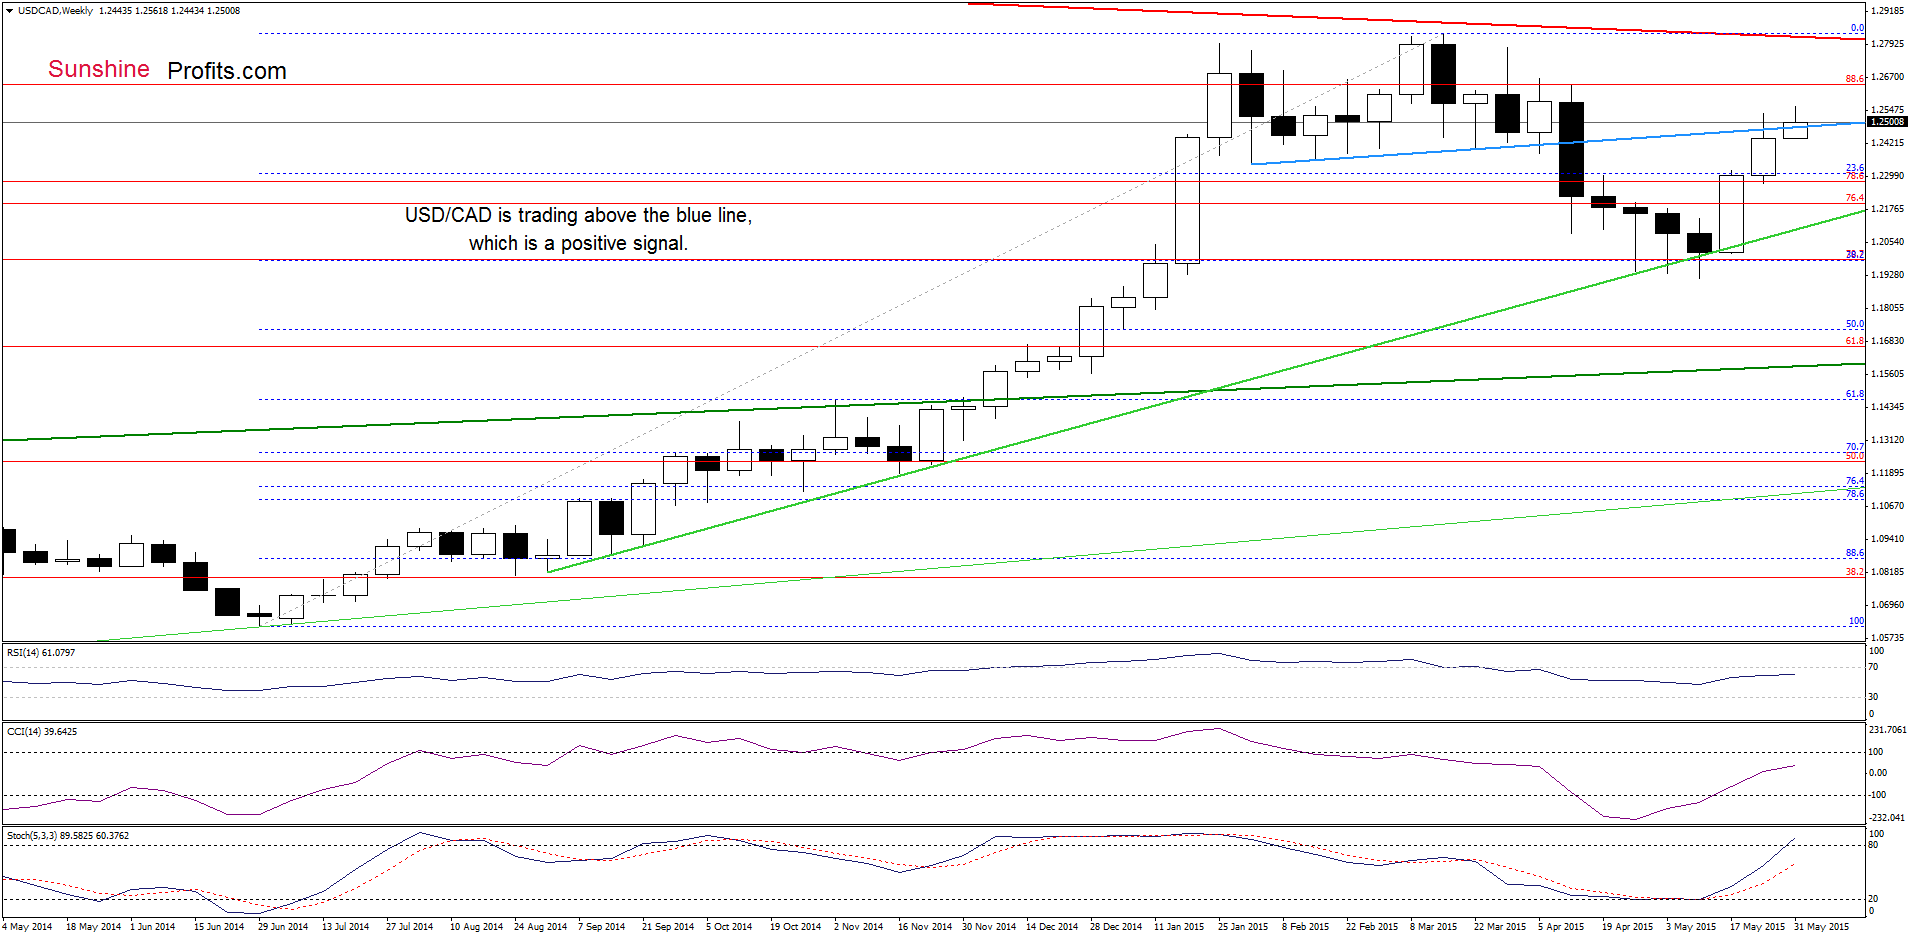
Looking at the weekly chart, we see that although USD/CAD pulled back slightly, the exchange rate is trading above the blue support/resistance line, which is a positive signal – especially when we factor in buy signals generated by the indicators, which are still in play, supporting the bullish case.
Having said that, let’s focus on the very short-term changes.
Quoting our last commentary on this currency pair:
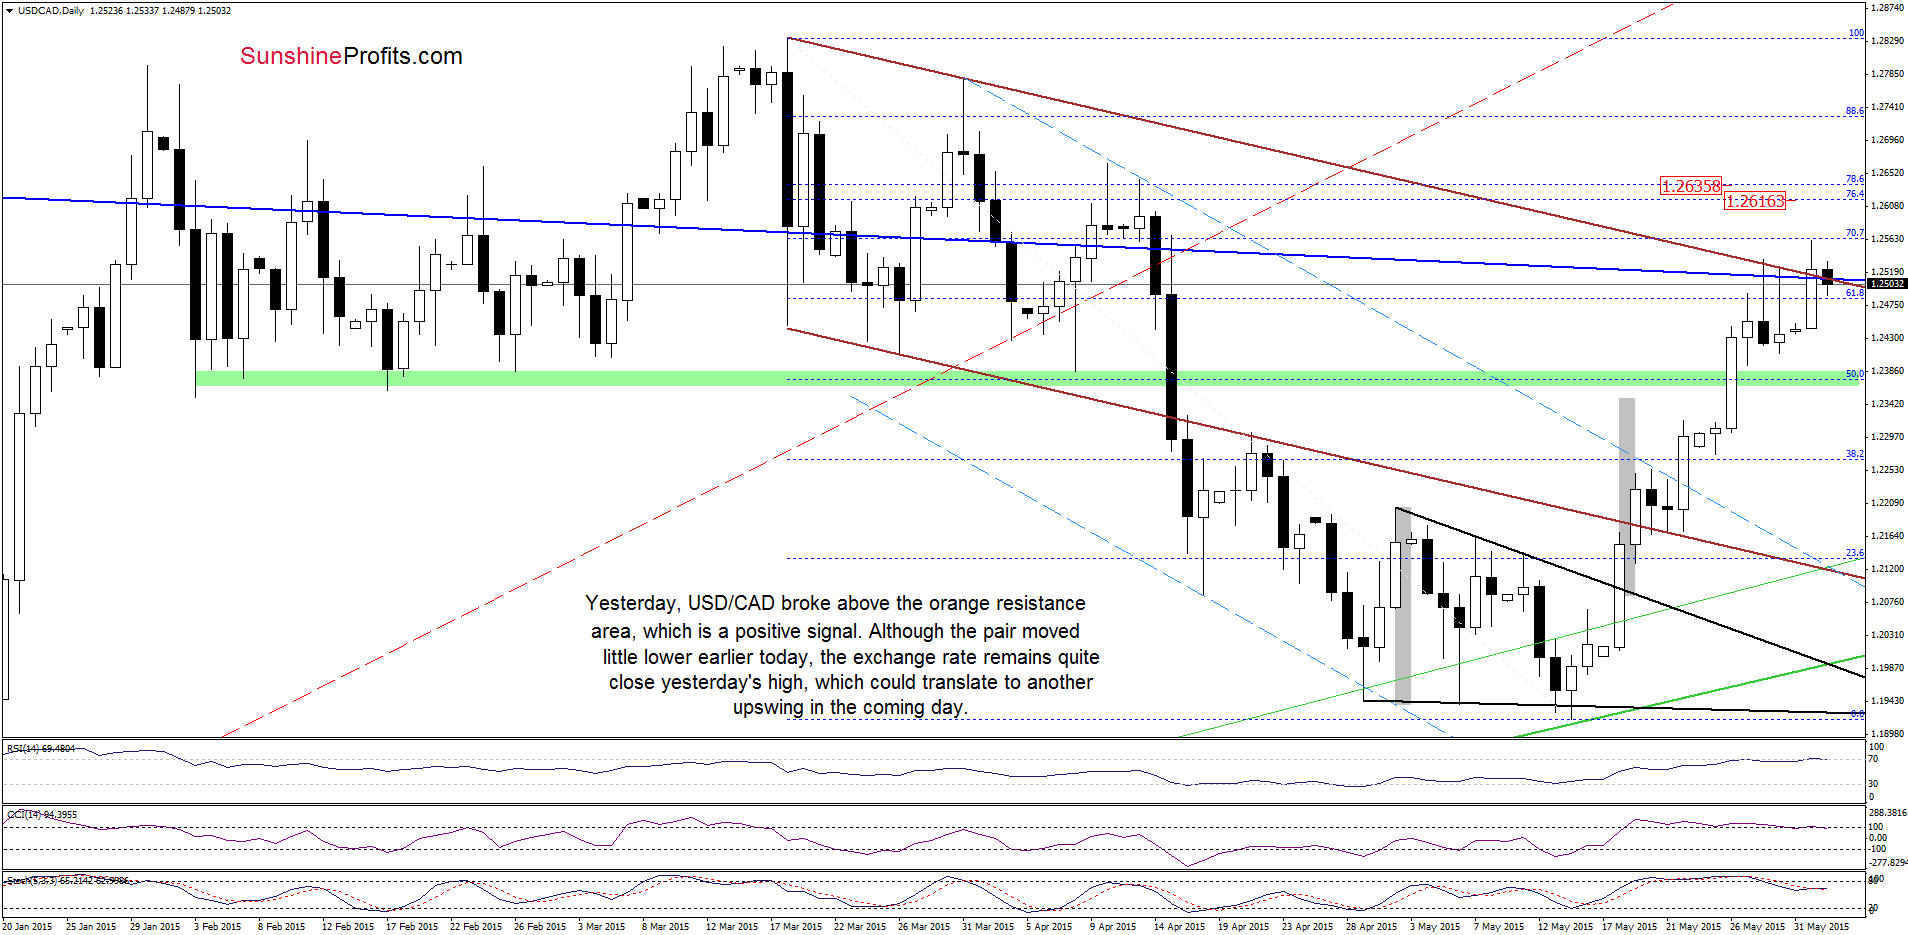
(…) The resistance zone created by the upper line of the brown declining trend channel and the long-term blue resistance line encouraged currency bears to act and resulted in a pullback. Despite this move, the pair remains above the green support zone, which suggests that we might see another test of the above-mentioned resistance zone in the coming days.
As you see on the daily chart currency bulls pushed the pair higher as we expected. With this upswing USD/CAD broke above the upper line of the brown declining trend channel and the long-term blue resistance line, approaching the 70.7% Fibonacci retracement. Although the exchange rate reversed and declined slightly, the pair remains quite close yesterday’s high, which could translate to another upswing in the coming day (especially when we take into account the medium-term picture).
Very short-term outlook: bullish
Short-term outlook: mixed with bullish bias
MT outlook: mixed
LT outlook: mixed
Trading position (short-term; our opinion): Long positions (which are profitable) with a stop-loss order at 1.1706 are justified from the risk/reward perspective at the moment. We will keep you informed should anything change, or should we see a confirmation/invalidation of the above.
USD/JPY
In our Forex Trading Alert posted on May 29, we wrote:
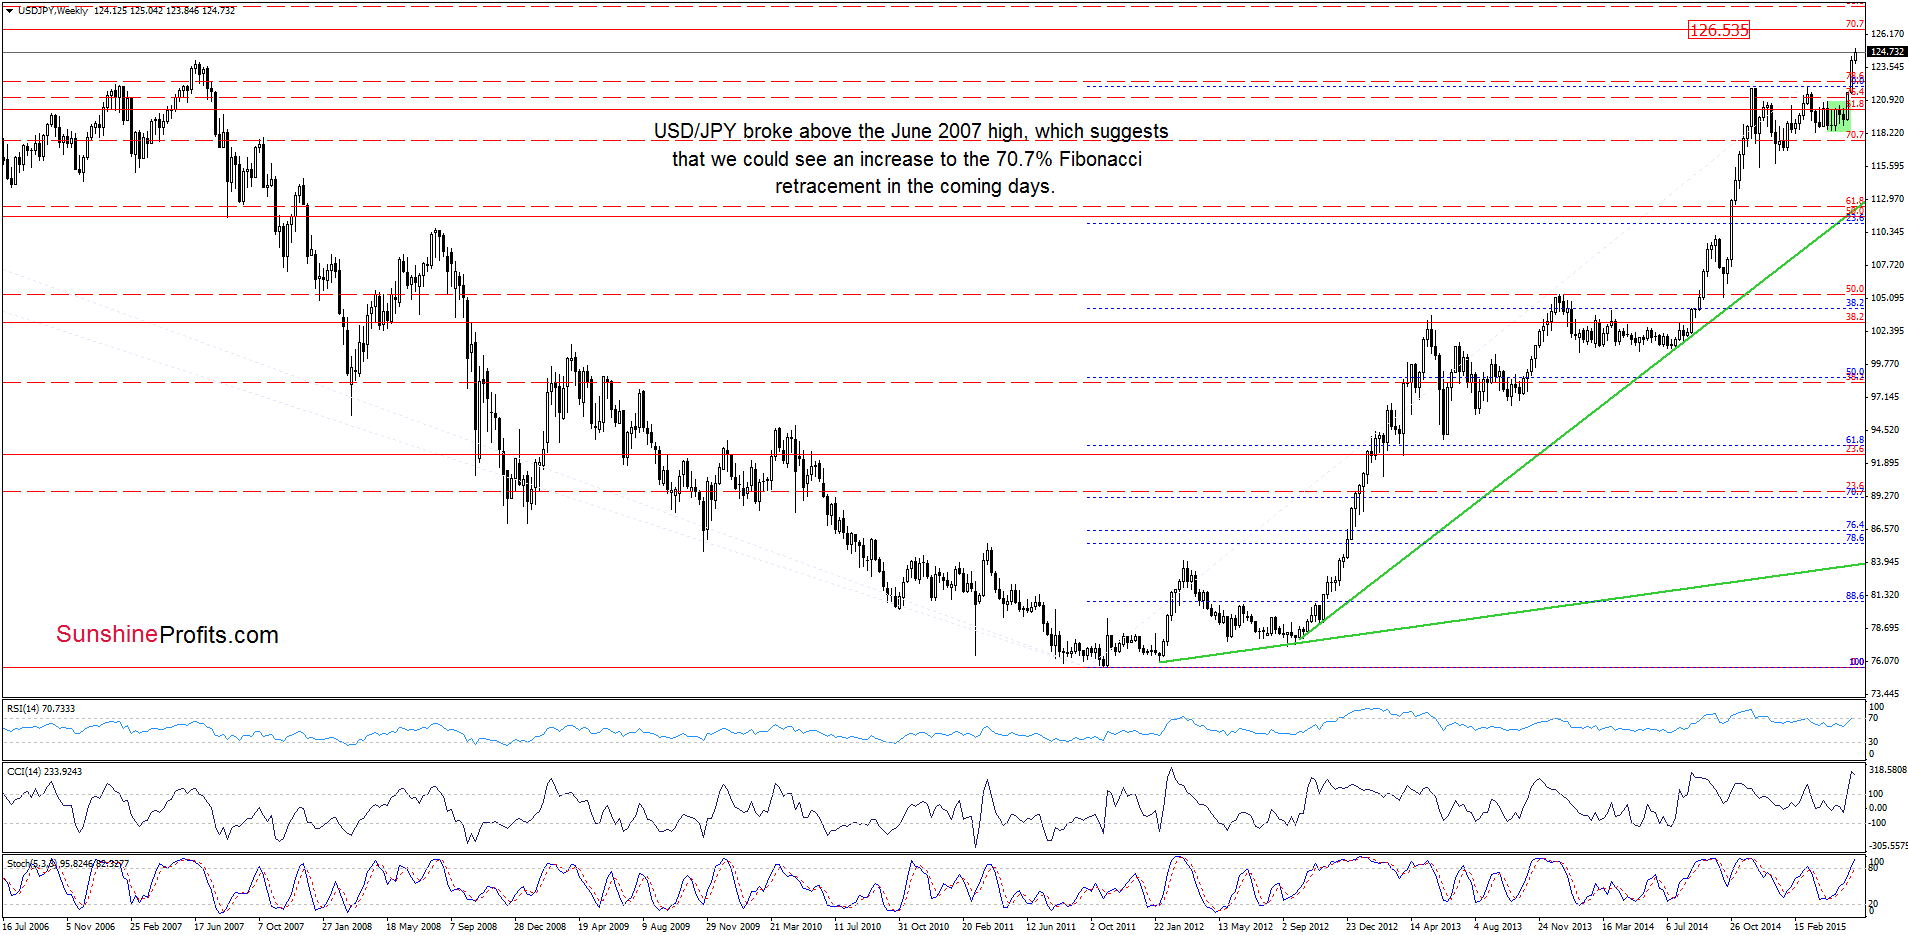
The medium-term picture has improved as USD/JPY broke (…) above the June 2007 high. Although the pair invalidated this small breakout, USD/JPY is still trading slightly below this resistance level, which in combination with buy signals generated by the indicators suggests that another attempt to move higher can’t be ruled out.
From today’s point of view we see that USD/JPY extended rally and came back above the June 2007 high, which is a positive signal that suggests further improvement and an increase to around 126.53, where the 70.7% Fibonacci retracement (based on the entire 1998-2011 declines) is.
Are there any short-term factors that could hinder the realization of the above scenario? Let’s focus on the very short-term chart and find out.
On Friday, we wrote the following:
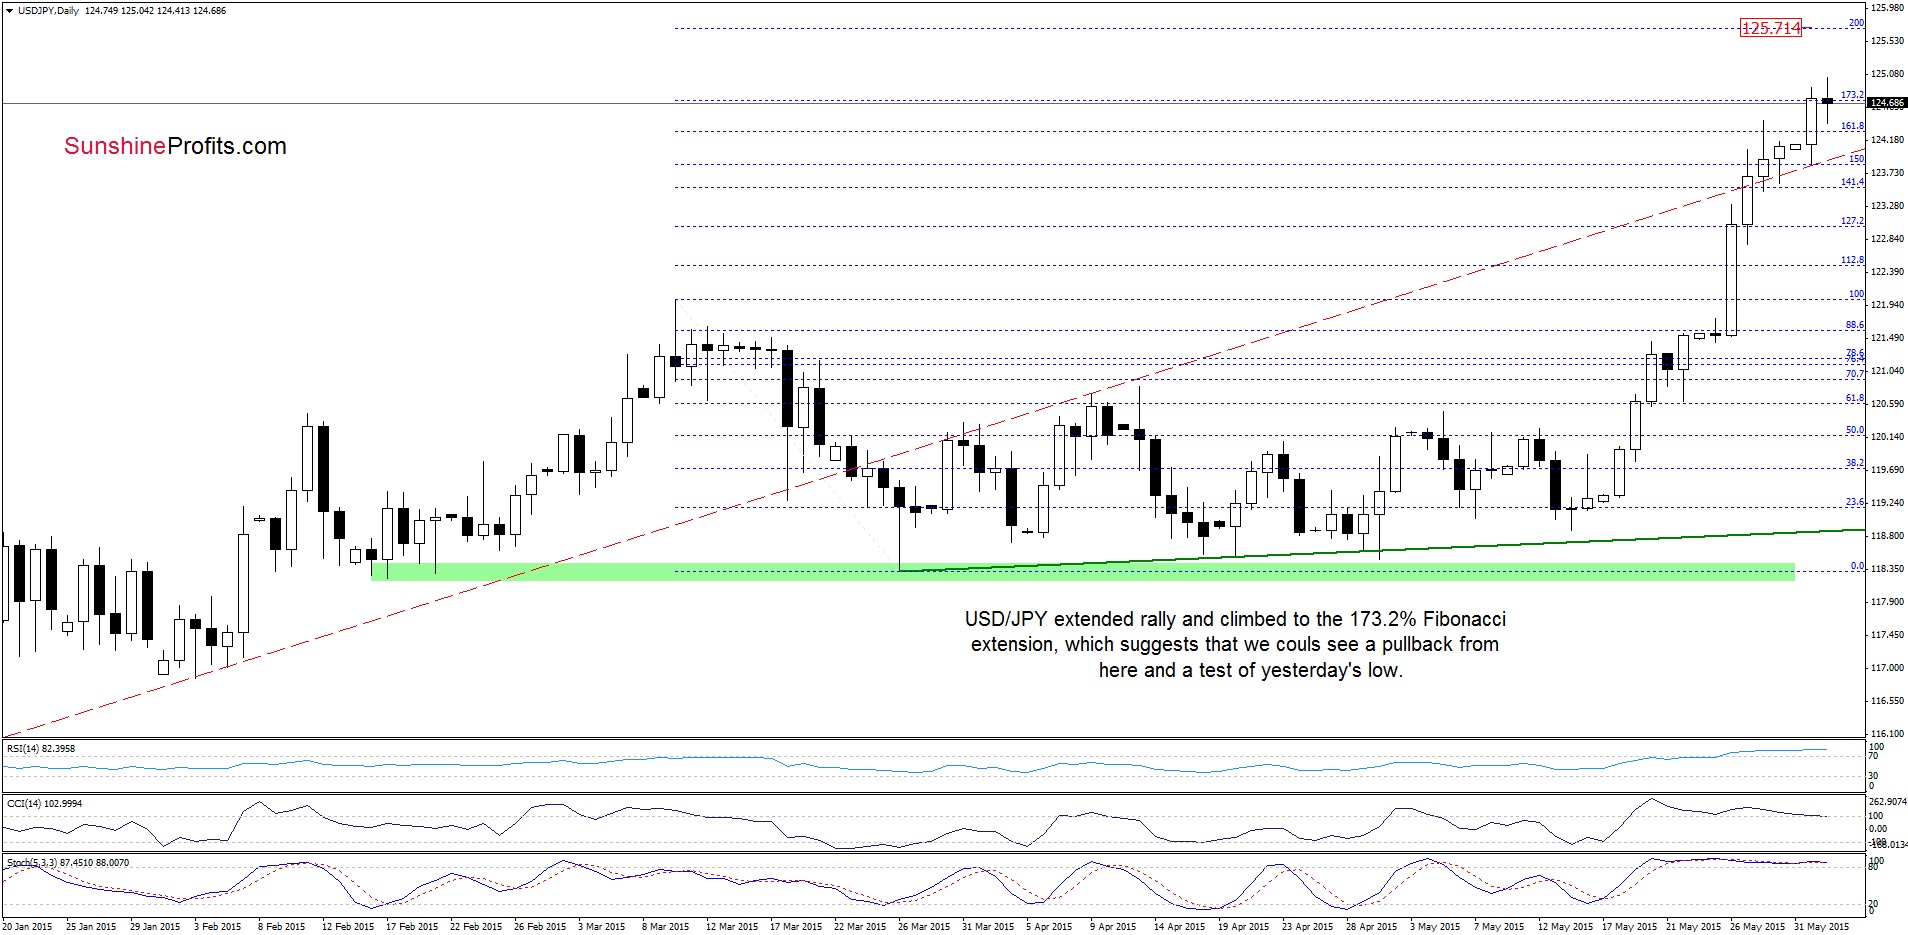
(…) the exchange rate broke above the red dashed resistance line and climbed to the 161.8% Fibonacci extension, which suggests that we could see a pullback from here in the coming week (…).
Looking at the above chart, we see that currency bears pushed USD/JPY lower, but the red dashed line (which serves as support at the moment) stopped further deterioration, triggering an upward move. With this upswing the pair reached the 173.2% Fibonacci extension, which means that we could see a pullback from here in the coming day(s). If this is the case, the initial downside target would be yesterday’s low of 123.84. At this point, it is worth noting that this area is reinforced by the red dashed support line and the June 2007 high of 124.13, which could encourage currency bulls to act.
Very short-term outlook: mixed
Short-term outlook: mixed
MT outlook: mixed
LT outlook: bullish
Trading position (short-term; our opinion): No positions are justified from the risk/reward perspective at the moment. We will keep you informed should anything change, or should we see a confirmation/invalidation of the above.
Thank you.
Nadia Simmons
Forex & Oil Trading Strategist
Forex Trading Alerts
Oil Investment Updates
Oil Trading Alerts
