

Forex Trading Alert originally sent to subscribers on April 7, 2015, 10:11 AM.
Earlier today, market research group Markit showed that the euro zone's services PMI slipped to 54.2 in March, missing analysts’ expectations. Additionally, the U.S. dollar bounced off Friday's lows, which together pushed EUR/USD lower. Where will the pair head next?
In our opinion the following forex trading positions are justified - summary:
- EUR/USD: none
- GBP/USD: none
- USD/JPY: none
- USD/CAD: short (stop loss order at 1.2876)
- USD/CHF: none
- AUD/USD: none
EUR/USD
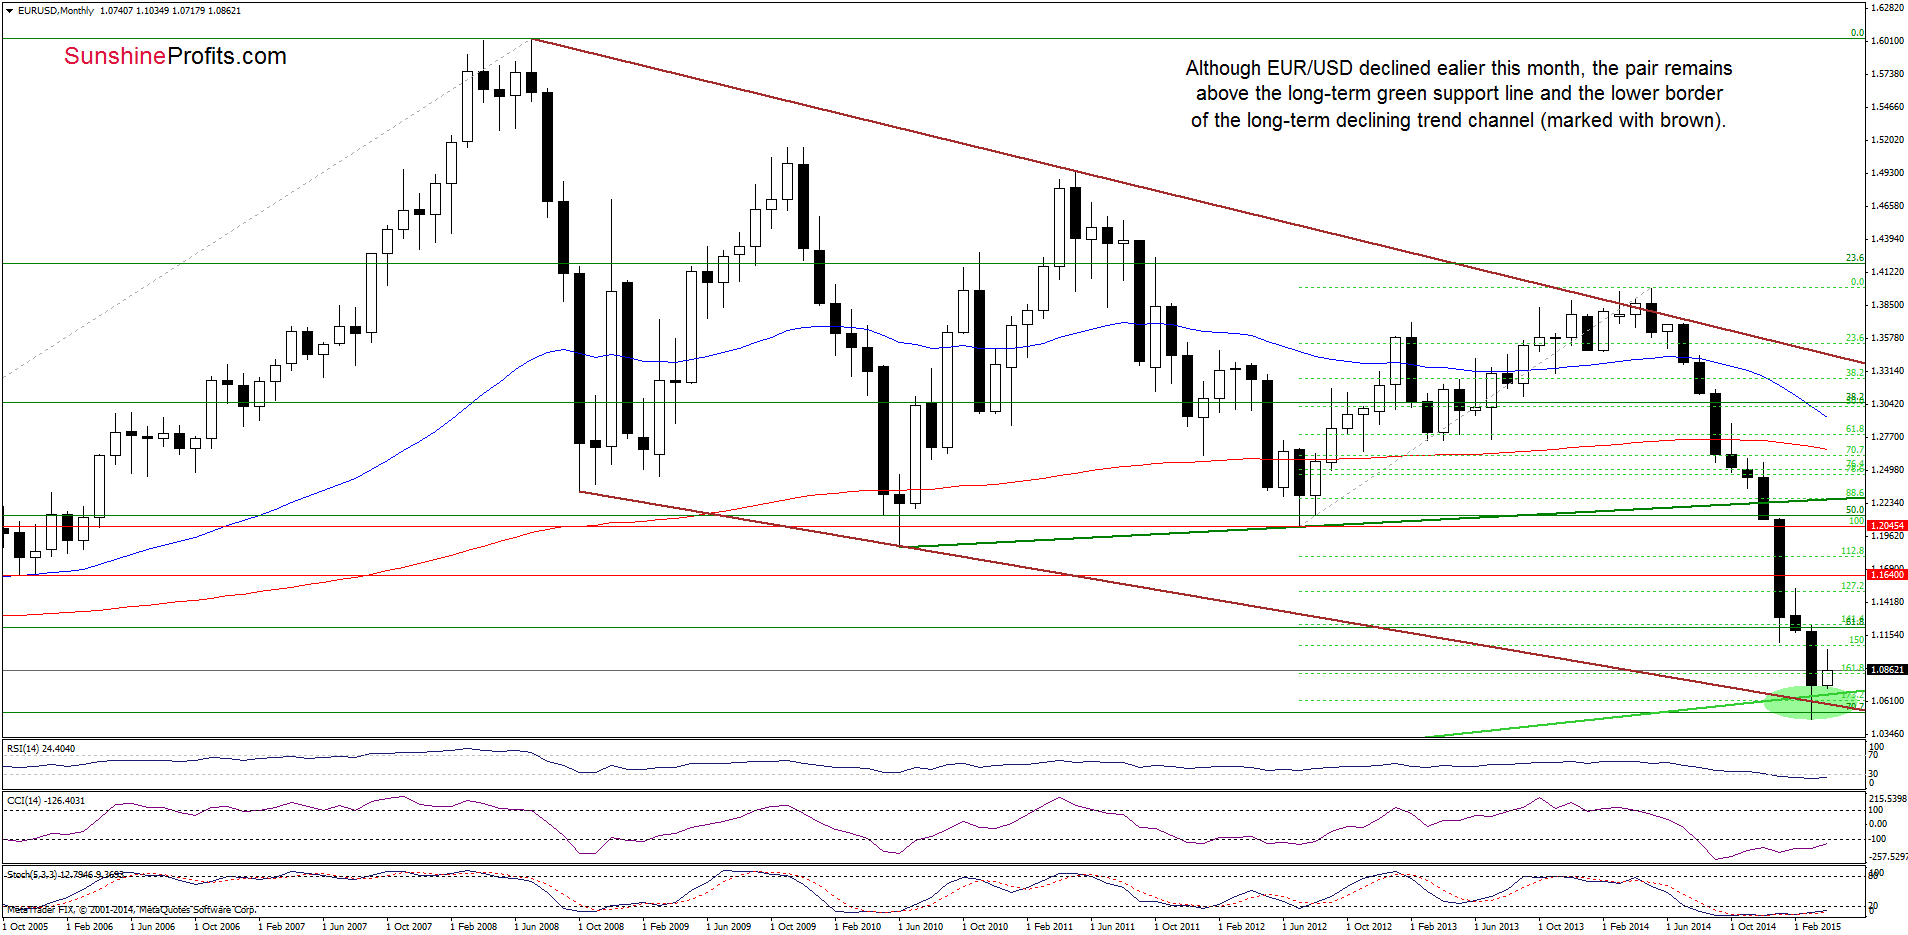
The situation in the medium term hasn’t changed much as EUR/USD still remains above the previously-broken the long-term green support/resistance line. Additionally, the exchange rate is trading above the lower border of the long-term declining trend channel (marked with brown), which suggests that as long as these two support lines (and the 70.7% Fibonacci retracement level) are in play new lows are not likely to be seen. Nevertheless, another test of their strength can’t be ruled out. Why? Let’s examine the daily chart and find out.
In our previous Forex Trading Alert, we wrote the following:
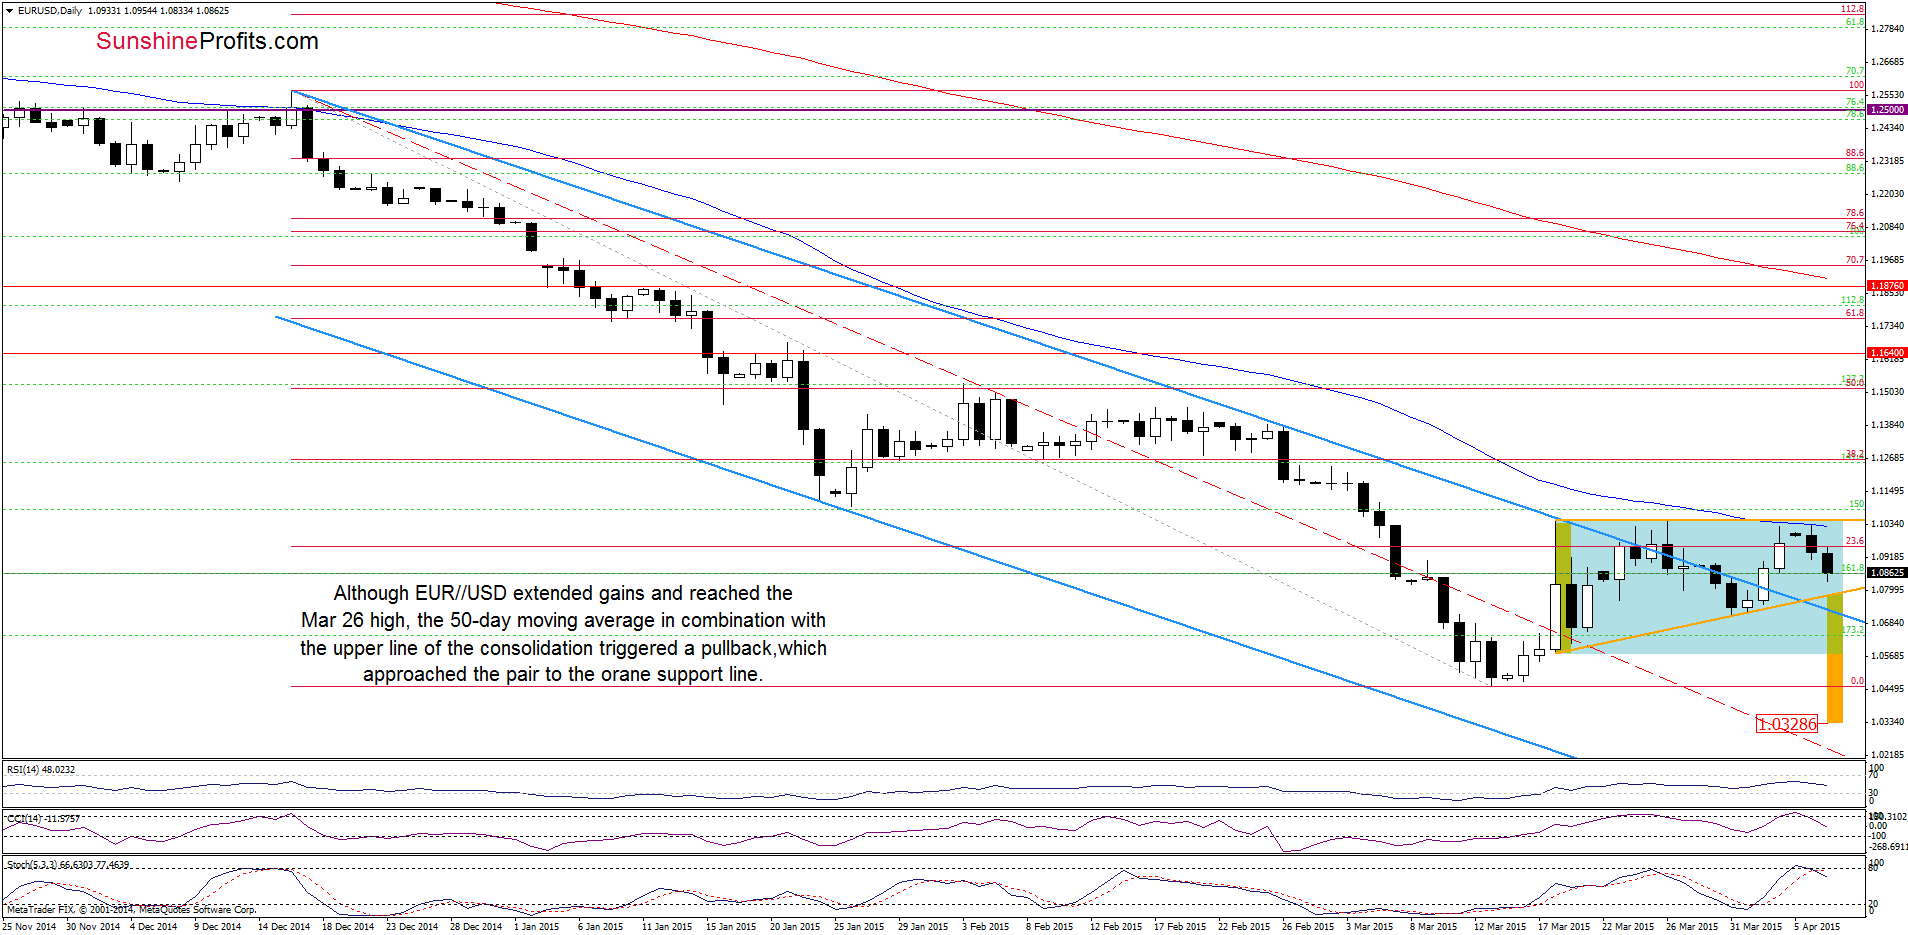
The first thing that catches the eye on the above chart is a breakout above the upper line of the declining trend channel (…) Additionally, the Stochastic Oscillator generated a buy signal, which together suggest further improvement and an increase to around the last week’s high. At this point it is worth noting that this area (1.1043-1.1051) is also reinforced by the 50-day moving average, which could pause further rally in the coming days.
Looking at the daily chart, we see that the situation developed in line with the above-mentioned scenario and EUR/USD moved lower after an increase to the previous highs. As you see on the chart, the combination of the 50-day moving average and the upper line of the consolidation triggered a pullback, which approached the pair to the orange support line. At this point it is worth noting that this is also the lower border of the triangle (marked with orange). Therefore, if EUR/USD rebound from here, we’ll see a comeback to the upper line of the formation. However, taking into account sell signals generated by the indicators, it seems that lower values of the exchange rate are ahead us. If this is the case, and the pair breaks below this key support line, we’ll see at least a test of the previously-broken upper border of the declining trend channel (currently at 1.0727. If it is broken, the next target for currency bears would be the lower line of the consolidation at 1.0579 or even March lows.
Very short-term outlook: mixed with bearish bias
Short-term outlook: mixed
MT outlook: mixed
LT outlook: mixed
Trading position (short-term; our opinion): No positions are justified from the risk/reward perspective at the moment. We will keep you informed should anything change, or should we see a confirmation/invalidation of the above.
USD/JPY
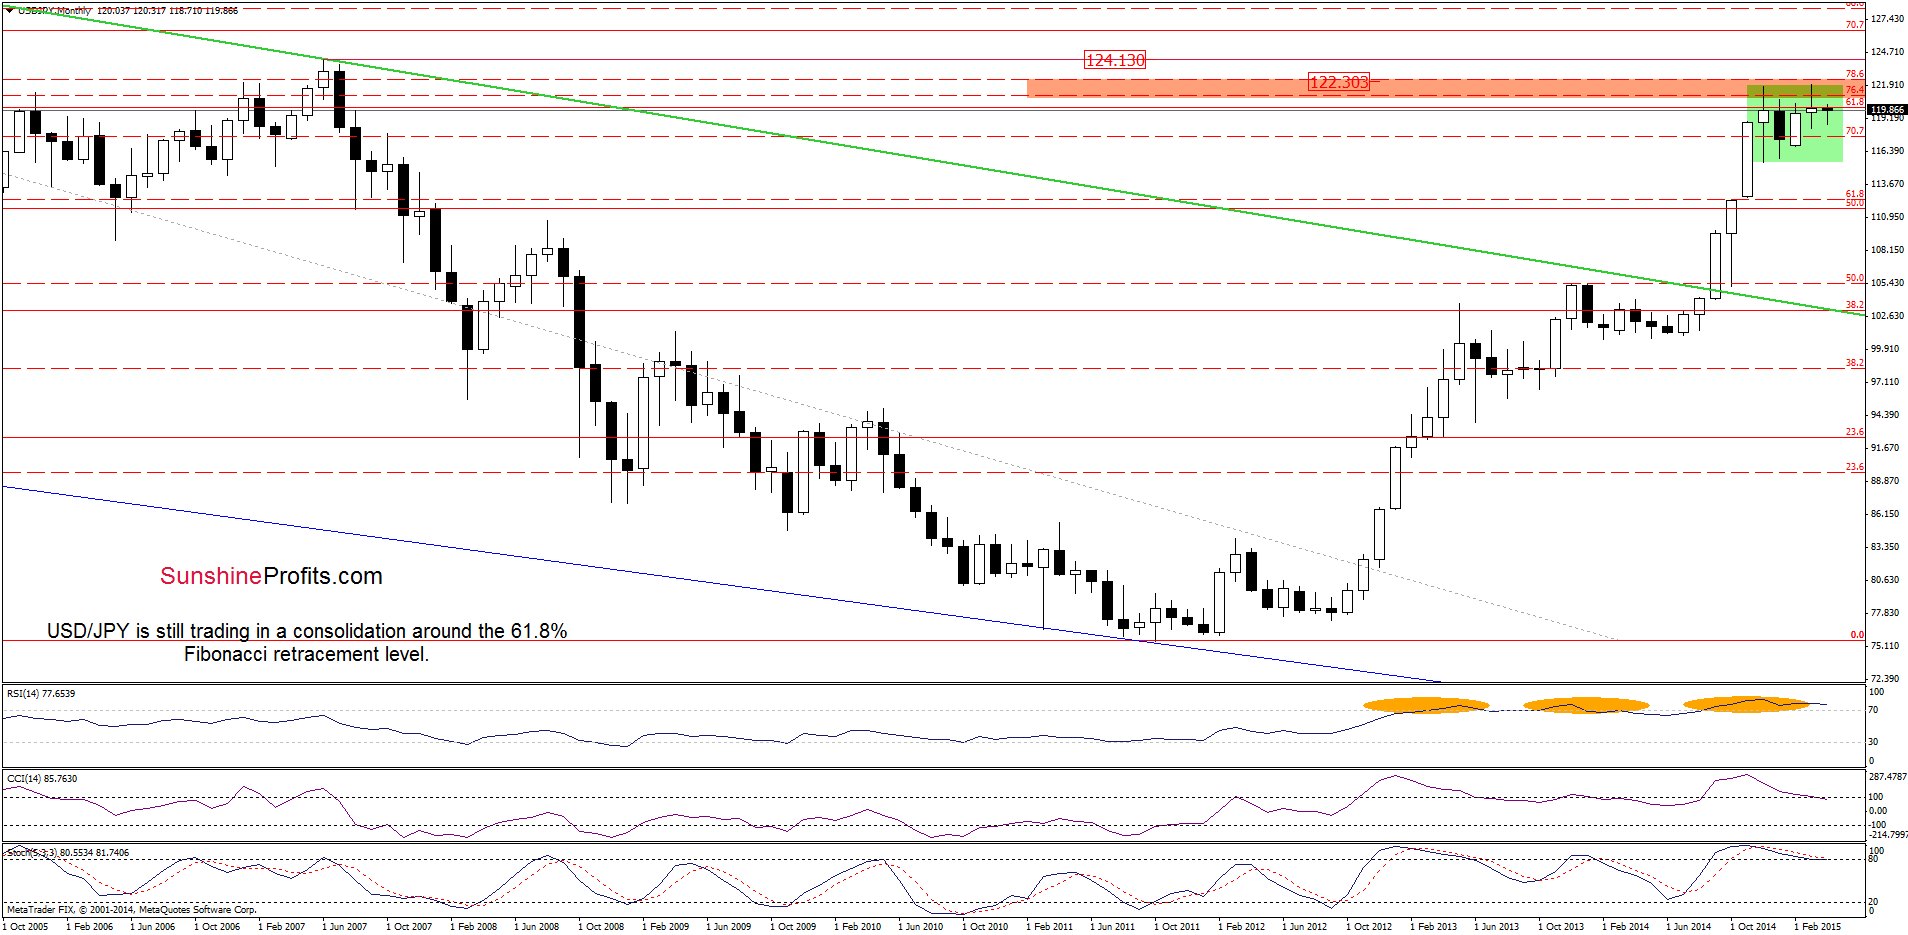
On the above chart, we see that USD/JPY is still trading in a consolidation (between the Dec high and low) around the 61.8% Fibonacci retracement level (based on the entire 1998-2011 declines), which makes the situation a bit unclear.
Having said that, let’s examine the daily chart and look for more clues about future moves.
Quoting our Forex Trading Alert posted on Wednesday:
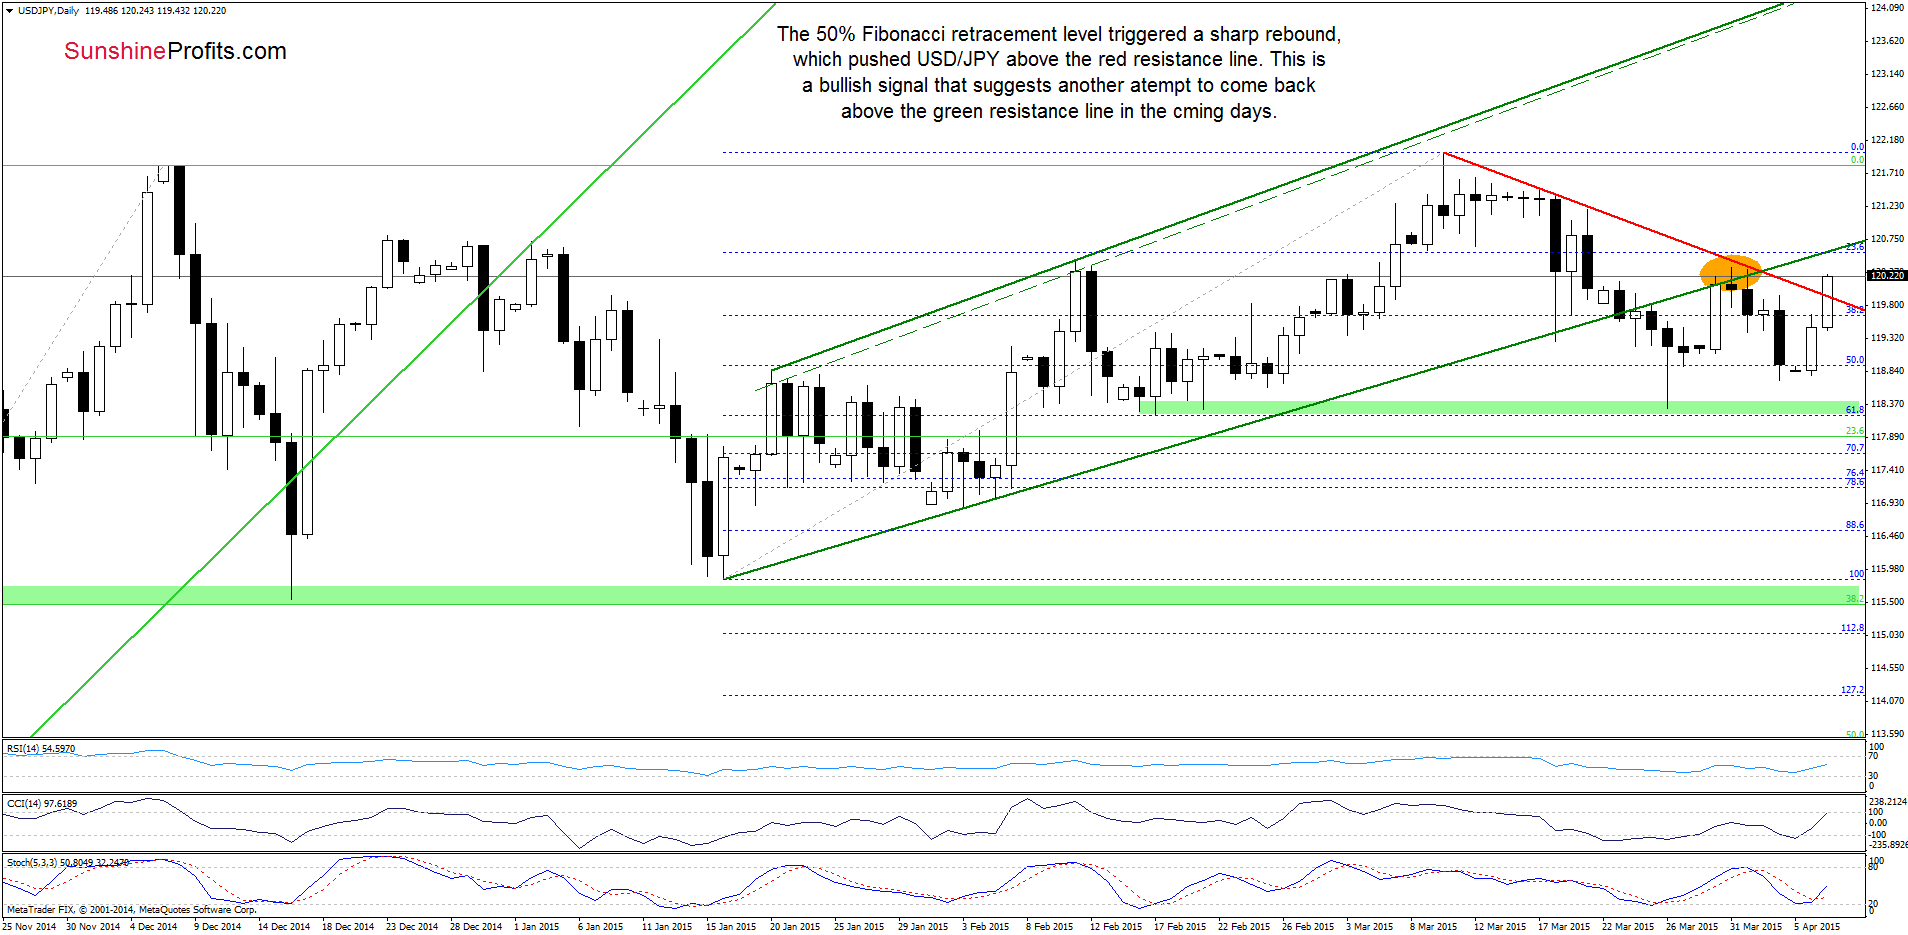
(…) USD/JPY came back below the green support/resistance line, which means that as long as this resistance area (marked with orange ellipse) is in play further improvement is not likely to be seen (…) the Stochastic Oscillator is almost overbought, which suggests that we’ll see a sell signal in the coming days. If this is the case and currency bulls won’t break above the orange resistance area, we’ll see a pullback to around 118.92-119.10 in the coming days.
From today’s point of view we see that currency bears pushed the pair lower as we expected and USD/JPY slipped to our downside target area. As you see, the 50% Fibonacci retracement level triggered a sharp rebound, which pushed USD/JPY above the red resistance line. This is a bullish signal, which suggests further improvement and another attempt to come back above the green resistance line in the coming day(s). Additionally, the CCI and Stochastic Oscillator generated buy signals, supporting the bullish case.
Very short-term outlook: bullish
Short-term outlook: mixed
MT outlook: mixed
LT outlook: bullish
Trading position (short-term; our opinion): No positions are justified from the risk/reward perspective at the moment. We will keep you informed should anything change, or should we see a confirmation/invalidation of the above.
USD/CHF
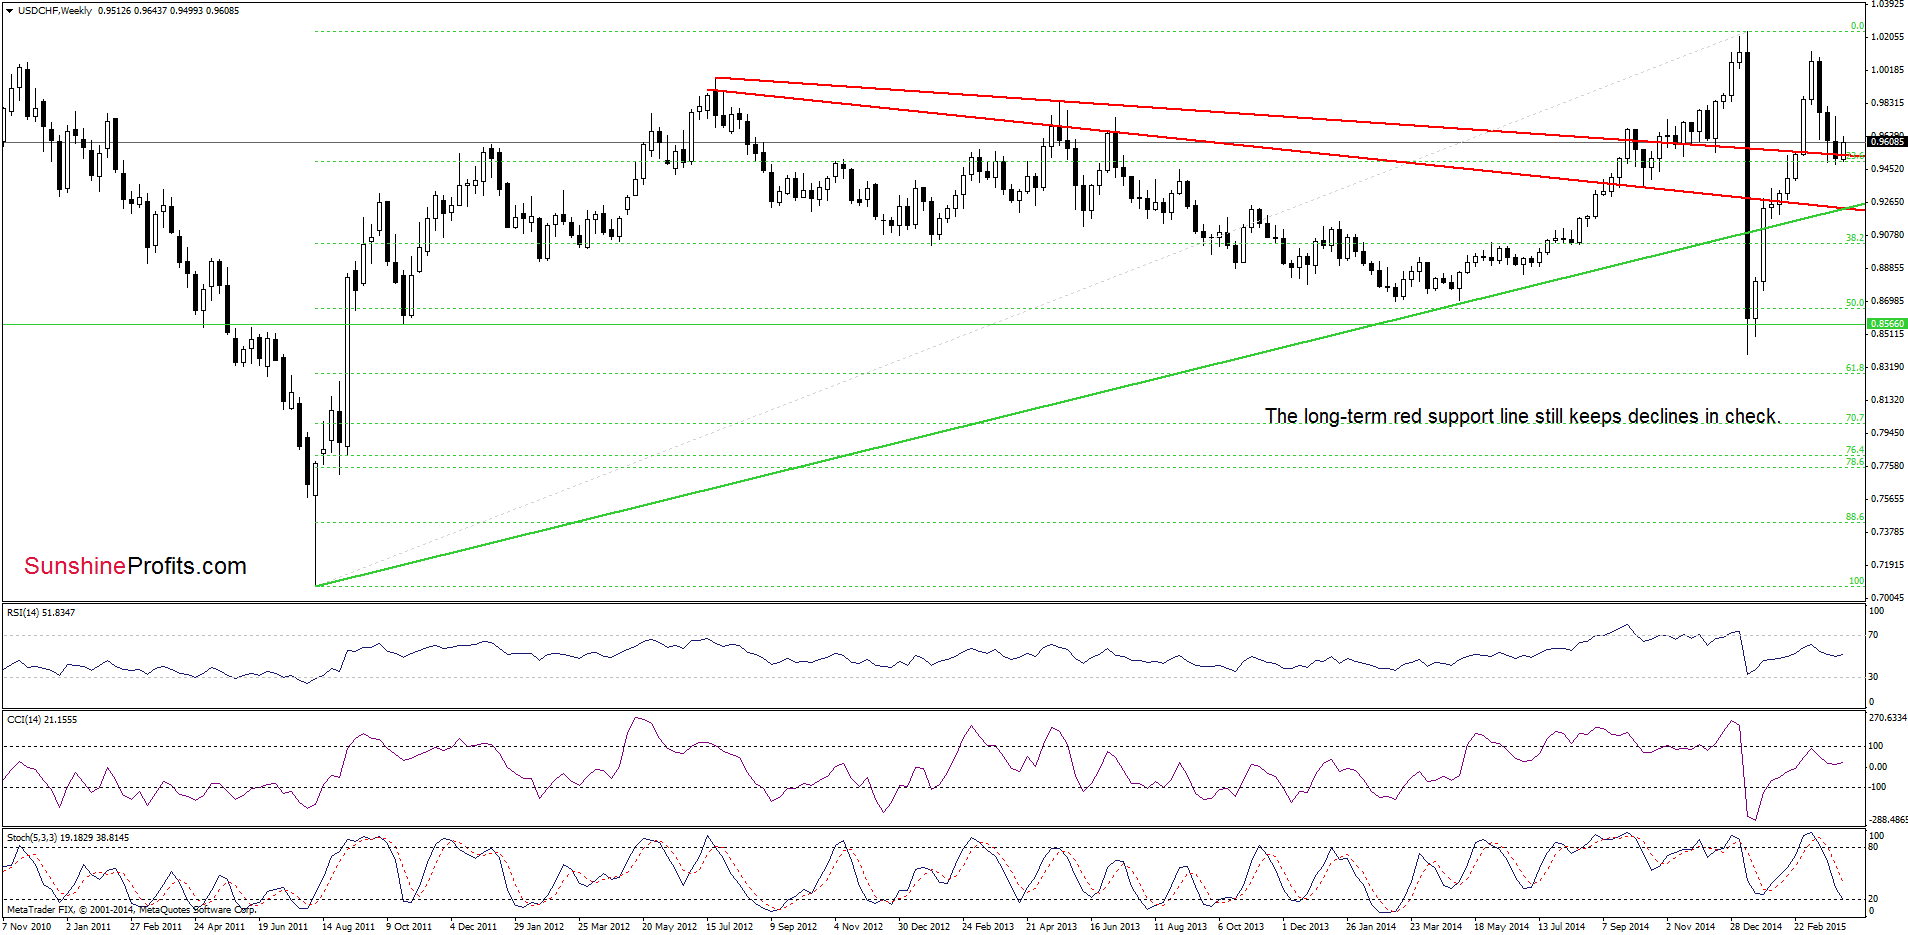
The situation in the medium-term perspective hasn’t changed much as USD/CHF still remains above the long-term red support line. Nevertheless, we should keep in mind that the sell signal generated by the Stochastic Oscillator is still in play, supporting the bearish case.
Having said that, let’s check what we can infer from the daily chart.
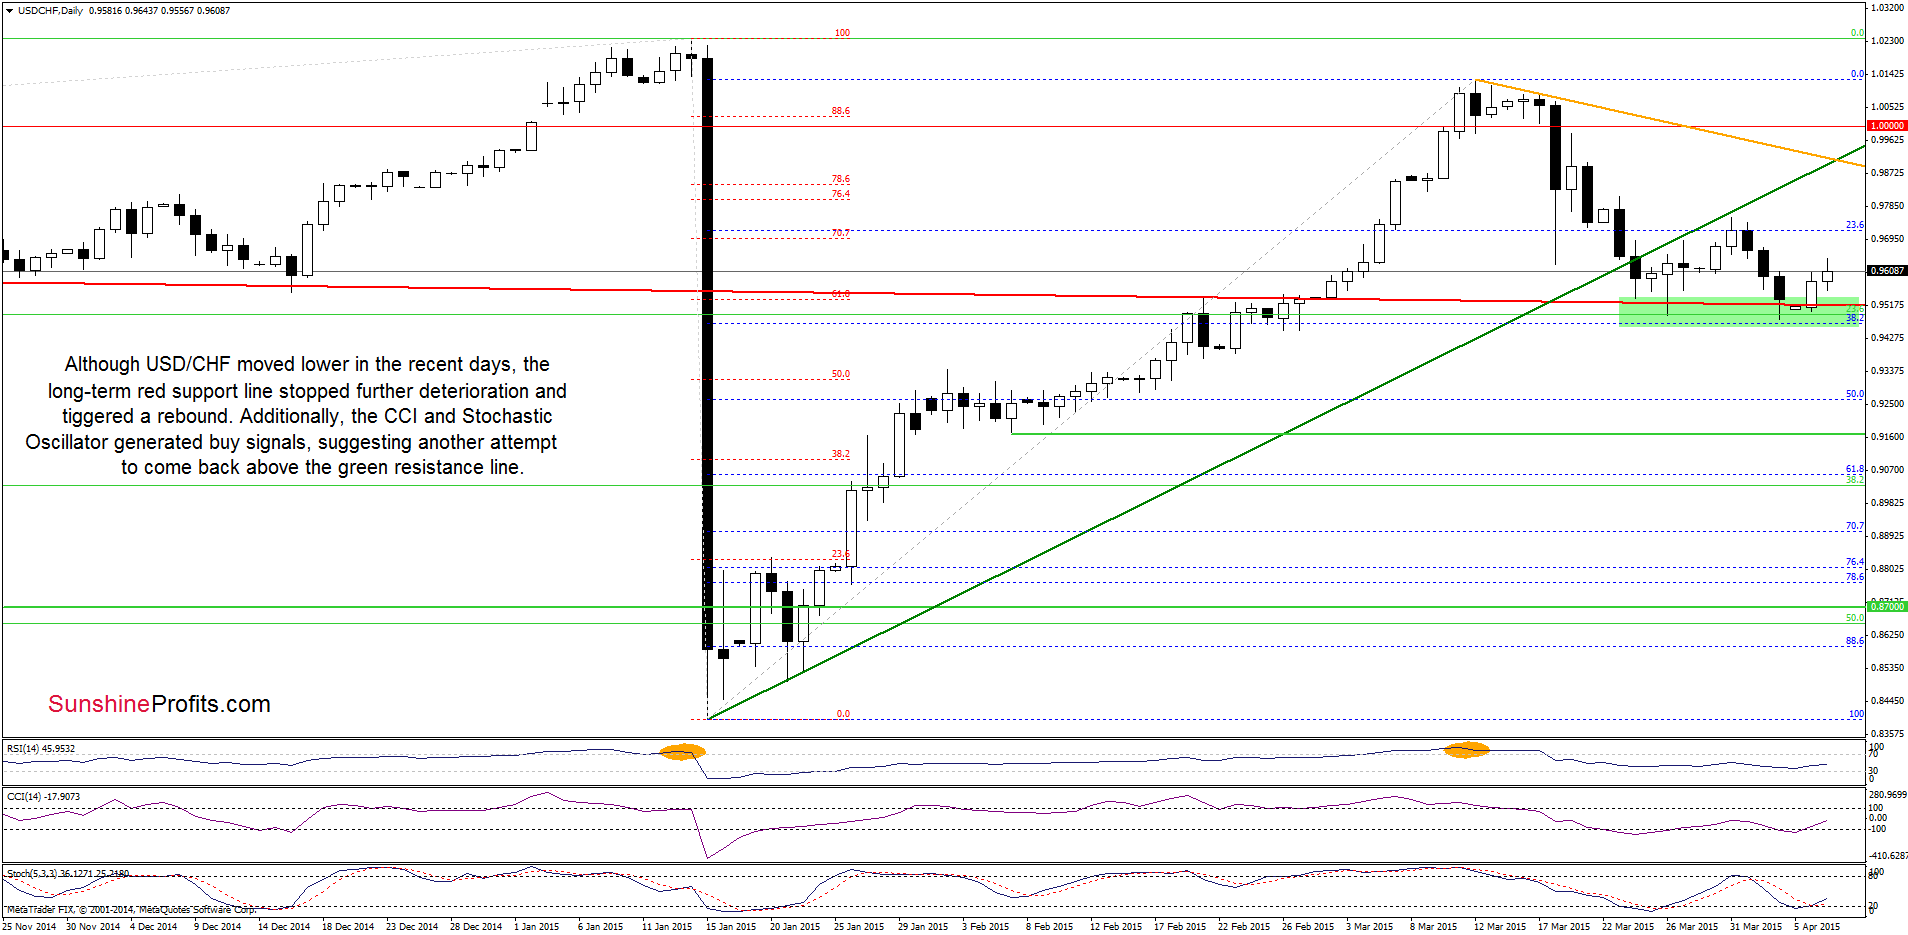
In our last commentary on this currency pair, we wrote the following:
(…) USD/CHF extended gains, approaching the previously-broken green support/resistance line. Despite this improvement, the proximity to this key resistance line triggered a pullback earlier today. (…) This suggests that as long as there is no comeback above it further improvement is questionable and another test of the strength of the long-term support line is likely. (…) the Stochastic Oscillator is close to generating a sell signal, which supports the bearish scenario.
On the daily chart we see that the situation developed in tune with the above-mentioned scenario and USD/CHF reached our downside target. As you see on the chart, the combination of the long-term red support line and the 38.2% Fibonacci retracement triggered a rebound. Additionally, the CCI and Stochastic Oscillator generated buy signals, supporting the bullish case and suggesting further improvement. If this is the case, the initial upside target for currency bulls would be the previously-broken green resistance line, which currently intersects the orange resistance line based on the recent highs (around 0.9900).
Very short-term outlook: bullish
Short-term outlook: mixed
MT outlook: mixed
LT outlook: bearish
Trading position (short-term; our opinion): No positions are justified from the risk/reward perspective at the moment. We will keep you informed should anything change, or should we see a confirmation/invalidation of the above.
Thank you.
Nadia Simmons
Forex & Oil Trading Strategist
Przemyslaw Radomski, CFA
Founder, Editor-in-chief
Gold & Silver Trading Alerts
Forex Trading Alerts
Oil Investment Updates
Oil Trading Alerts
