

Forex Trading Alert originally sent to subscribers on March 5, 2015, 9:46 AM.
Earlier today, EUR/USD extended losses, hitting a fresh 2015 low ahead of a European Central Bank meeting later in the day. Will today’s Mario Draghi commentary support or rather sink the common currency against the U.S. dollar? Before we know the answer to this question, it is worth to take a closer look at the technical picture of the exchange rate.
In our opinion the following forex trading positions are justified - summary:
- EUR/USD: none
- GBP/USD: none
- USD/JPY: none
- USD/CAD: short (stop loss order at 1.2876)
- USD/CHF: none
- AUD/USD: none
EUR/USD
In our previous Forex Trading Alert, we wrote the following:
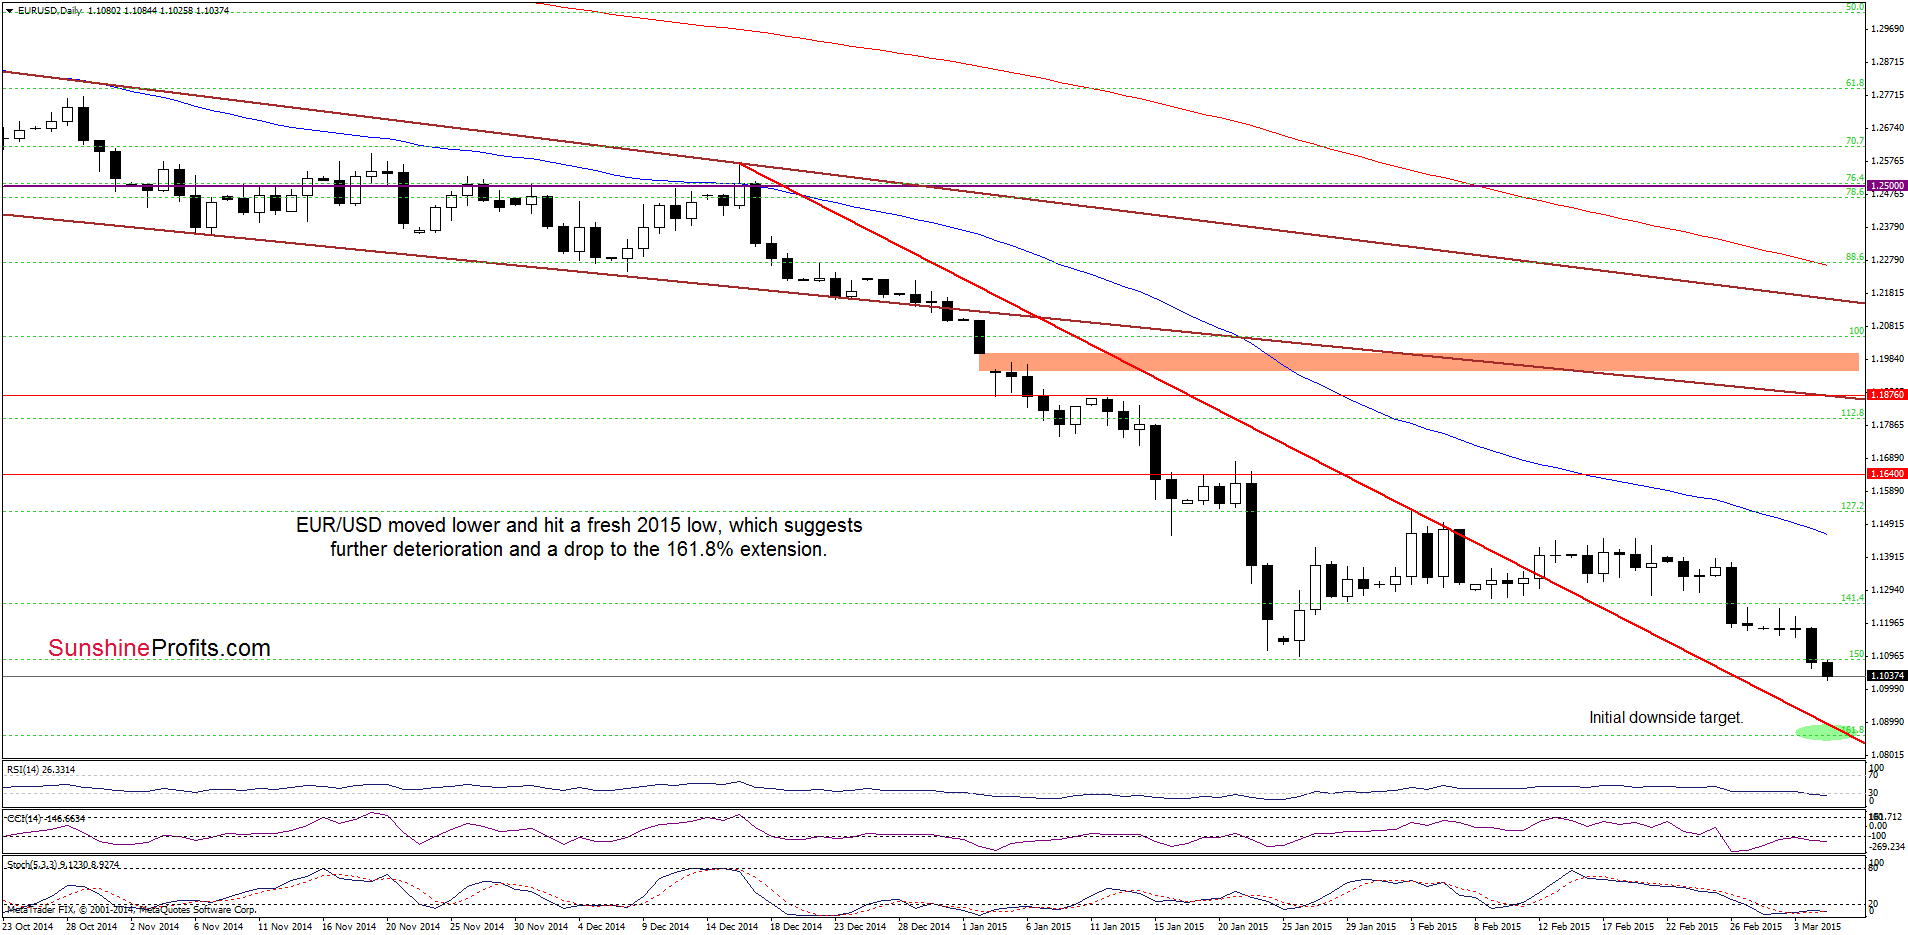
(…) we could see further deterioration in the coming days. If this is the case, the downside target for currency bears would be the 2015 low of 1.1097.
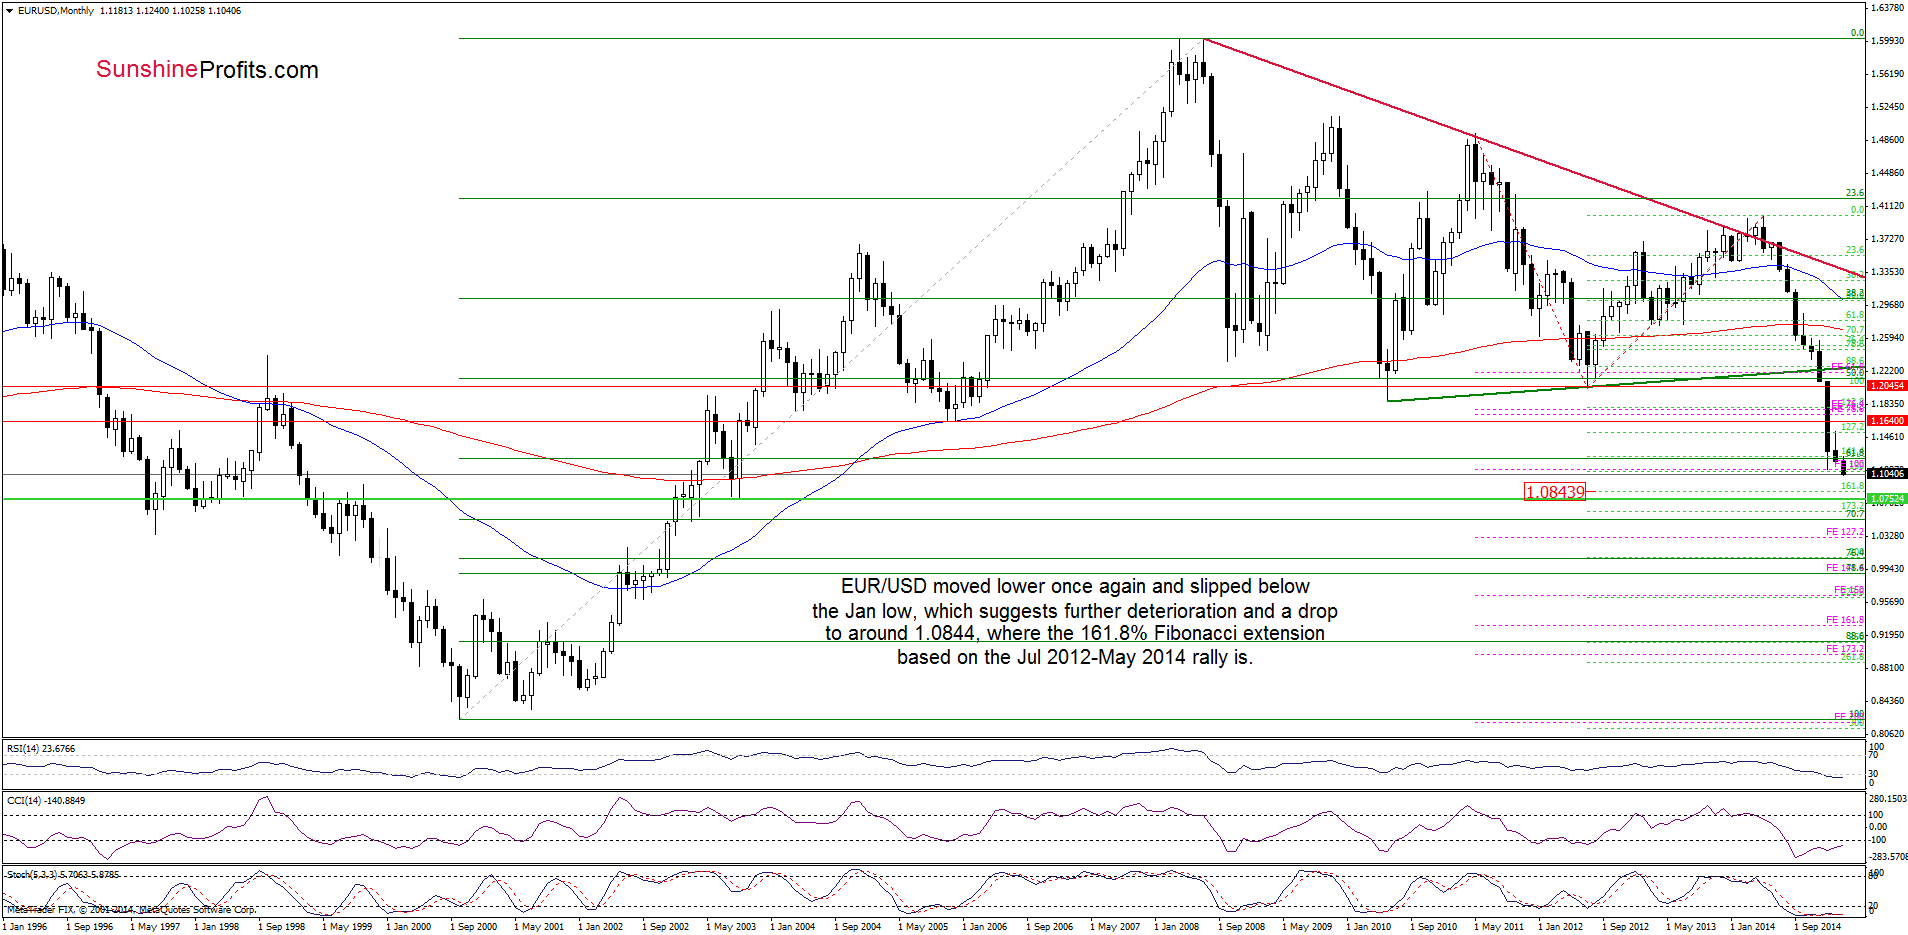
Looking at the charts, we see that currency bears not only took EUR/USD to our downside target, but also managed to push the pair to a fresh 2015 low earlier today. This is a negative signal which suggests further deterioration and a drop to around 1.0844, where the 161.8% Fibonacci extension (based on the Jul 2012 – May 2014 rally is. Additionally, slightly above this level is also the medium-term red declining resistance line, which supports this area.
Very short-term outlook: bearish
Short-term outlook: mixed
MT outlook: mixed
LT outlook: mixed
Trading position (short-term; our opinion): No positions are justified from the risk/reward perspective at the moment. We will keep you informed should anything change, or should we see a confirmation/invalidation of the above.
USD/CAD
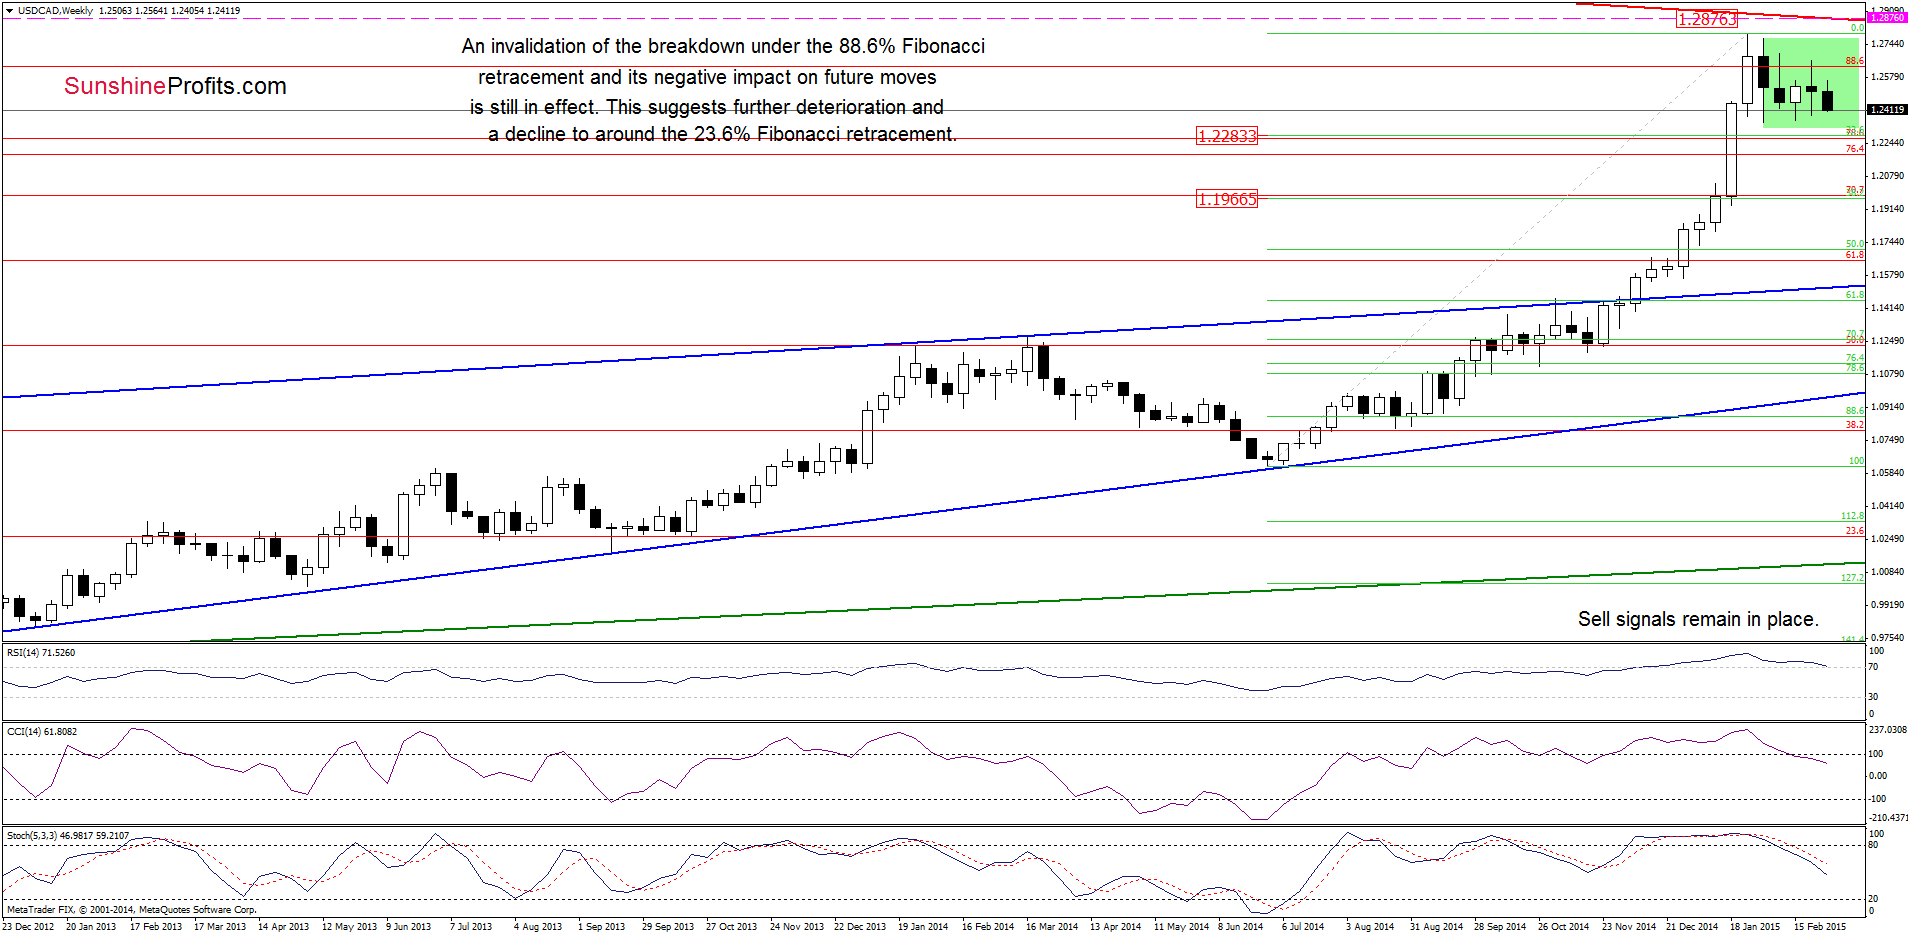
The situation in the medium-term hasn’t changed much as the invalidation of the breakout above the 88.6% Fibonacci retracement and its negative impact on future moves is still in effect. Therefore, our last commentary is up-to-date:
(…) we believe that further deterioration is just around the corner. If this is the case, the initial downside target would be the 23.6% Fibonacci retracement based on the entire Jun-Jan rally (around 1.2275). If it is broken, we’ll see a decline to the 38.2% retracement (at 1.1973) in the coming week. Additionally, sell signals generated by the CCI and Stochastic Oscillator are still in play, supporting the bearish case.
Having said that, let’s check the daily chart.
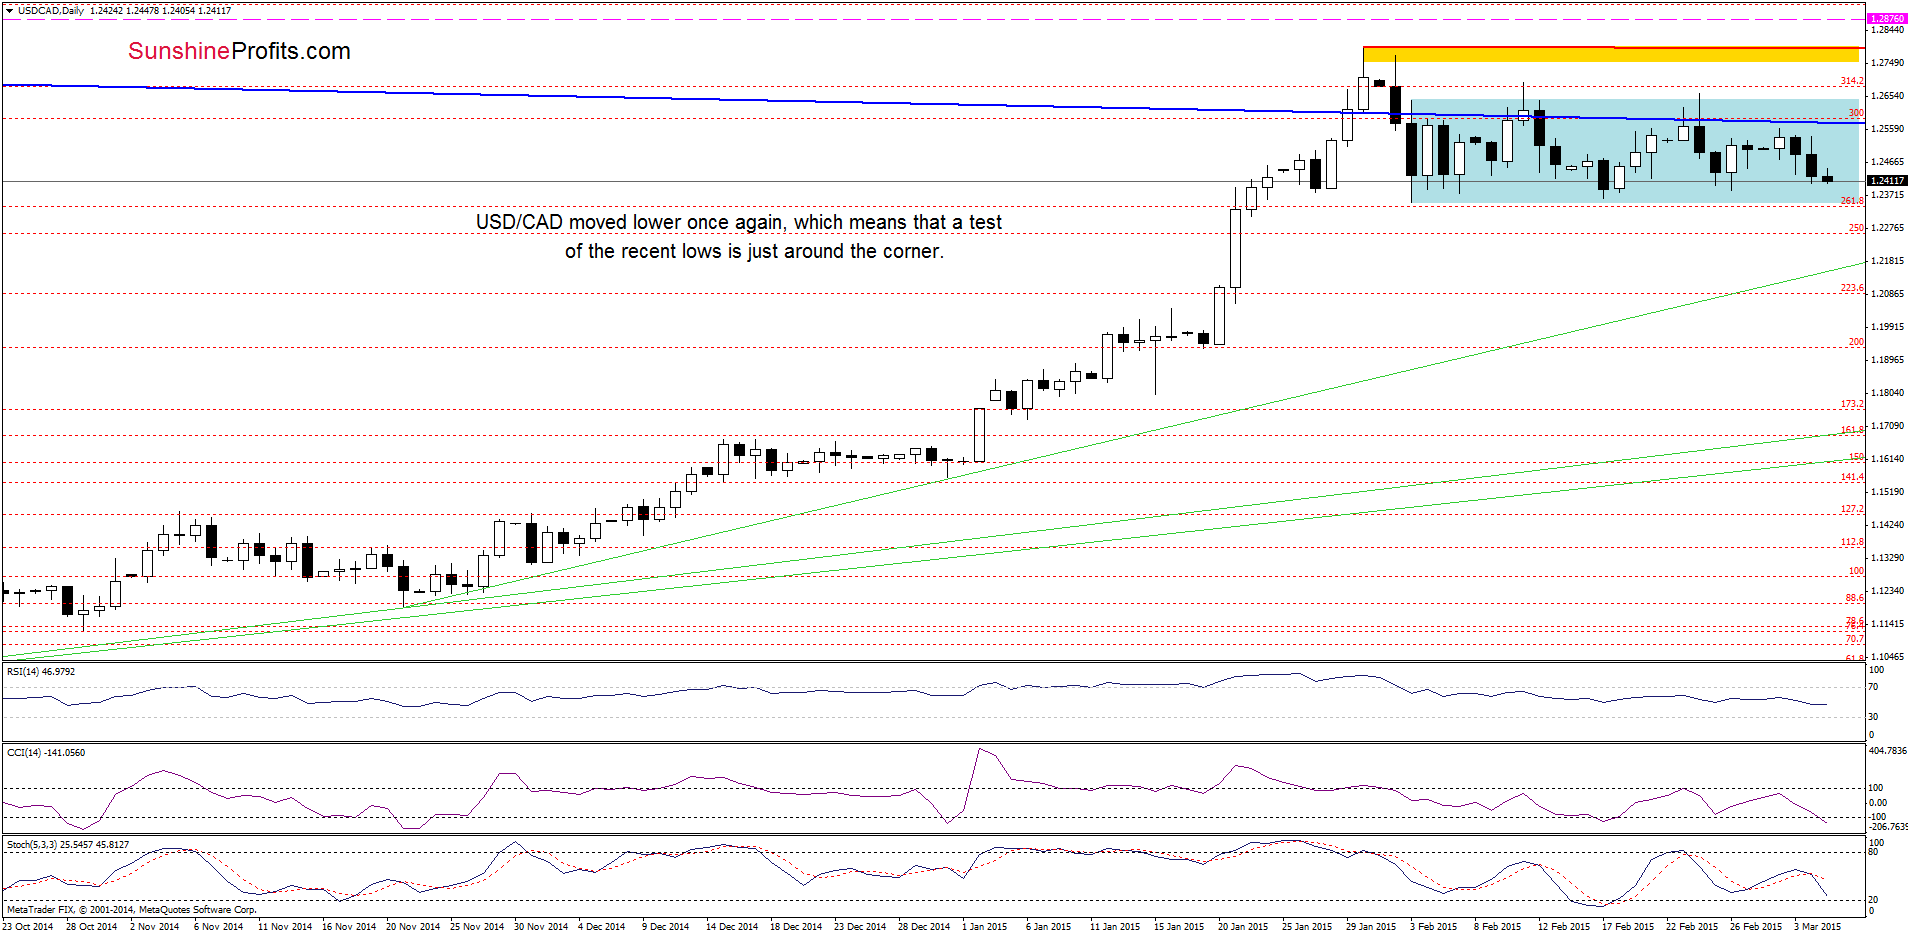
From this perspective, we see that USD/CAD moved lower once again, which means that another test of the support zone created by the recent lows (around 1.2351-1.2361) is just around the corner.
Very short-term outlook: bearish
Short-term outlook: mixed with bearish bias
MT outlook: mixed
LT outlook: mixed
Trading position (short-term; our opinion): Short positions with a stop loss order at 1.2876 are still justified from the risk/reward perspective. We will keep you informed should anything change, or should we see a confirmation/invalidation of the above.
USD/CHF
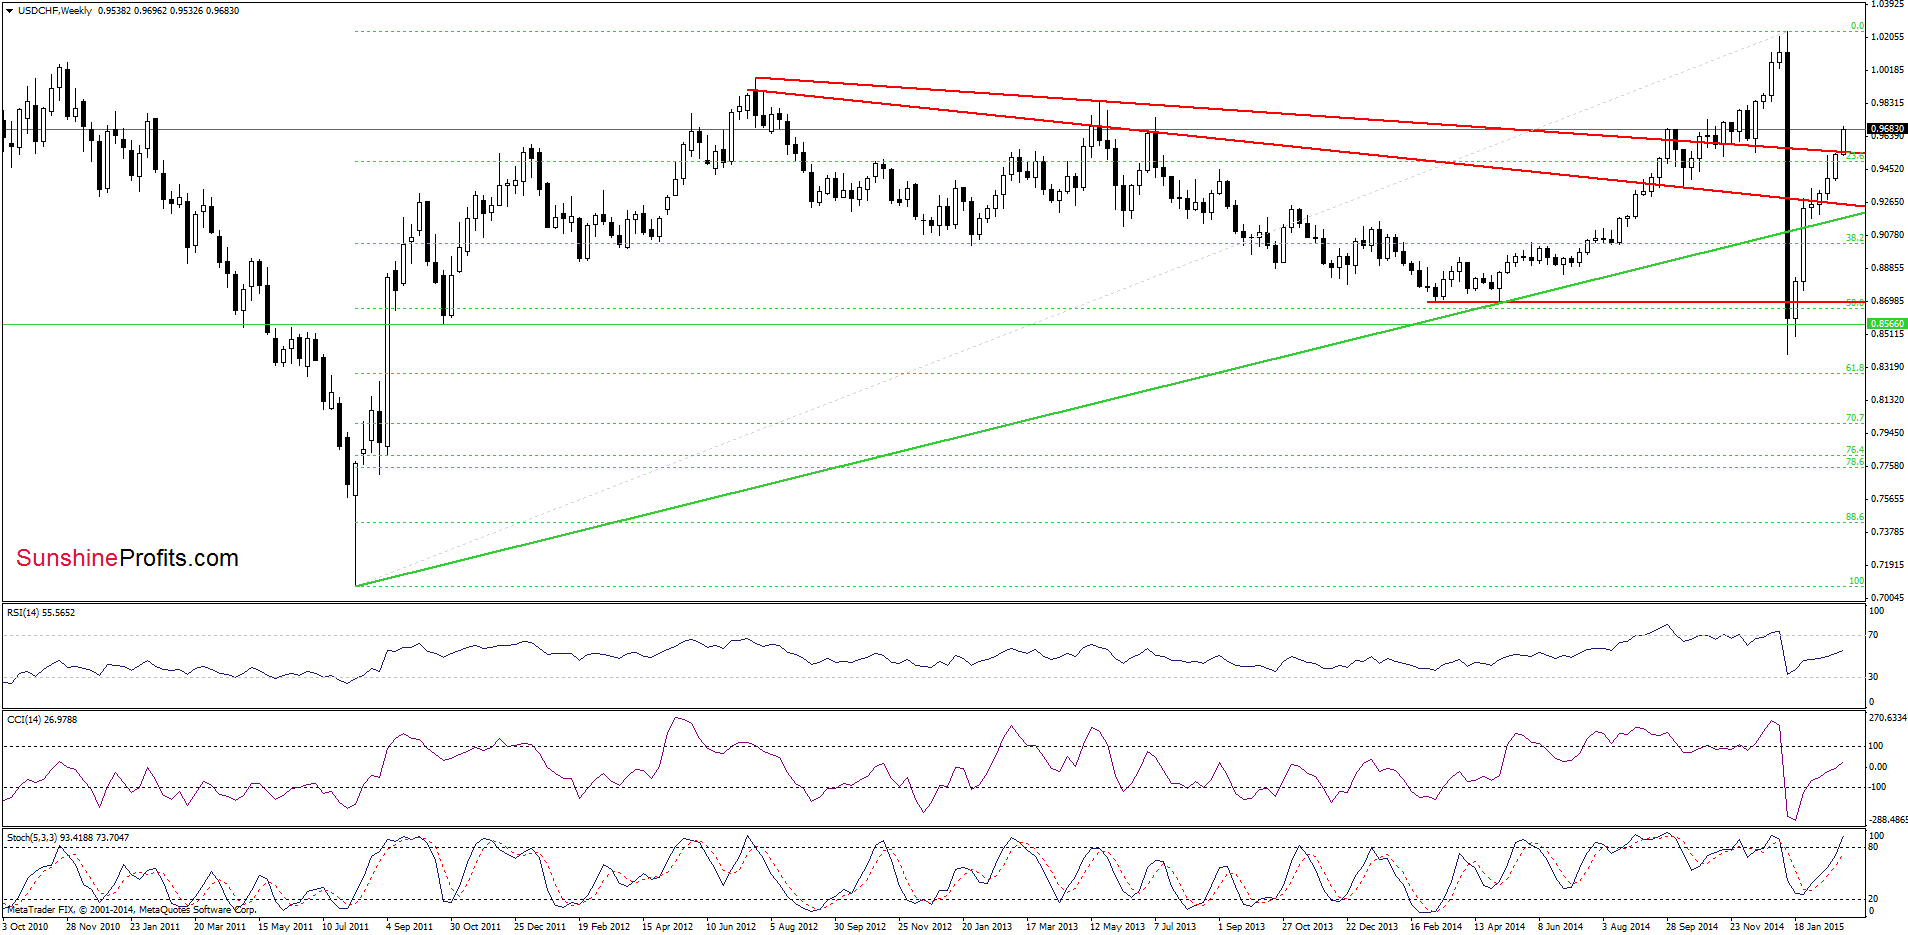
On the above chart, we see that the situation in the medium term has improved as USD/CHF extended gains and climbed well above the last week’s high. Additionally, buy signals generated by the indicators are still in play, supporting the bullish case.
How high could the exchange rate go? Let’s examine the daily chat and find out.
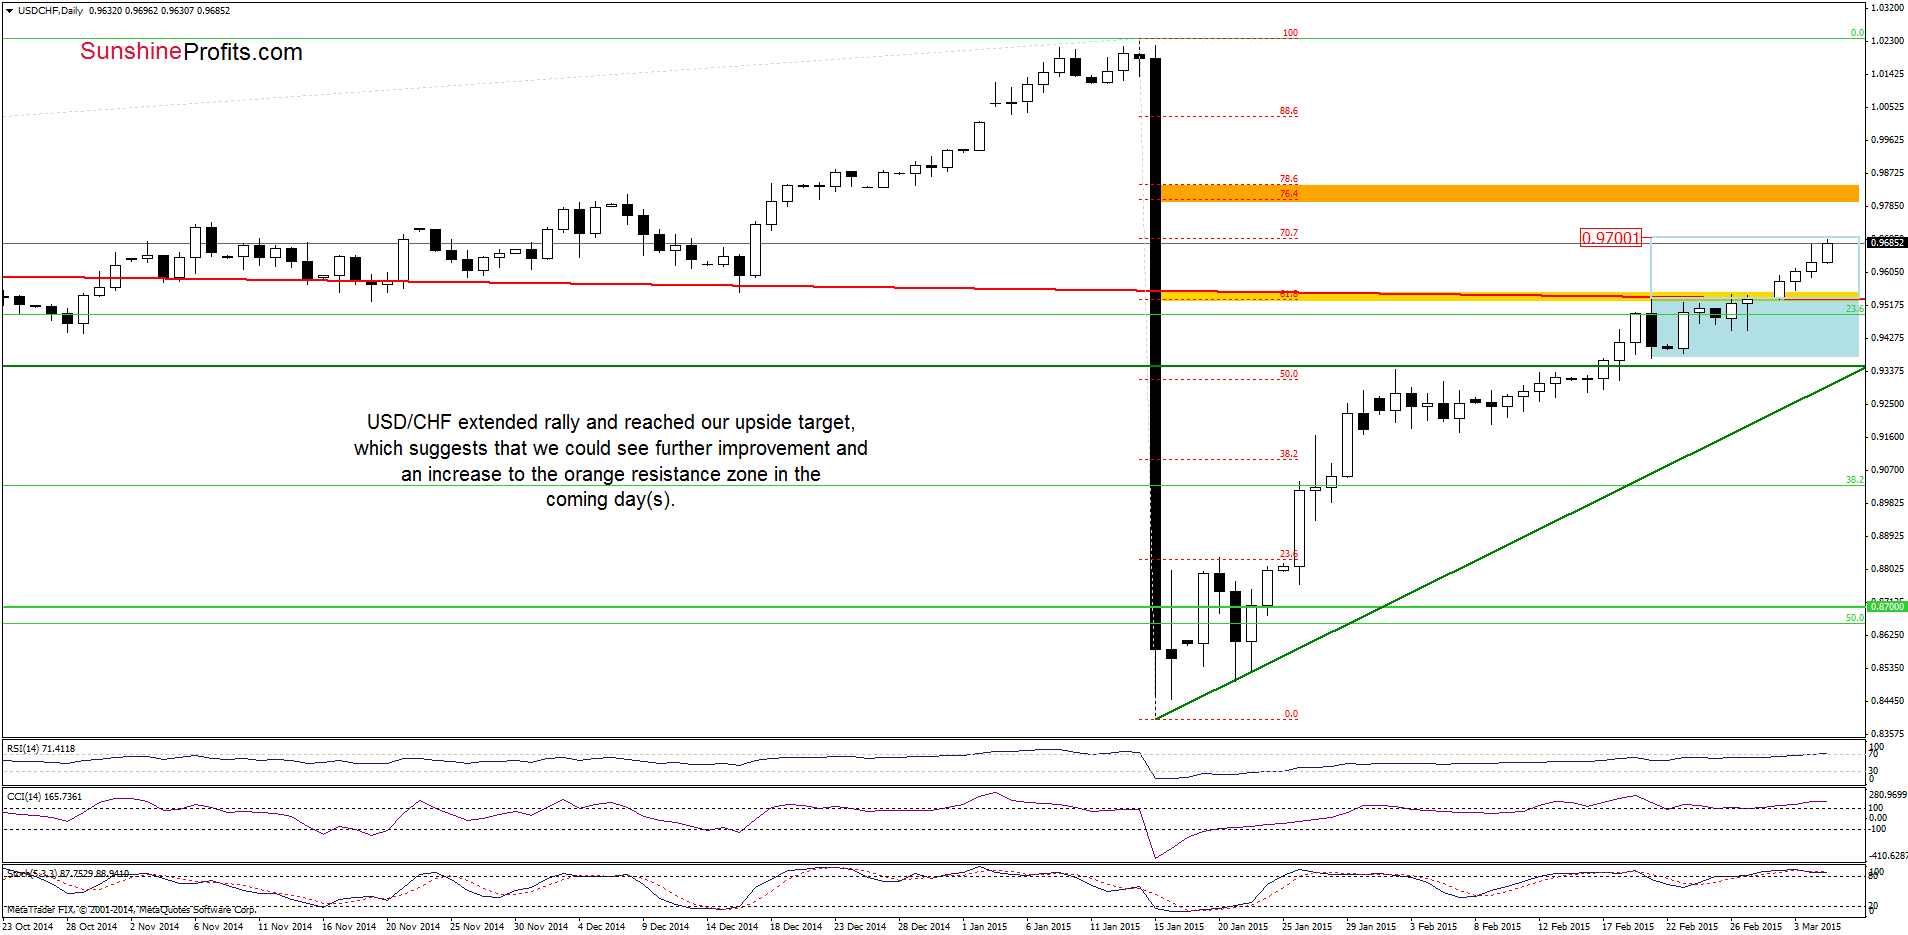
Quoting our last commentary on this currency pair:
(…) USD/CHF broke not only above the upper line of the consolidation, but also climbed above the yellow resistance zone created by the 61.8% Fibonacci retracement and the previously-broken long-term resistance line. This is a bullish signal, which suggests further improvement and an increase to around 0.9700, where the size of the upswing will correspond to the height of the formation and where the 70.7% Fibonacci retracement is.
As you see on the daily chart, the situation developed in line with the above-mentioned scenario and the exchange rate almost touched our upside target, hitting an intraday high of 0.9696 earlier today. Taking this fact into account and combining it with the medium-term picture, it seems that the pair could move even higher in the coming day(s). If this is the case, and USD/CHF breaks above the barrier of 0.9700 we’ll likely see a rally to around 0.9797-0.9844, where the orange resistance zone created by the 76.4% and 78.6% Fibonacci retracement levels is.
Nevertheless, we should keep in mind that the CCI and Stochastic Oscillator are overbought, while RSI climbed above the level of 70, which suggests that the space for further rally might be limited and the probability of a trend reversal is just around the corner (especially if the indicators generate sell signals in the coming days).
Very short-term outlook: mixed with bullish bias
Short-term outlook: mixed
MT outlook: mixed
LT outlook: bearish
Trading position (short-term; our opinion): No positions are justified from the risk/reward perspective at the moment. We will keep you informed should anything change, or should we see a confirmation/invalidation of the above.
Thank you.
Nadia Simmons
Forex & Oil Trading Strategist
Przemyslaw Radomski, CFA
Founder, Editor-in-chief
Gold & Silver Trading Alerts
Forex Trading Alerts
Oil Investment Updates
Oil Trading Alerts
