
Forex Trading Alert originally sent to subscribers on January 8, 2015, 6:50 AM.
Earlier today, the Australian Bureau of Statistics reported that building approvals increased by 7.5% in November, beating expectations for a 3.5% decline. Thanks to these bullish numbers, AUD/USD bounced off yesterday’s low and climbed above its major resistance line once again. Will we see further rally?
In our opinion the following forex trading positions are justified - summary:
EUR/USD
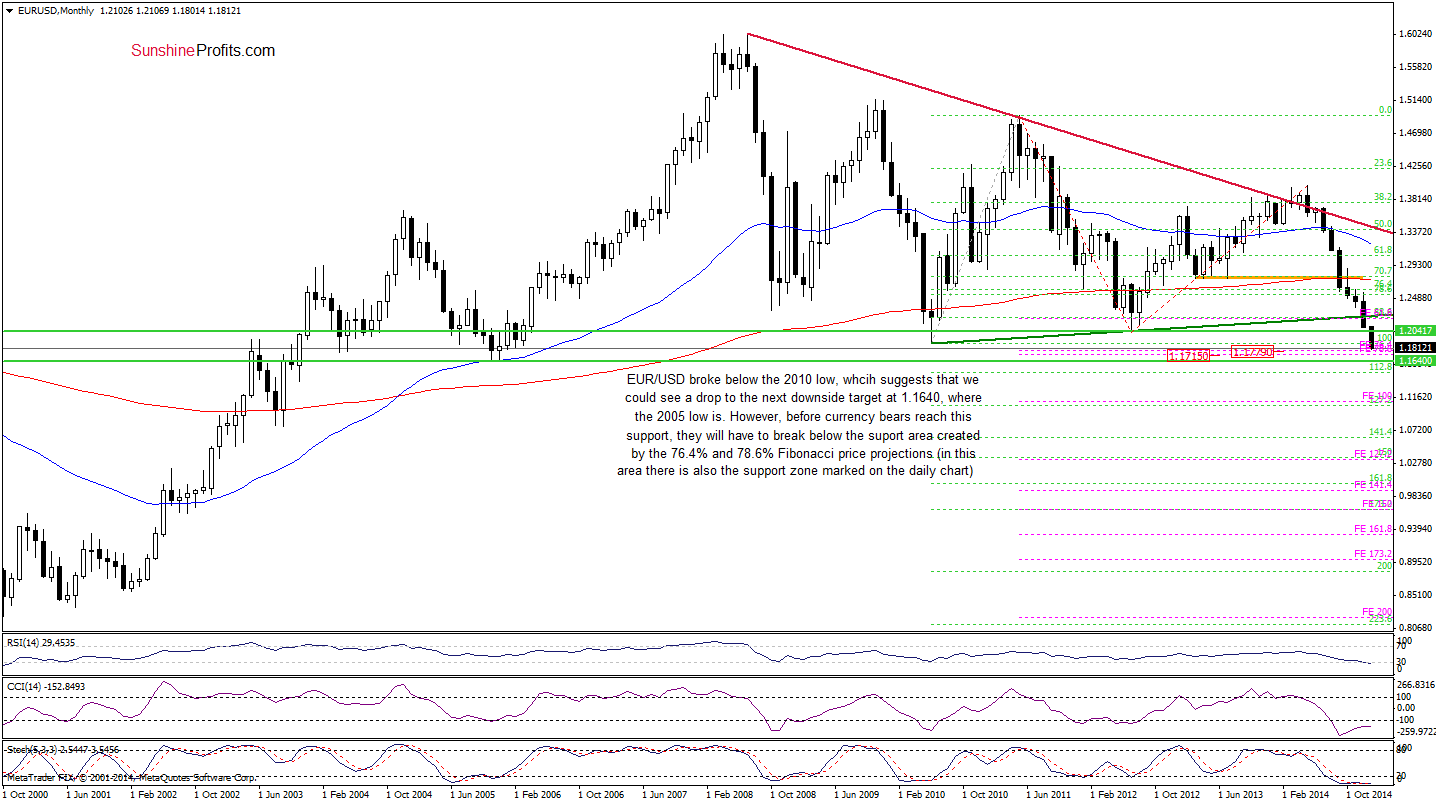
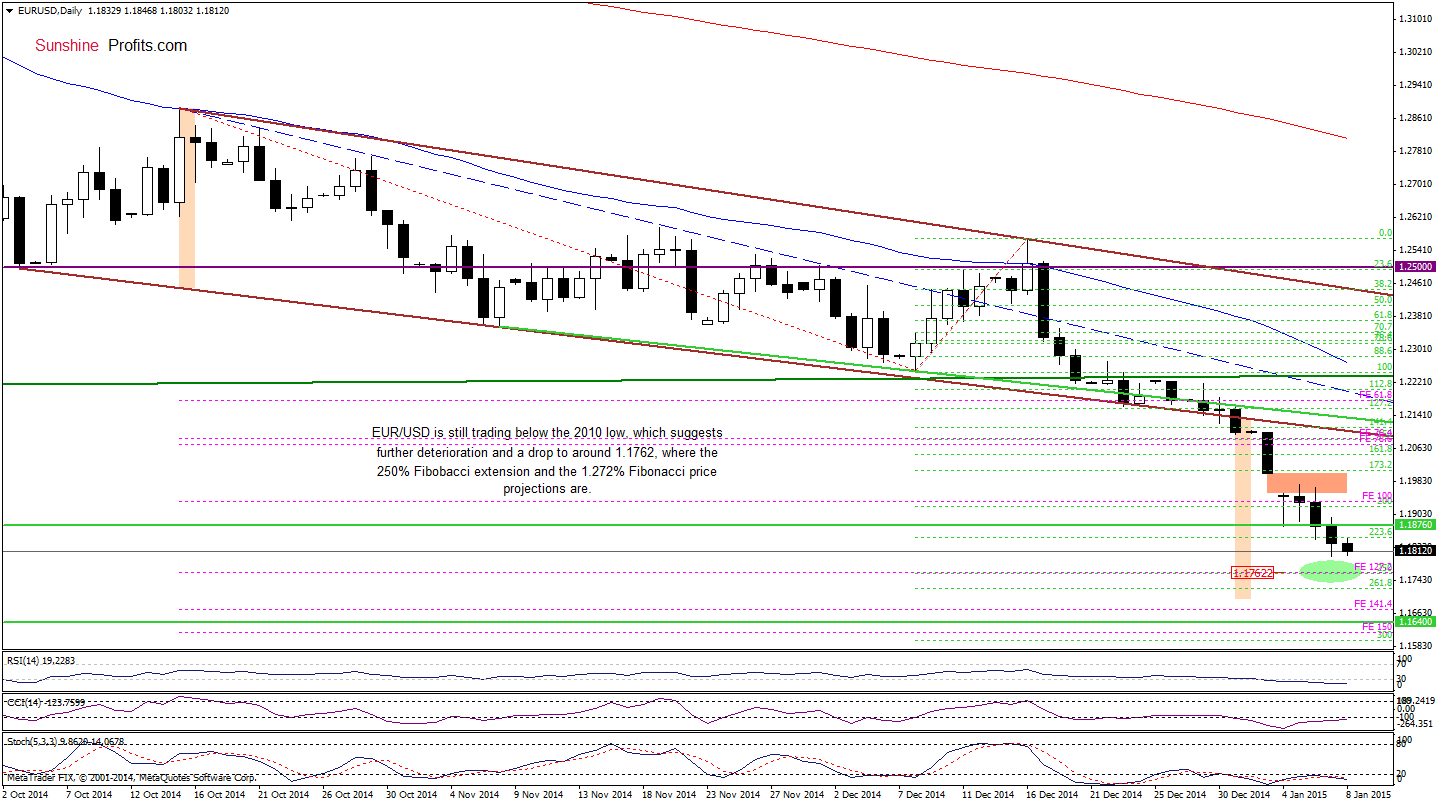
Looking at the above charts, we see that the situation hasn’t changed much as EUR/USD is still trading below the previously-broken 2010 low. Taking this fact into account, we believe that our last commentary on this currency pair is up-to-date:
(…) we think that the exchange rate will move lower once again and the downside target would be around 1.1762, where the 250% Fibonacci extension and the 127.2% Fibonacci price projection is. At this point, it’s worth noting that this level is in a support area around 1.1715-1.1779 (marked on the weekly chart and created by the 76.4% and 78.6% Fibonacci price projections), which suggests that we could see a rebound from here in the coming week.
Very short-term outlook: bearish
Short-term outlook: mixed
MT outlook: mixed
LT outlook: bearish
Trading position (short-term): In our opinion, no positions are justified from the risk/reward perspective at the moment. We will keep you informed should anything change, or should we see a confirmation/invalidation of the above.
GBP/USD
Quoting our last commentary on this currency pair:
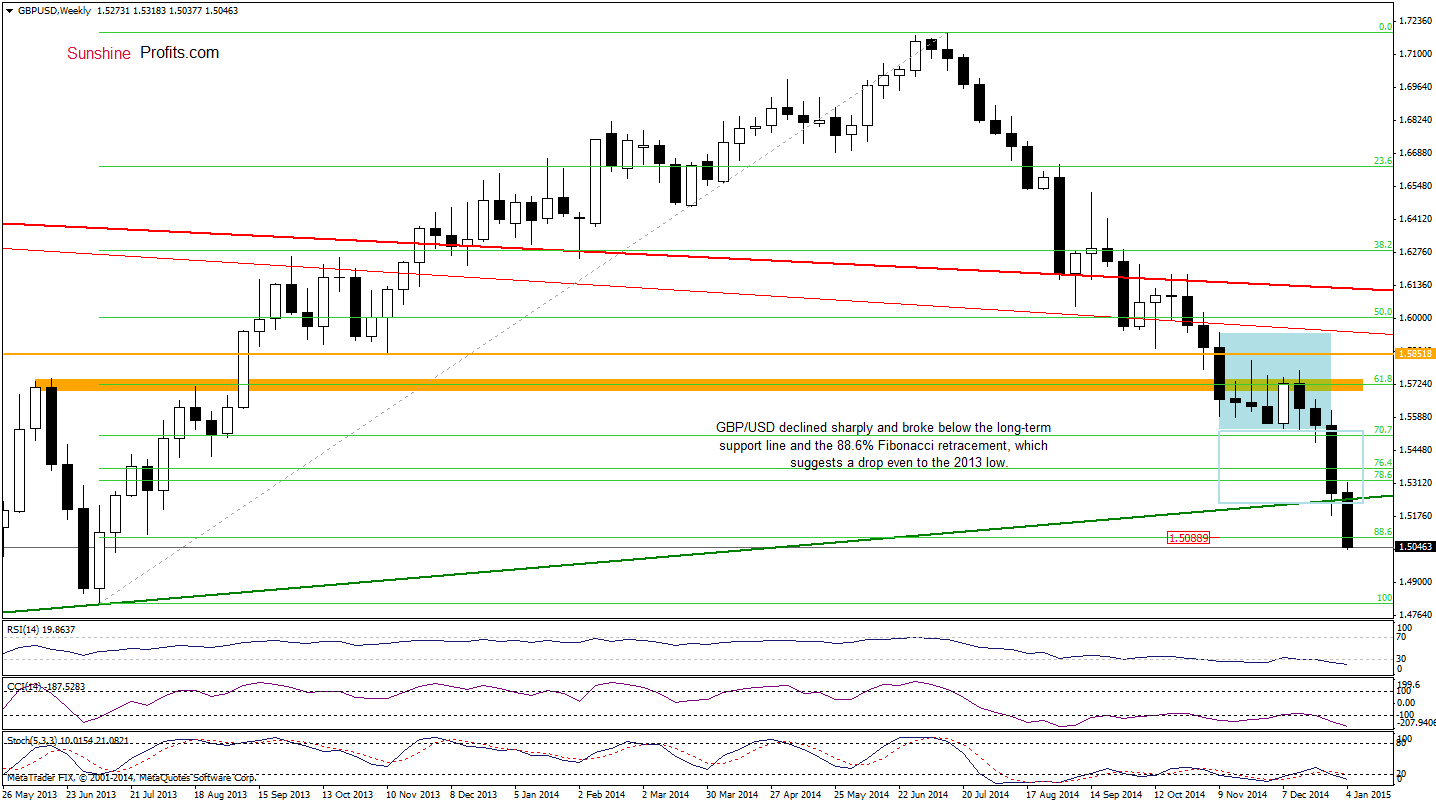
(…) currency bears (…) took GBP/USD to the long-term green support line. At this point, it’s worth noting that this area is also supported by the medium-term support line based on the Sep 10 and Nov 14 lows. Therefore, (…), if the pair drops lower, it would be a strong bearish signal, which could push GBP/USD to (at least) the 88.6% Fibonacci retracement (at 1.5089). Taking all the above into account, we think that the most important event, which could affect future moves will be today’s closing price because if we see a daily close under these lines, the probability of further declines will increase.
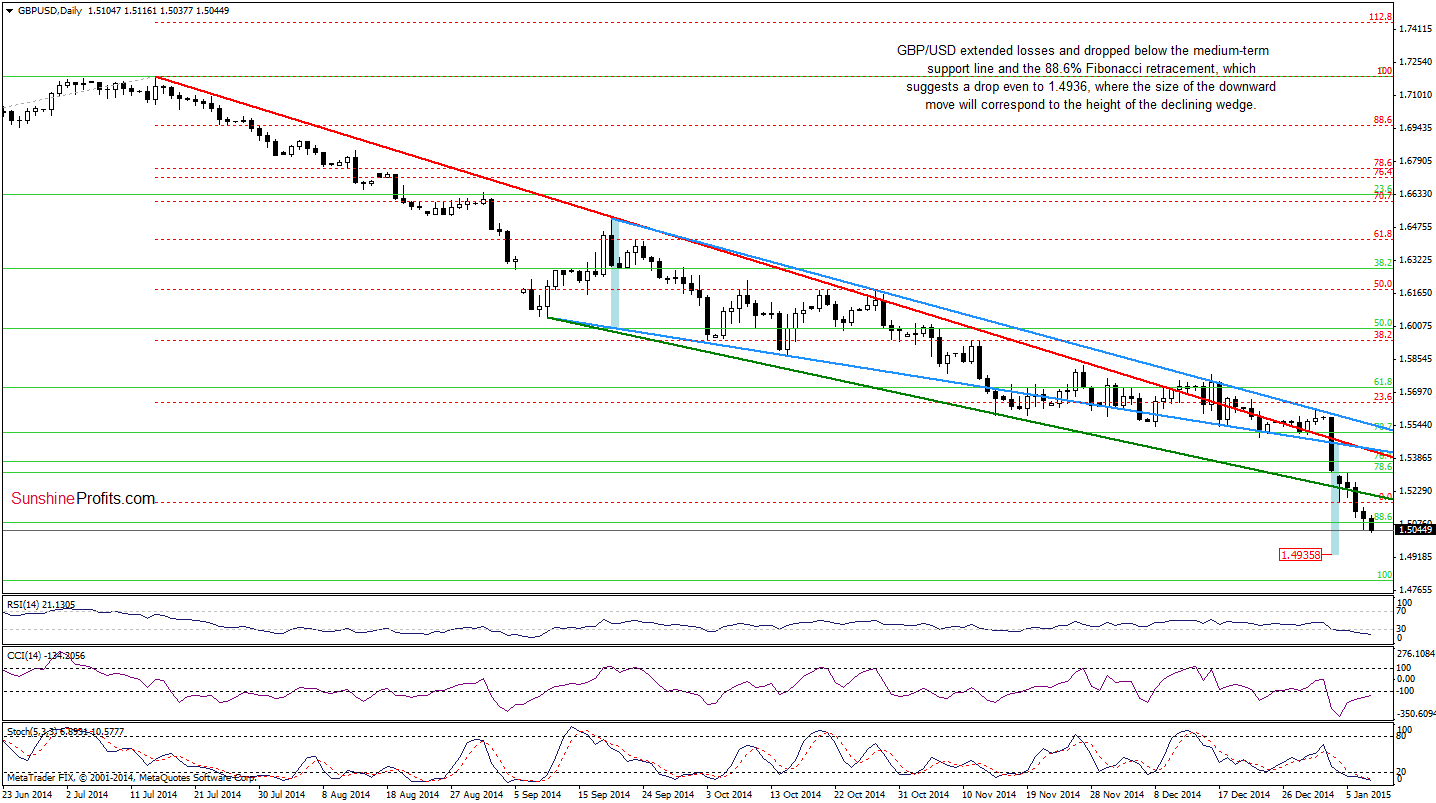
As you see on the charts, the situation developed in line with the above-mentioned scenario and GBP/USD slipped to our downside target yesterday, declining below the long-term green support line (a strong bearish signal). Although the exchange rate rebounded slightly, invalidating a small breakdown under the 88.6% Fibonacci retracement, currency bears didn’t give up and pushed the pair lower earlier today. This is a negative signal, which suggests that we could see a drop to around 1.4936, where the size of the downward move will correspond to the height of the declining wedge (marked with blue on the daily chart) or even to the Jul 2013 low of 1.4812 in the coming days.
Very short-term outlook: bearish
Short-term outlook: mixed
MT outlook: mixed
LT outlook: mixed
Trading position (short-term): In our opinion, no positions are justified from the risk/reward perspective at the moment. We will keep you informed should anything change, or should we see a confirmation/invalidation of the above.
AUD/USD
Yesterday, we wrote the following:
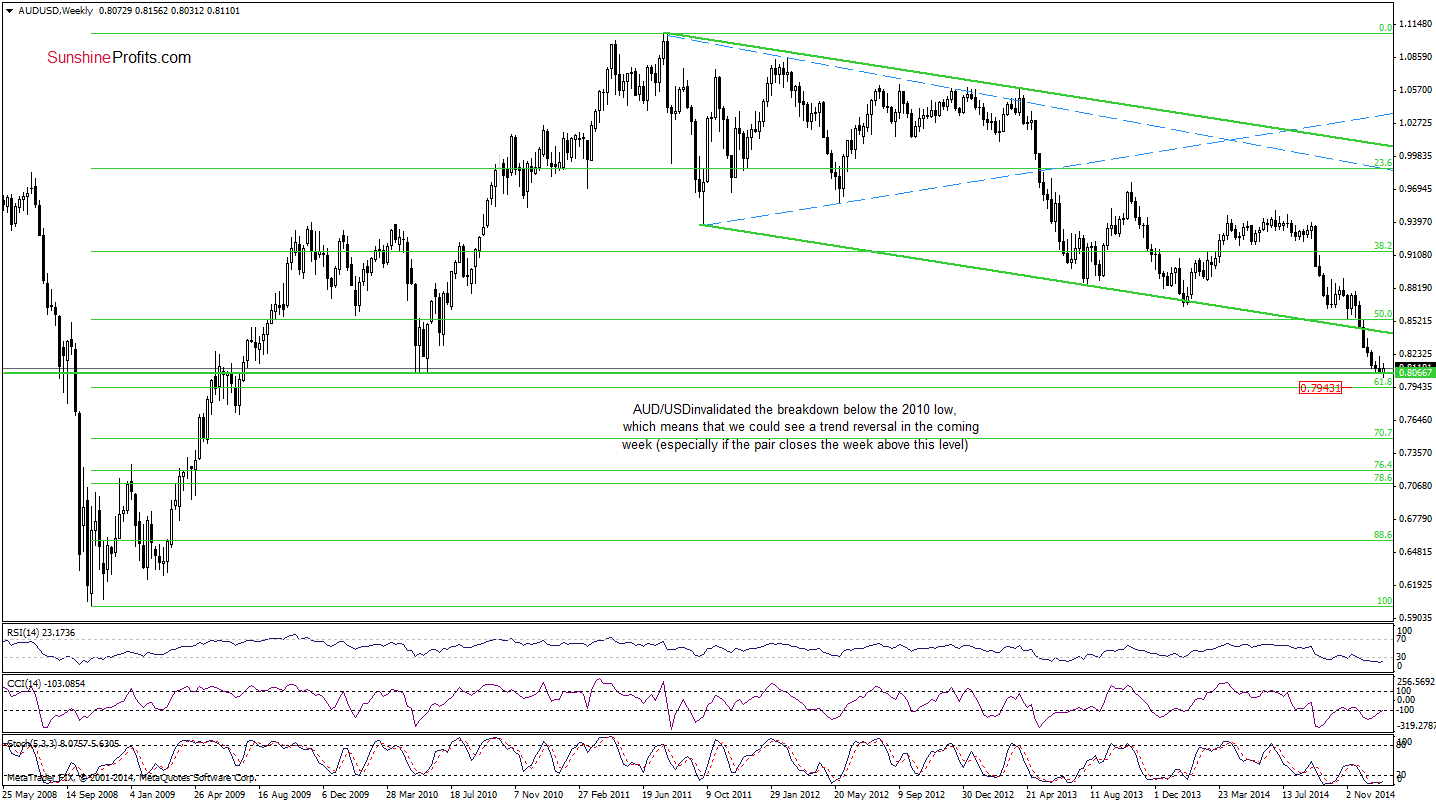
(…) Although the pair rebounded (invalidating a breakdown) and climbed above the upper line of the declining trend channel, currency bulls didn’t manage to push the exchange rate higher, which translated to an invalidation of the breakout. This bearish signal (similarly to what we saw on Dec 31) resulted in another pullback, which pushed AUD/USD under the 2010 low once again. In our opinion, this suggests further deterioration and a drop to at least the support line based on the recent lows (currently at 0.8022).
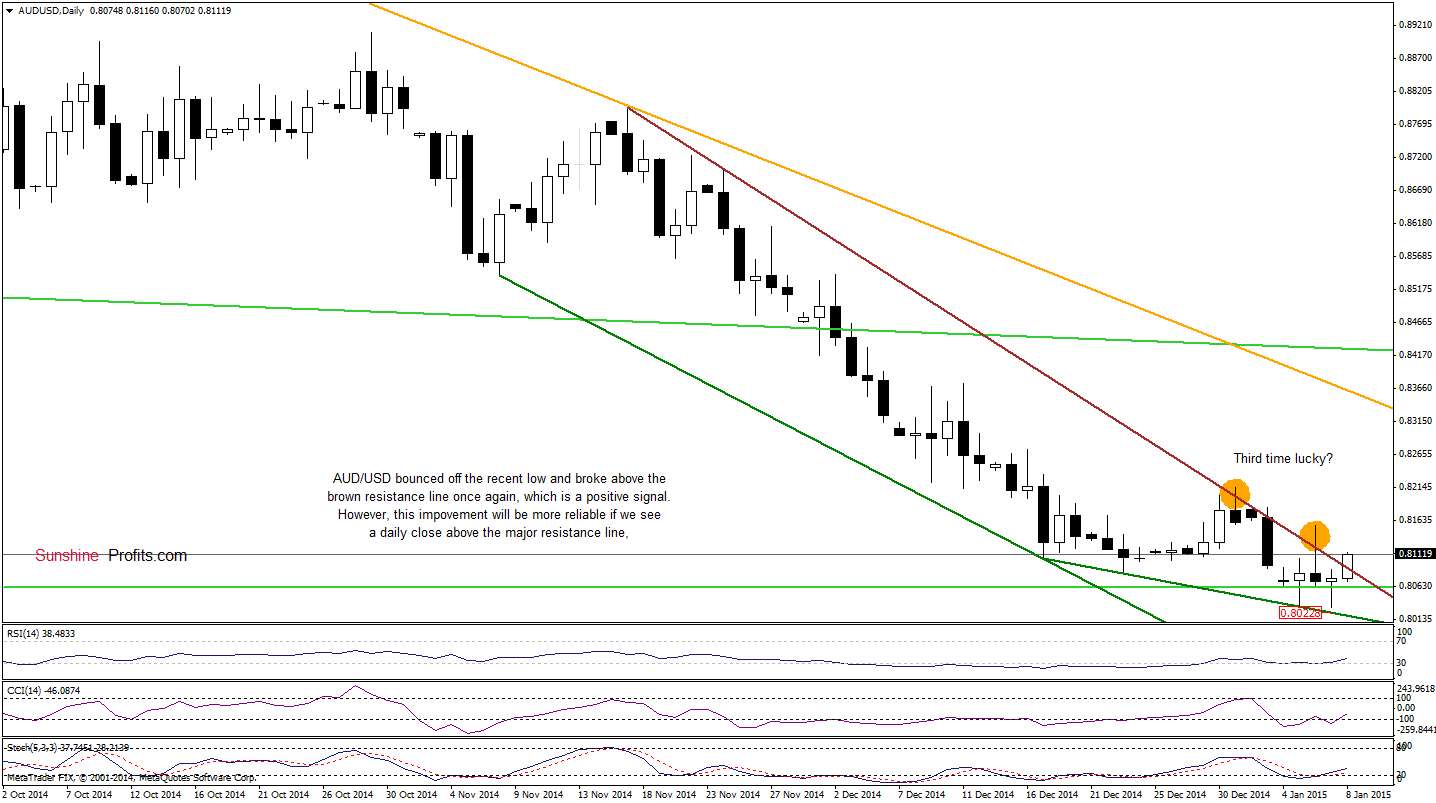
From the daily perspective, we see that although AUD/USD approached our initial downside target, the proximity to the 61.8% Fibonacci retracement encouraged currency bulls to act. As a result, the exchange rate reversed and invalidated the breakdown under the 2010 low (similarly to what we saw on Monday), which triggered further improvement and an increase above the brown resistance line (the upper line of the declining trend channel ) earlier today. Although this is a bullish signal that suggests further improvement, we should keep in mind that saw similar price action on Tuesday and also on Dec 31. Therefore, we think that this breakout will be more reliable if we see a daily close above the major resistance line. In this case, we’ll consider opening long positions.
Very short-term outlook: bullish
Short-term outlook: mixed
MT outlook: mixed
LT outlook: mixed
Trading position (short-term): In our opinion, no positions are justified from the risk/reward perspective at the moment. We will keep you informed should anything change, or should we see a confirmation/invalidation of the above.
Thank you.
Nadia Simmons
Forex & Oil Trading Strategist
Przemyslaw Radomski, CFA
Founder, Editor-in-chief
Gold & Silver Trading Alerts
Forex Trading Alerts
Oil Investment Updates
Oil Trading Alerts
