
Forex Trading Alert originally sent to subscribers on December 16, 2014, 10:29 AM.
Earlier today, the data showed that the euro zone’s preliminary manufacturing PMI climbed to a four-month high of 50.8 this month (beating expectations for a rise to 50.5), while the preliminary reading of the services PMI rose to 51.9 in December (also above the forecast of an increase to 51.5). Additionally, the ZEW Centre for Economic Research reported that its index of German economic sentiment climbed to 34.9 from 11.5 in November, well above the forecast of 20.8. These bullish numbers supported the common currency against the greenback and pushed EUR/USD above the barrier of 1.2500. Will we see further rally?
In our opinion the following forex trading positions are justified - summary:
EUR/USD
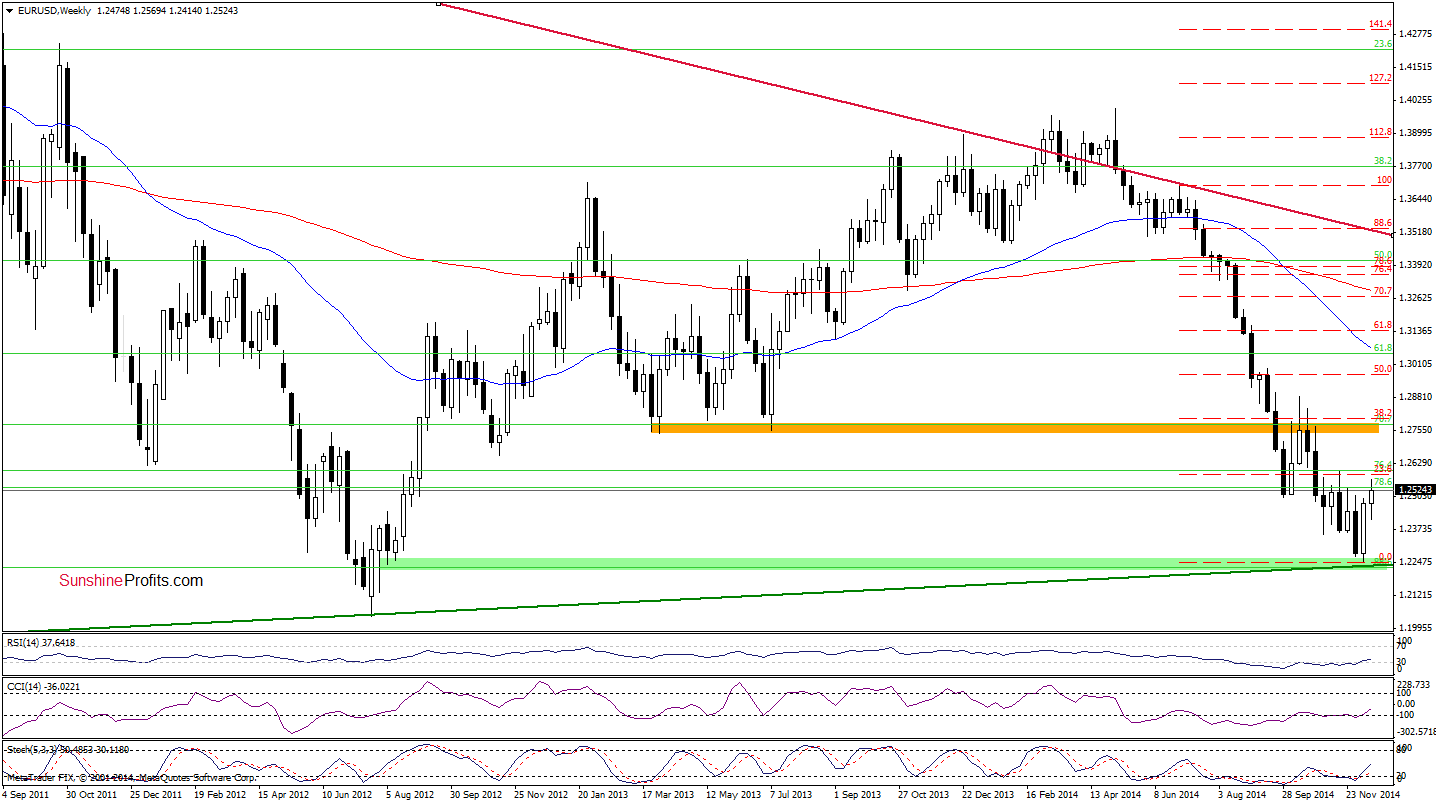
The situation in the medium term has improved slightly as EUR/USD extended gains and broke above the last week’s high. With this upswing the pair also approached the 23.6% Fibonacci retracement based on the Jun-Dec decline and the mid-Nov high of 1.2598, which could pause further rally.
Can we infer something more from the very short-term picture? Let’s check.
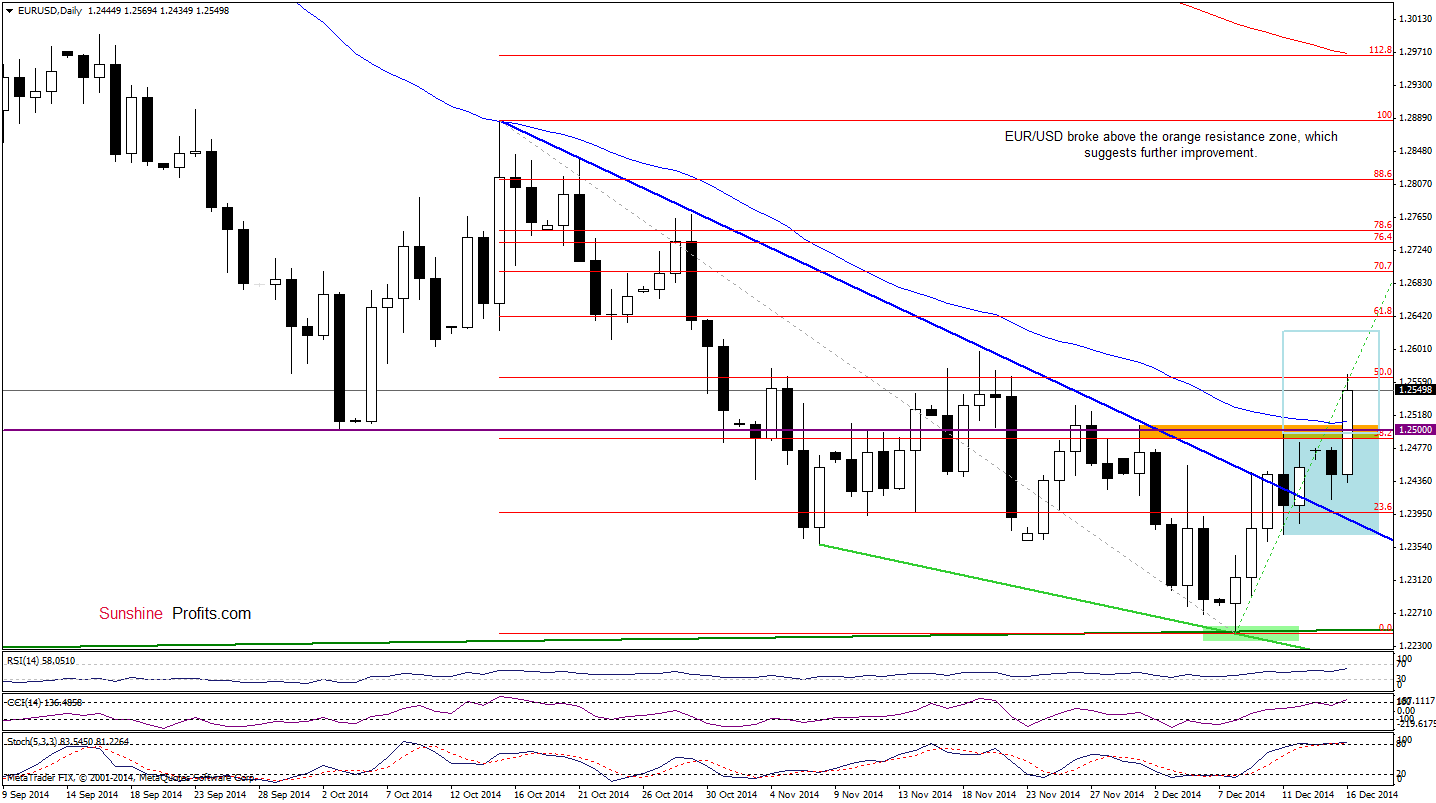
From this perspective, we see that although EUR/USD gave up some gains and approached the declining blue line, the pair reversed and rebounded sharply, breaking above the key resistance zone (created by the 38.2% Fibonacci retracement based on the Oct-Dec decline, the barrier of 1.2500, the Dec high and the 50-day moving average). With this upswing, the exchange rate also broke above the upper line of the consolidation (marked with blue), which suggests further improvement and an increase to around 1.2623, where the size of the move will correspond to the height of the formation. Despite all these bullish signals, we should keep in mind that the breakout is not confirmed and the pair reached the 50% Fibonacci retracement, which in combination with the current position of the indicators could encourage currency bears to act and test the previously-broken orange zone in the coming day.
Very short-term outlook: mixed with bearish bias
Short-term outlook: mixed
MT outlook: mixed
LT outlook: bearish
Trading position (short-term): In our opinion, no positions are justified from the risk/reward perspective at the moment. However, we’ll consider opening long positions if we see a confirmed breakout above the orange resistance area. We will keep you informed should anything change, or should we see a confirmation/invalidation of the above.
USD/CHF
Quoting our last commentary on this currency pair:
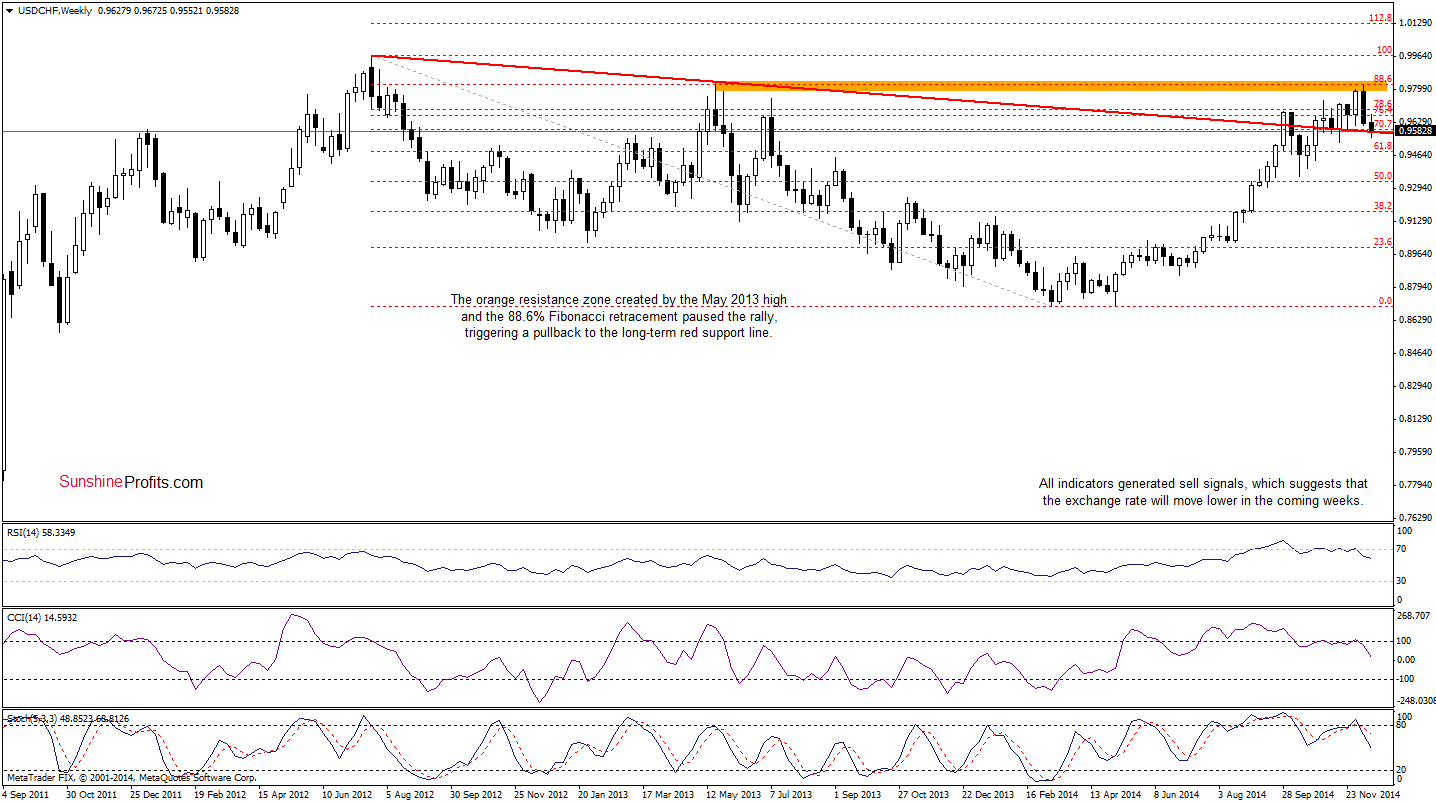
(…) the USD/CHF reversed and declined below the Nov high and the 78.6% Fibonacci retracement, which suggests a drop to the long-term red declining support line.
As you see on the above chart, the situation developed in line with the above-mentioned scenario as the exchange rate reached our initial downside target. What’s next? Let’s examine the daily chart and look for more clues.
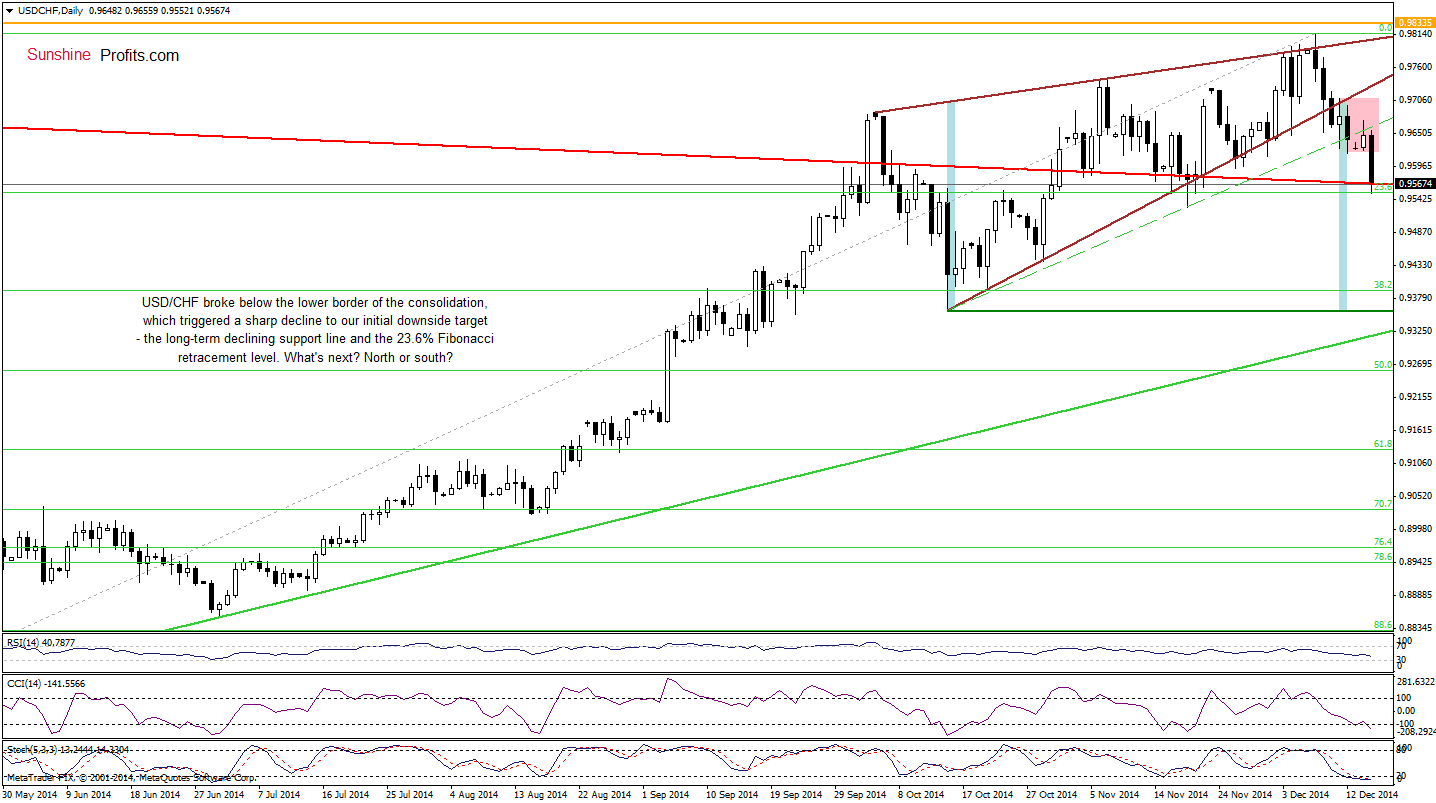
Earlier today, USD/CHF broke below the lower order of the consolidation (marked with pink) and the green dashed support line (based on the Oct 15, Oct 21, and Nov 19 lows), which triggered a sharp pullback that took the pair to the above-mentioned long-term red line. Several times in the previous month, this key support line stopped further deterioration, which translated to rebound and a fresh 2014 high. Taking this fact into account and combining it with the current position of the indicators, it seems to us that currency bulls will try to push the exchange rate higher. If this is the case, the initial upside target would be the previously-broken green dashed line and if it’s broken – the lower border of the rising wedge (marked with brown).
Very short-term outlook: mixed with bullish bias
Short-term outlook: mixed
MT outlook: mixed
LT outlook: bearish
Trading position (short-term; our opinion): No positions are justified from the risk/reward perspective at the moment. We will keep you informed should anything change, or should we see a confirmation/invalidation of the above.
AUD/USD
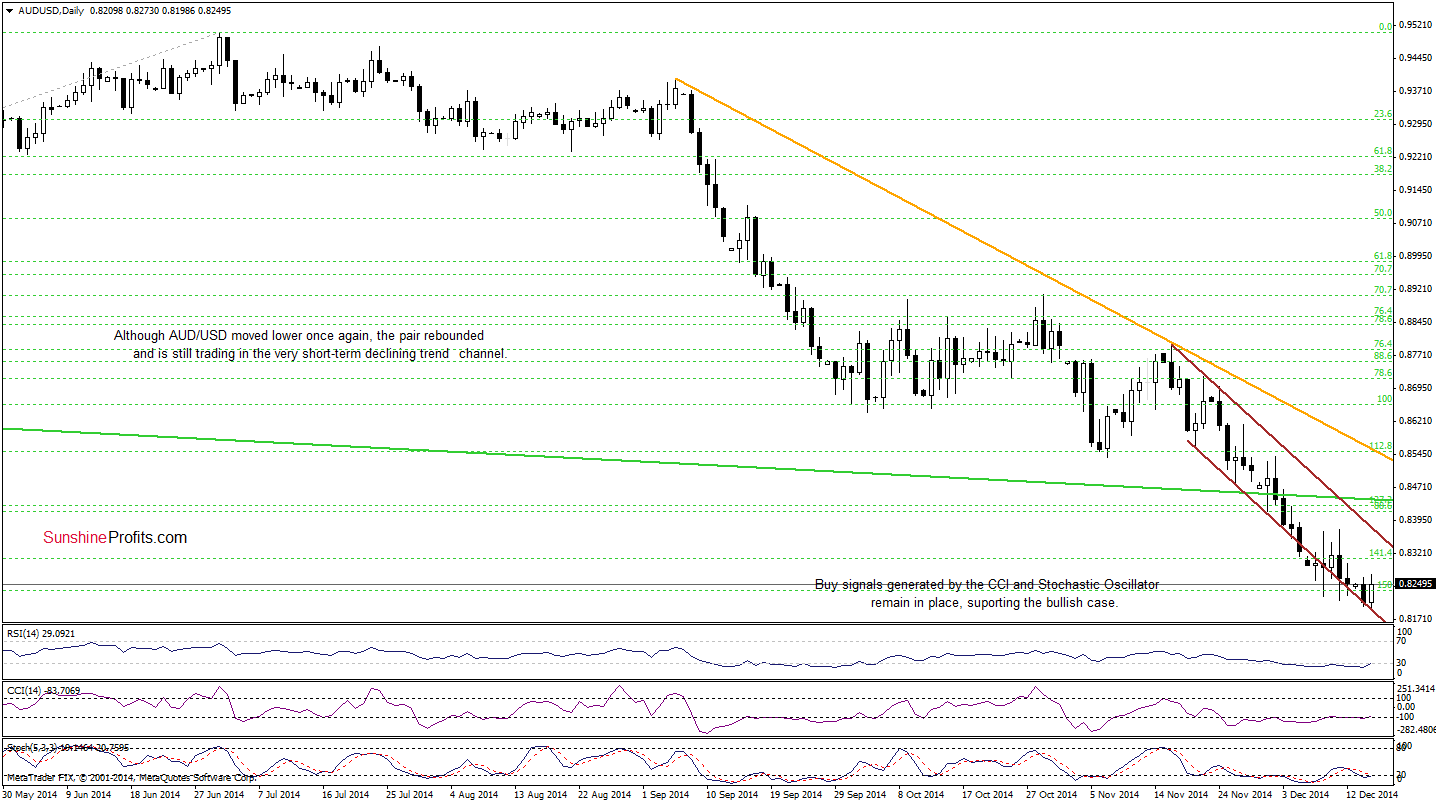
Looking at the above chart, we see that although AUD/USD extended losses and hit a fresh 2014 low, the pair rebounded and is still trading above the lower border of the declining trend channel. Additionally, buy signals generated by the indicators are still in play. Therefore, we think that as long as there is no daily close below this key very short-term support line, bigger downswing is not likely to be seen. This scenario is also reinforced by the medium-term picture. Let’s take a closer look at the weekly chart.
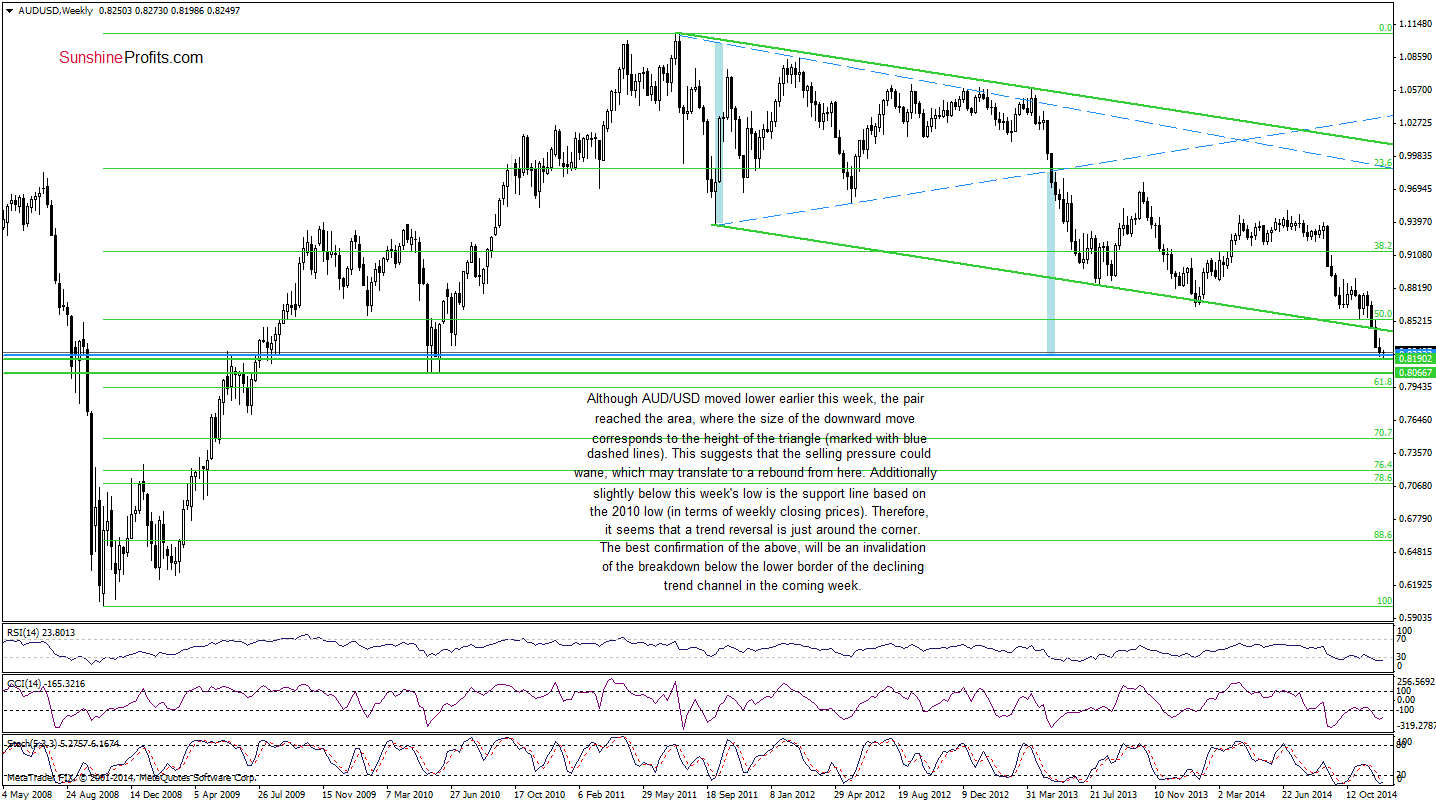
From this perspective, we see that AUD/USD remains above the blue line, which means that our commentary posted on Dec 10 is still valid:
(…) the pair reached the area, where the size of the downward move corresponds to the height of the triangle (marked with blue dashed lines). This suggests that the selling pressure could wane, which may translate to a rebound from here. Additionally, slightly below this week’s low is the support line based on the 2010 lows (in terms of weekly closing prices). Therefore, it seems to us that the space for further declines is limited and a trend reversal is just around the corner. Nevertheless, we should keep in mind that the best confirmation of the above will be an invalidation of the breakdown below the lower border of the trend channel. In our opinion, if we see such price action, a sizable upward move will be more likely and reliable. Until this time, waiting on the sidelines for the confirmation that the final bottom is in is the best choice at the moment.
Very short-term outlook: mixed with bullish bias
Short-term outlook: mixed
MT outlook: mixed
LT outlook: mixed
Trading position (short-term): In our opinion, no positions are justified from the risk/reward perspective at the moment. We will keep you informed should anything change, or should we see a confirmation/invalidation of the above.
Thank you.
Nadia Simmons
Forex & Oil Trading Strategist
Przemyslaw Radomski, CFA
Founder, Editor-in-chief
Gold & Silver Trading Alerts
Forex Trading Alerts
Oil Investment Updates
Oil Trading Alerts
