
Forex Trading Alert originally sent to subscribers on October 28, 2014, 12:23 PM.
Earlier today, the Commerce Department showed that durable goods orders fell 1.3% in the previous month, missing expectations for a 0.5% increase. Core durable goods orders (without volatile transportation items) dropped 0.2% in September, which was the largest decline in eight months. Thanks to these bearish numbers, the USD/CAD pair declined sharply, slipping below the last week’s low. Where could currency bulls find solid support?
In our opinion the following forex trading positions are justified - summary:
- EUR/USD: none
- GBP/USD: none
- USD/JPY: none
- USD/CAD: none
- USD/CHF: none
- AUD/USD: long (stop-loss order: 0.8587; initial price target: 0.8943)
EUR/USD
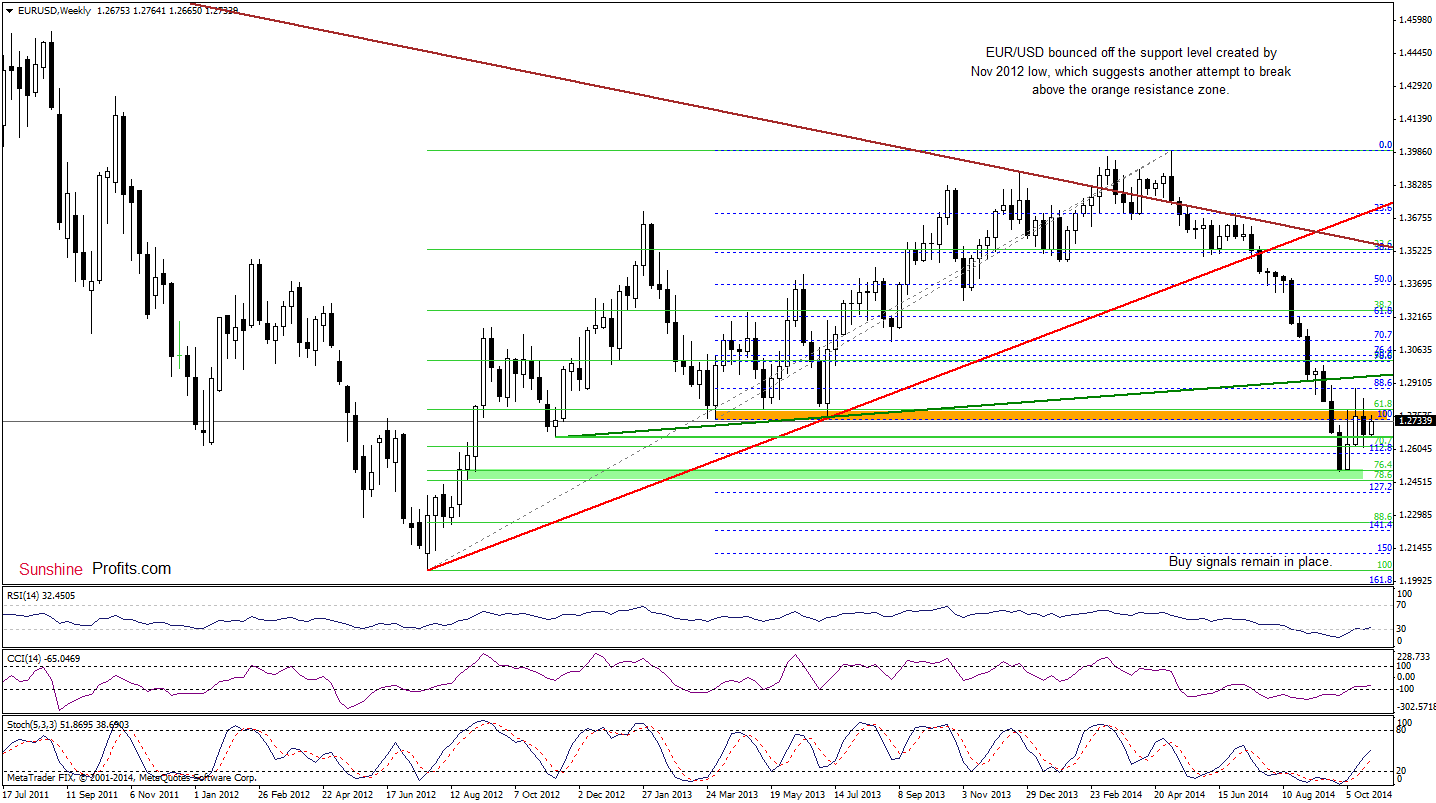
The situation in the medium term has improved slightly as EUR/USD bounced off the support level created by the Nov 2012 low. Although this is a bullish signal, we should keep in mind that the exchange rate is still trading below the orange resistance zone (created by the Apr and Jul 2013 lows and the 61.8% Fibonacci retracement), which keeps gains in check. In our opinion, as long as there is no weekly close above this area, another bigger upward move is not likely to be seen. Are there any bullish factors on the daily chart that could support further improvement? Let’s check.
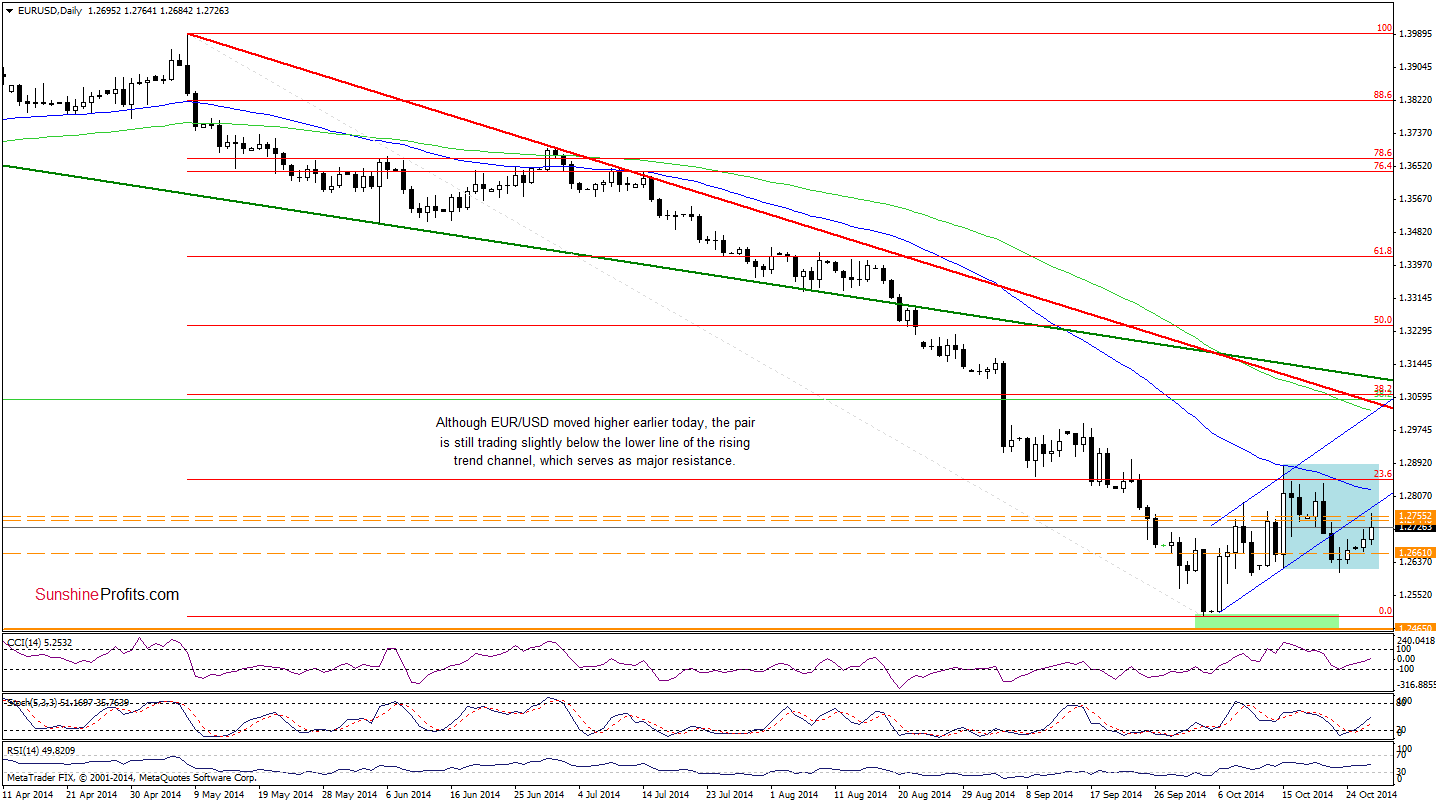
From this perspective, we see that EUR/USD extended gains and approached the lower line of the rising trend channel earlier today. Taking into account buy signals generated by the daily indicators, it seems that currency bulls will try to break above this resistance line in the nearest future. If they succeed, we’ll see further improvement and an increase to around 1.2852, where the 23.6% Fibonacci retracement is. Nevertheless, as long as there is no breakout, the recent upward move could be nothing more than a verification of the breakdown.
Very short-term outlook: mixed
Short-term outlook: mixed
MT outlook: mixed
LT outlook: bearish
Trading position (short-term): In our opinion, no positions are justified from the risk/reward perspective at the moment. We will keep you informed should anything change, or should we see a confirmation/invalidation of the above.
GBP/USD
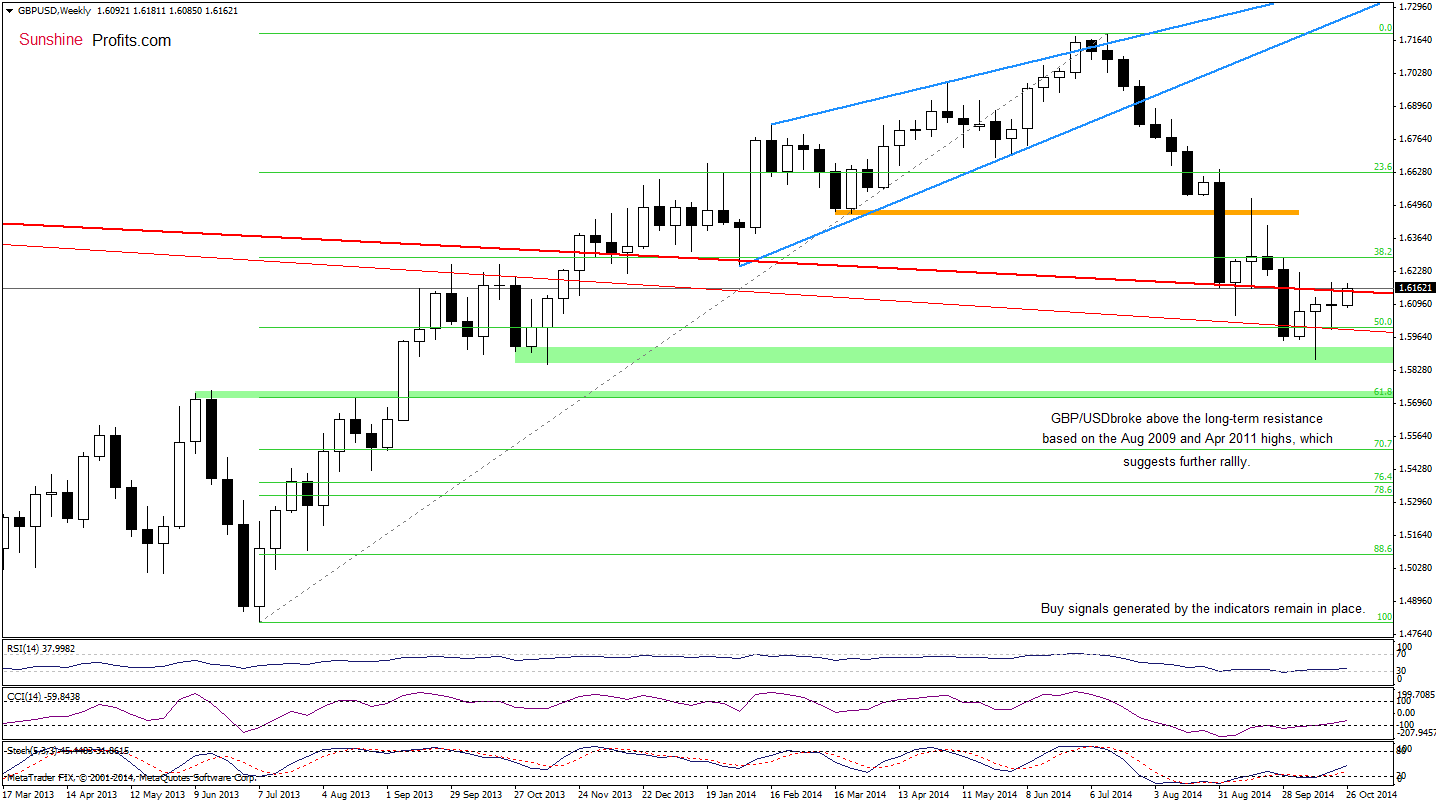
The medium-term picture has improved as GBP/USD broke above the long-term resistance line based Aug 2009 and Apr 2011 highs. This is a bullish signal that suggests further rally. How high could the exchange rate go? Let’s take a look at the daily chart and find out.
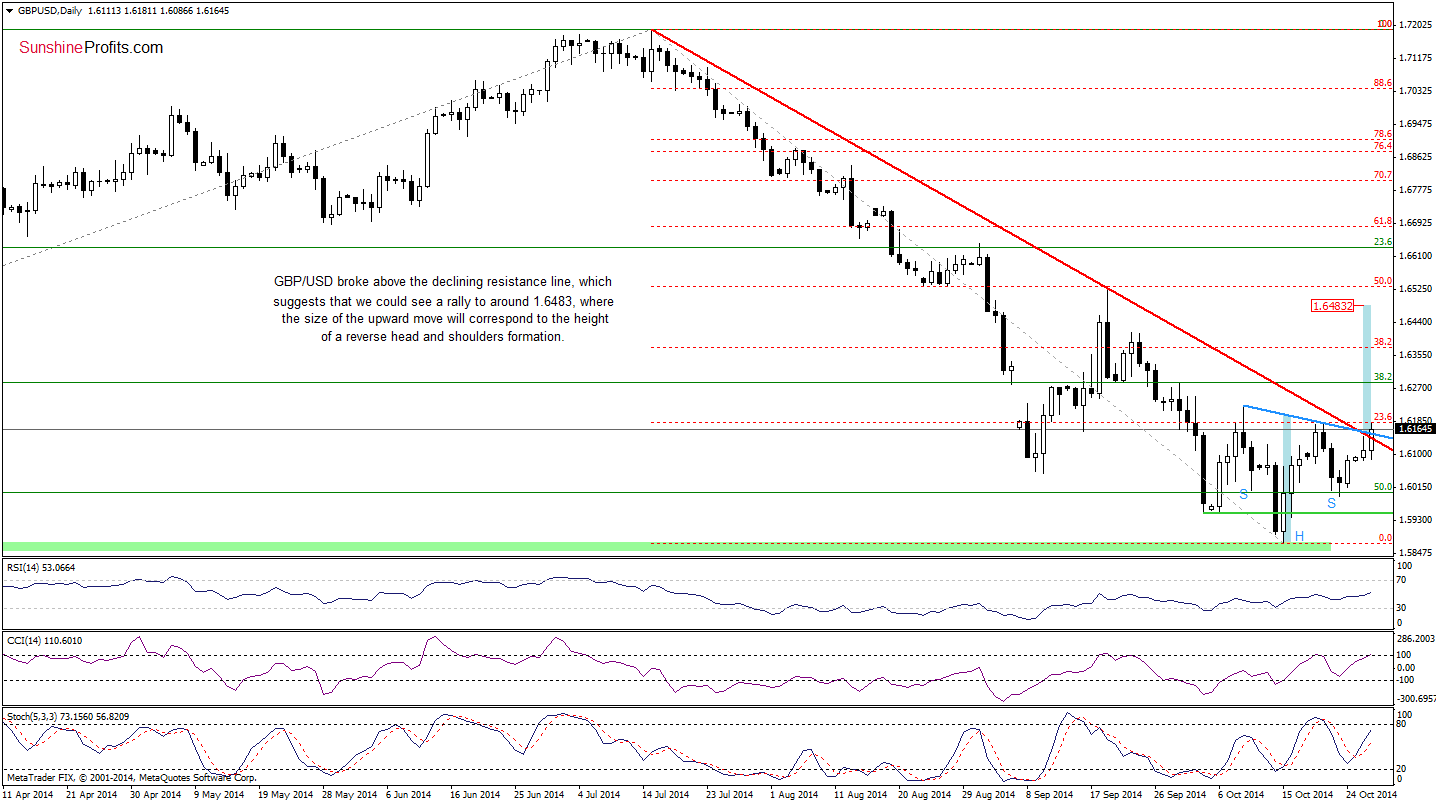
The first thing that catches the eye on the above chart is a breakout above the red and blue declining resistance lines. Therefore, what we wrote yesterday is up-to-date:
(…) if currency bulls do not give up and manage to push the exchange rate above these lines, we’ll see a rally to around 1.6483, where the size of the upward move will correspond to the height of the formation. (…) buy signals generated by the indicators remain in place, supporting the bullish case.
Very short-term outlook: bullish
Short-term outlook: mixed with bullish bias
MT outlook: mixed
LT outlook: mixed
Trading position (short-term): We do not recommend opening long position at the moment as the breakout is not confirmed. We will keep you informed should anything change, or should we see a confirmation/invalidation of the above.
USD/CAD
Quoting our last commentary on this currency pair:
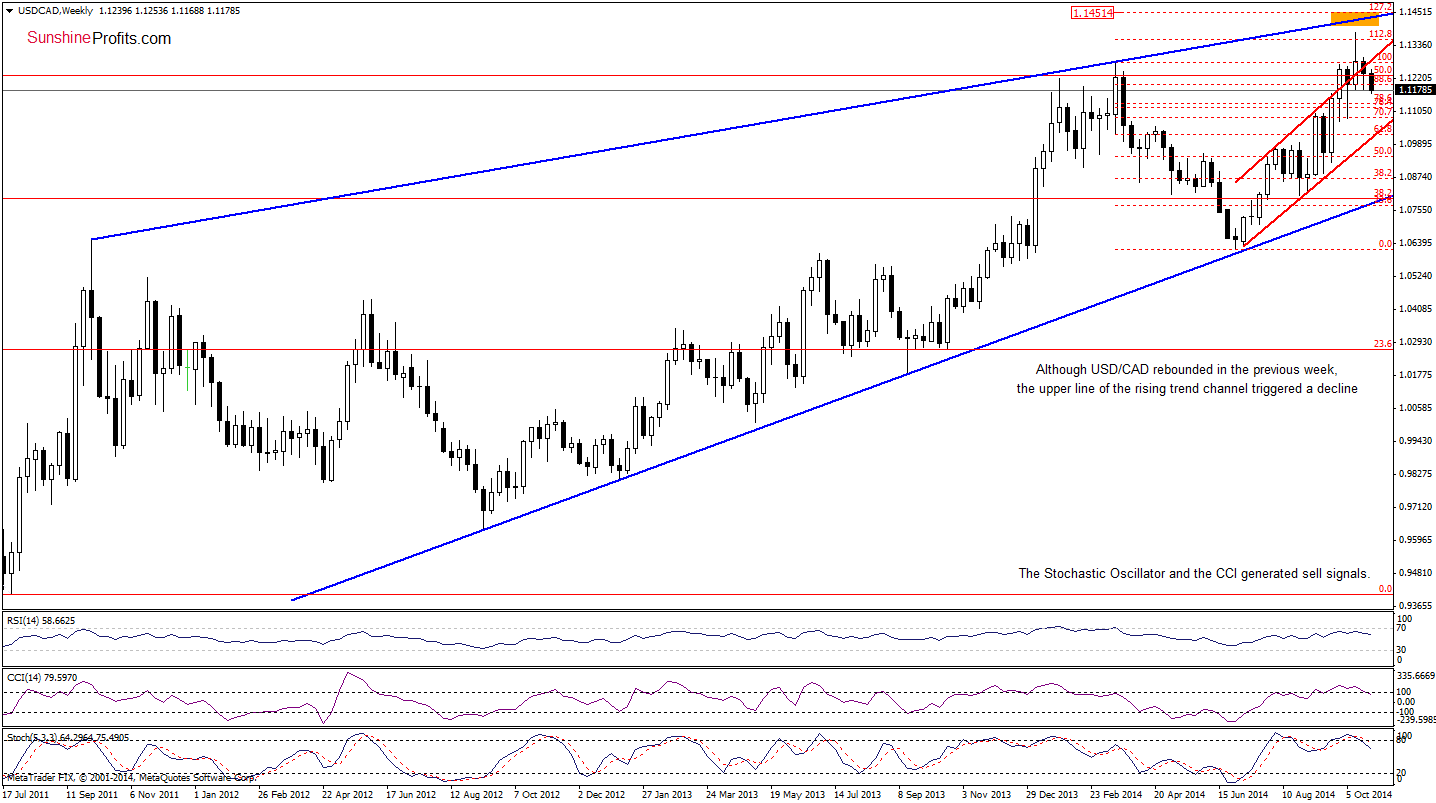
(…) although USD/CAD rebounded (…), the pair is still trading under the previously-broken upper line of the rising trend channel. In our opinion, if currency bulls do not manage to push the exchange rate above this key resistance line, the current upswing will be nothing more than a verification of the breakdown. If this is the case, it will be a bearish signal, which will trigger further deterioration. (…) taking into account the medium-term picture and sell signals generated by the daily indicators, it seems that a breakdown is just a matter of time.
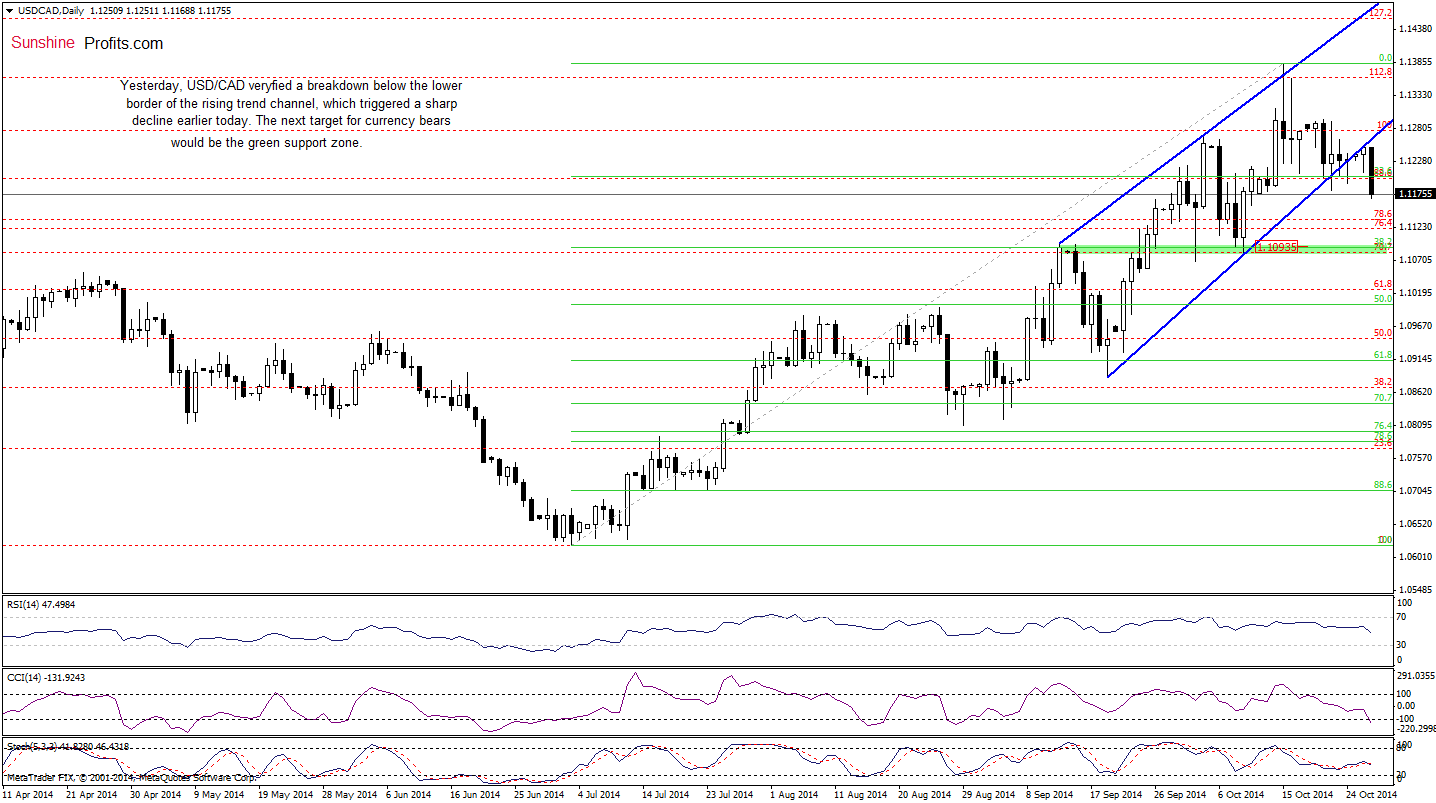
Looking at the charts, we see that the situation developed in line with the above-mentioned scenario as USD/CAD declined below the lower border of the rising trend channel. Although currency bulls tried to come back above this support/resistance line, they failed and as it turned out yesterday’s upswing was a verification of the breakdown, which triggered a sharp pullback earlier today. Taking this fact into account, and combining it with sell signals generated by the weekly indicators, we think that further deterioration is just around the corner. How low could the exchange rate go? In our opinion, the initial downside target would be around 1.1093, where the 38.2% Fibonacci retracement (based on the entire Jul-Oct rally) and the green support zone (marked on the daily chart) are.
Very short-term outlook: bearish
Short-term outlook: mixed with bearish bias
MT outlook: mixed with bearish bias
LT outlook: bearish
Trading position (short-term; our opinion): No positions are justified from the risk/reward perspective at the moment. We will keep you informed should anything change, or should we see a confirmation/invalidation of the above.
Thank you.
Nadia Simmons
Forex & Oil Trading Strategist
Przemyslaw Radomski, CFA
Founder, Editor-in-chief
Gold & Silver Trading Alerts
Forex Trading Alerts
Oil Investment Updates
Oil Trading Alerts
