
Forex Trading Alert originally sent to subscribers on September 16, 2014, 2:18 PM.
In the minutes of the last policy meeting, the Reserve Bank of Australia sustained its decision to keep interest rates on hold for an extended period of time. As a result, the Australian dollar declined against its U.S. counterpart and reached its lowest level since mid-March. Despite this drop, AUD/USD rebounded later in the day and erased over 20% of the recent declines. Is it time for a rebound?
In our opinion the following forex trading positions are justified - summary:
- EUR/USD: long (stop-loss order: 1.2846; initial price target: 1.3200)
- GBP/USD: none
- USD/JPY: none
- USD/CAD: none
- USD/CHF: none
- AUD/USD: none
EUR/USD
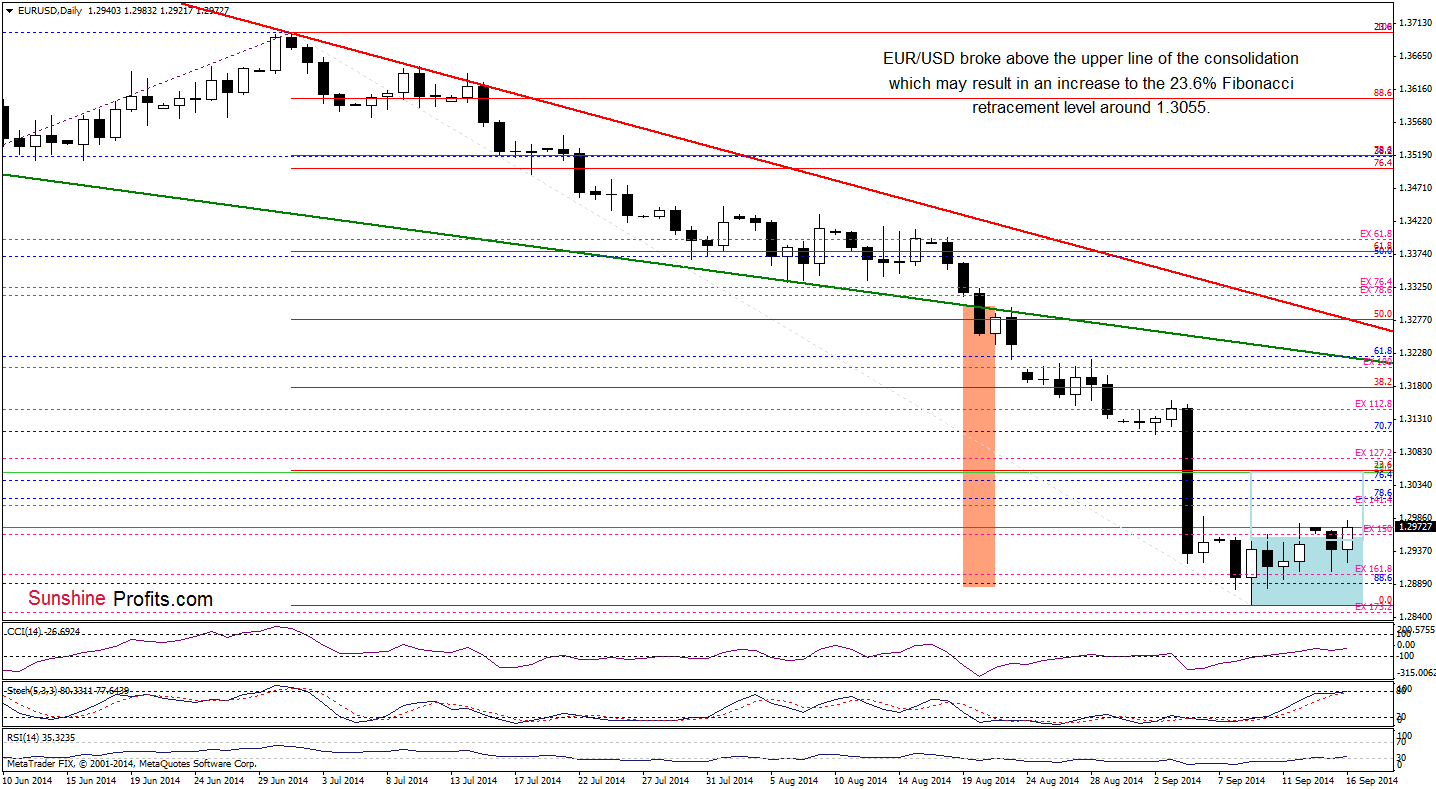
The medium-term picture hasn’t changed much and EUR/USD still remains above the support zone created by the 88.6% Fibonacci retracement and the long-term green support line based on the Nov 2012 and Jul 2013 lows. Today we’ll take a closer look at the daily chart.
Yesterday, we wrote the following:
(…) although EUR/USD invalidated a breakout above the upper line of the consolidation, the pair is still trading in a narrow range, near last week’s highs. Taking this fact into account, and combining it with buy signals generated by the indicators and the strong medium-term support zone, we think that currency bulls will try to push the pair higher once again. If this is the case, the initial upside target will be around 1.3055, where the size of the upswing would correspond to the height of the formation and the 23.6% Fibonacci retracement (based on the Jul-Sep decline) is.
From this perspective, we see that currency bulls managed to push the pair above the upper line of the consolidation once again. This is a positive signal, which suggests that we will likely see further improvement and an increase to our upside target (around 1.3055) in the coming days.
Very short-term outlook: bullish
Short-term outlook: mixed with bullish bias
MT outlook: mixed
LT outlook: bearish
Trading position (short-term; our opinion): Long with a stop-loss order at 1.2846. We will keep you informed should anything change, or should we see a confirmation/invalidation of the above.
GBP/USD
On Wednesday, we wrote the following:
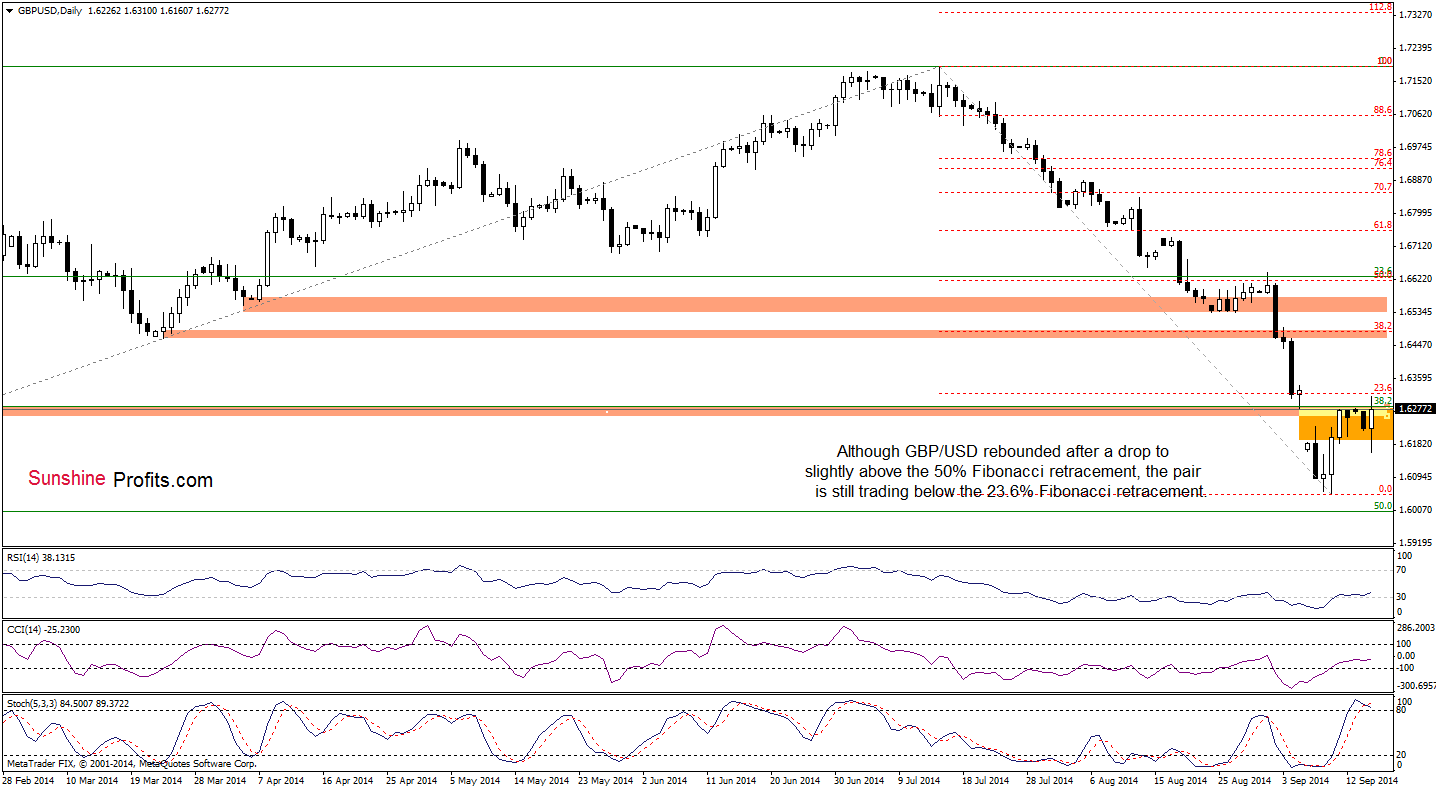
(…) If the proximity to the 50% Fibonacci retracement encourages forex traders to push the buy button, GBP/USD will rebound and try to close the orange gap.
Looking at the above charts, we see that the situation developed in line with the above-mentioned scenario and the exchange rate rallied to out upside target. Despite this increase, the orange gap in combination with the February lows and the 23.6% Fibonacci retracement (based on the entire Jul-Sep decline) still holds, creating a strong resistance area. At this point, it’s worth noting that earlier today, we saw another attempt to go higher, but currency bulls failed and the pair reversed, invalidating a small breakout above the upper border of the gap. Taking this negative signal into account, it seems to us that as long as there is no successful breakout above this strong resistance, another move lower (or even a test of the strength of the recent lows) should not surprise us.
Very short-term outlook: bearish
Short-term outlook: mixed with bearish bias
MT outlook: bearish
LT outlook: mixed
Trading position (short-term): In our opinion, no positions are justified from the risk/reward perspective. We will keep you informed should anything change, or should we see a confirmation/invalidation of the above.
AUD/USD
Quoting our last commentary on this currency pair:
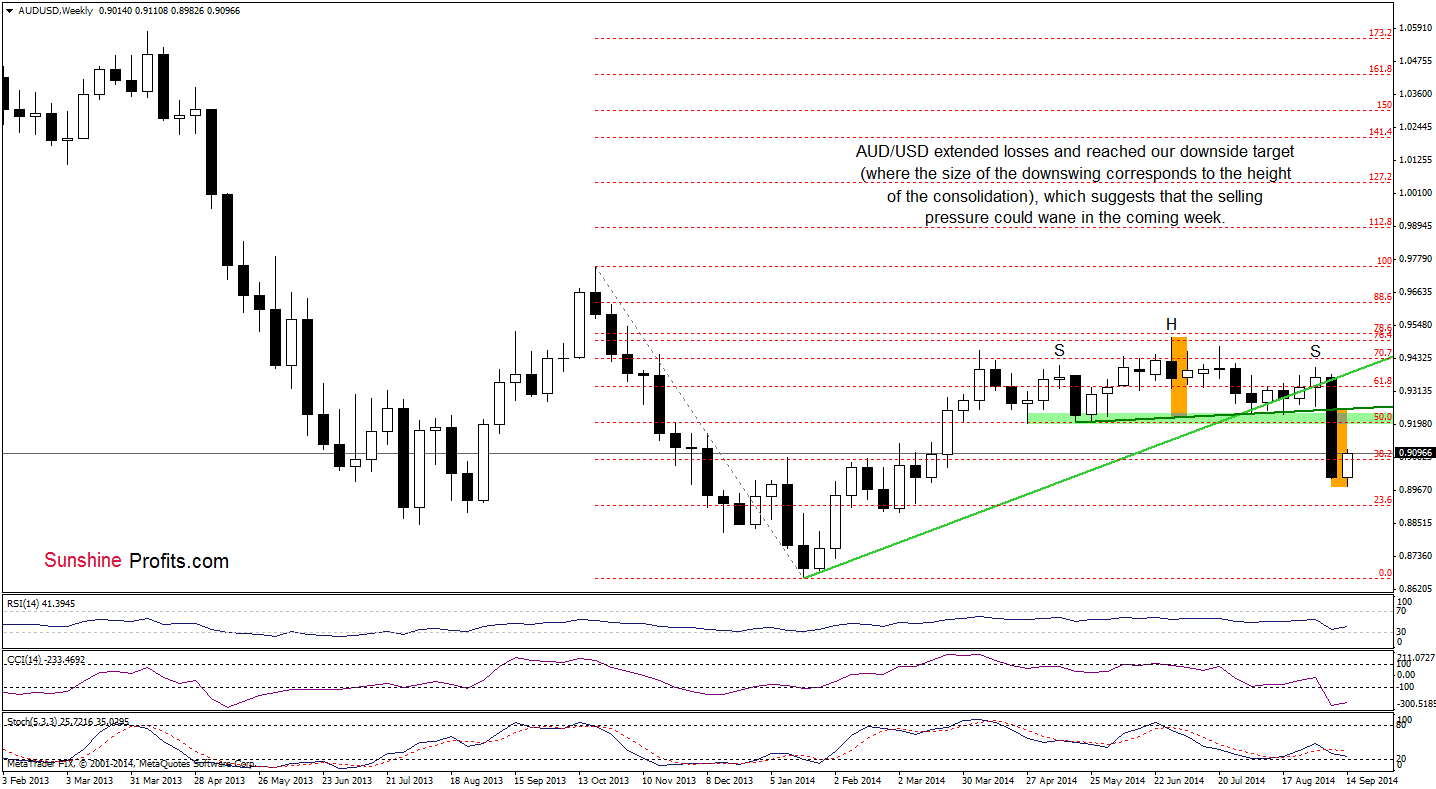
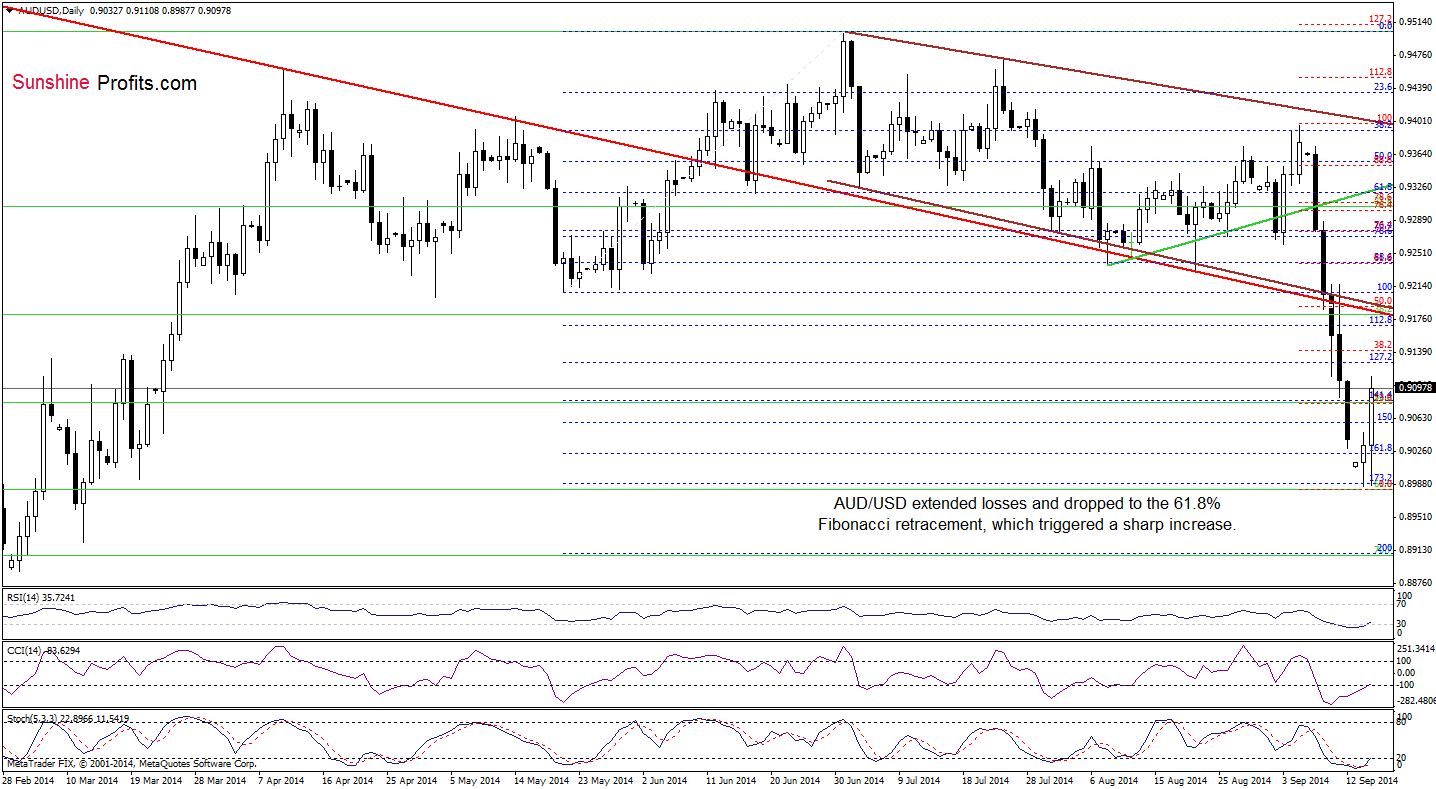
(…) the head and shoulders top formation is underway. Therefore, it seems to us that the exchange rate will extend losses and drop (…) where the size of the downward move will correspond to the height of the formation.
Looking at the weekly chart, we clearly see that currency bears realized the above-mentioned scenario and the pair reached our downside target. As you see on the daily chart, with this downward move, the exchange rate reached the 61.8% Fibonacci retracement (based on the entire Jan-Jul rally) and the 173.2% Fibonacci extension. This solid support zone in combination with reduced selling pressure triggered a sharp rally, which took the pair above the 23.6% Fibonacci retracement based on the September decline. Additionally, all indicators generated buy signals, which provides us with bullish implications and suggests further improvement. If this is the case, the initial upside target wil be around 0.9141, where the next Fibonacci retracement is.
Very short-term outlook: bullish
Short-term outlook: mixed
MT outlook: mixed
LT outlook: bearish
Trading position (short-term): In our opinion no positions are justified from the risk/reward perspective. We will keep you informed should anything change, or should we see a confirmation/invalidation of the above.
Thank you.
Nadia Simmons
Forex & Oil Trading Strategist
Przemyslaw Radomski, CFA
Founder, Editor-in-chief
Gold & Silver Trading Alerts
Forex Trading Alerts
Oil Investment Updates
Oil Trading Alerts
