
Forex Trading Alert originally sent to subscribers on September 2, 2014, 12:37 PM.
Earlier today, the Institute for Supply Management reported that its manufacturing purchasing managers’ index increased to 59.0 in August, beating expectations of a drop to 56.8. As a result, U.S dollar climbed to an eight-month high against the yen. Will USD/JPY test the strength of Nov high?
In our opinion the following forex trading positions are justified - summary:
EUR/USD
Quoting our Forex Trading Alert posted on Aug 25:
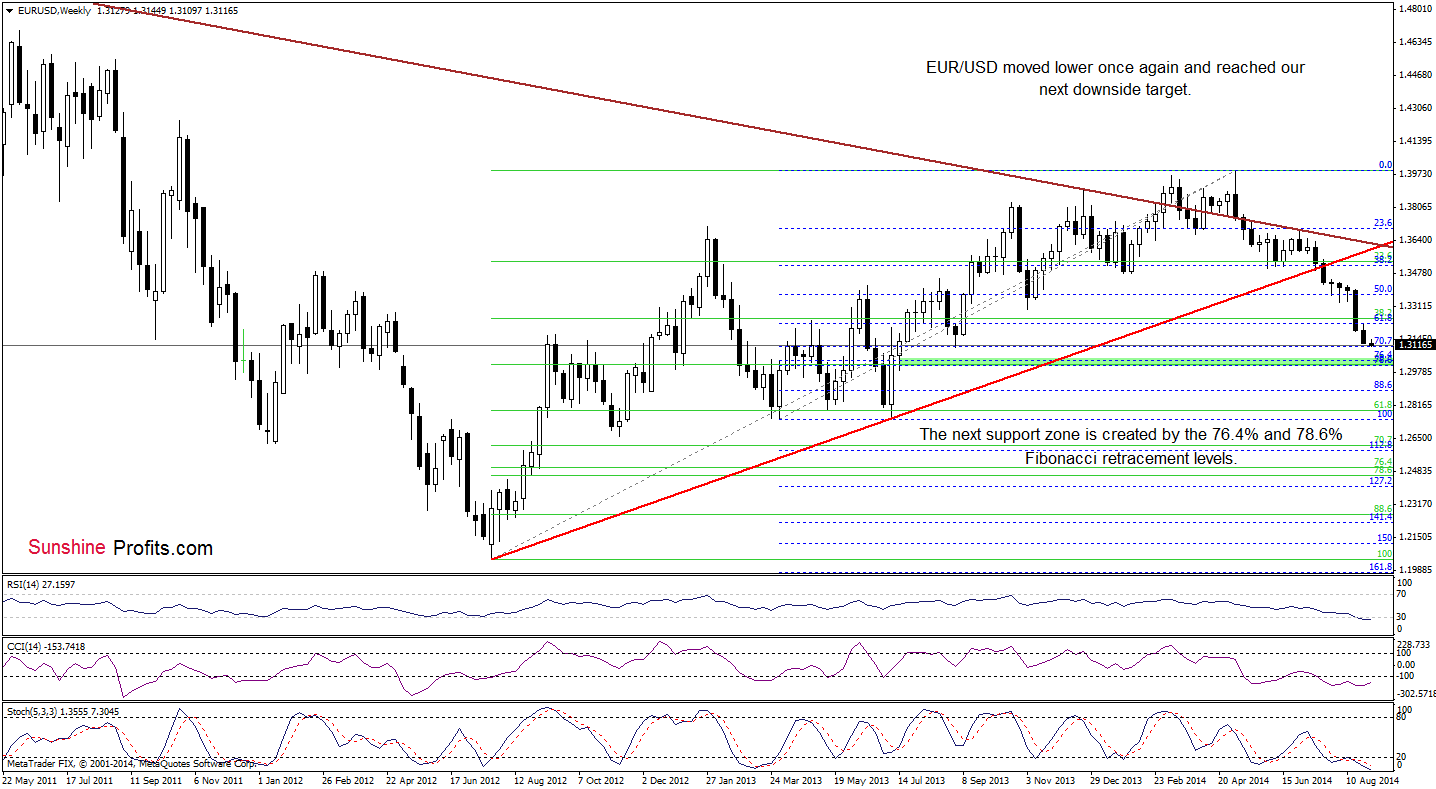
(…) This is a strong bearish signal, which suggests further deterioration and a drop to around 1.3104-1.3109, were the 70.7% Fibonacci retracement meets the September low. (…) although the RSI declined to its lowest level since July 2012 (while the CCI and Stochastic Oscillator are oversold) suggesting a pause or corrective upswing, we should keep in mind that as long as there is no invalidation of the breakdown below the green area, another attempt to move lower can’t be ruled out.
From this perspective, we see that currency bears realized the above-mentioned scenario as we expected and EUR/USD dropped to the next support zone. As you know from our previous Forex Trading Alerts, this is the point where we usually consider two scenarios. On one hand, if this area withstand the selling pressure, we’ll see a rebound from here and an increase to at least Nov low of 1.3295. On the other hand, if the exchange rate drops lower, the next downside target will be a strong support zone created by the 76.4% and 78.6% Fibonacci retracement levels. Which scenario is more likely? Let’s examine the daily chart and look for some clues.
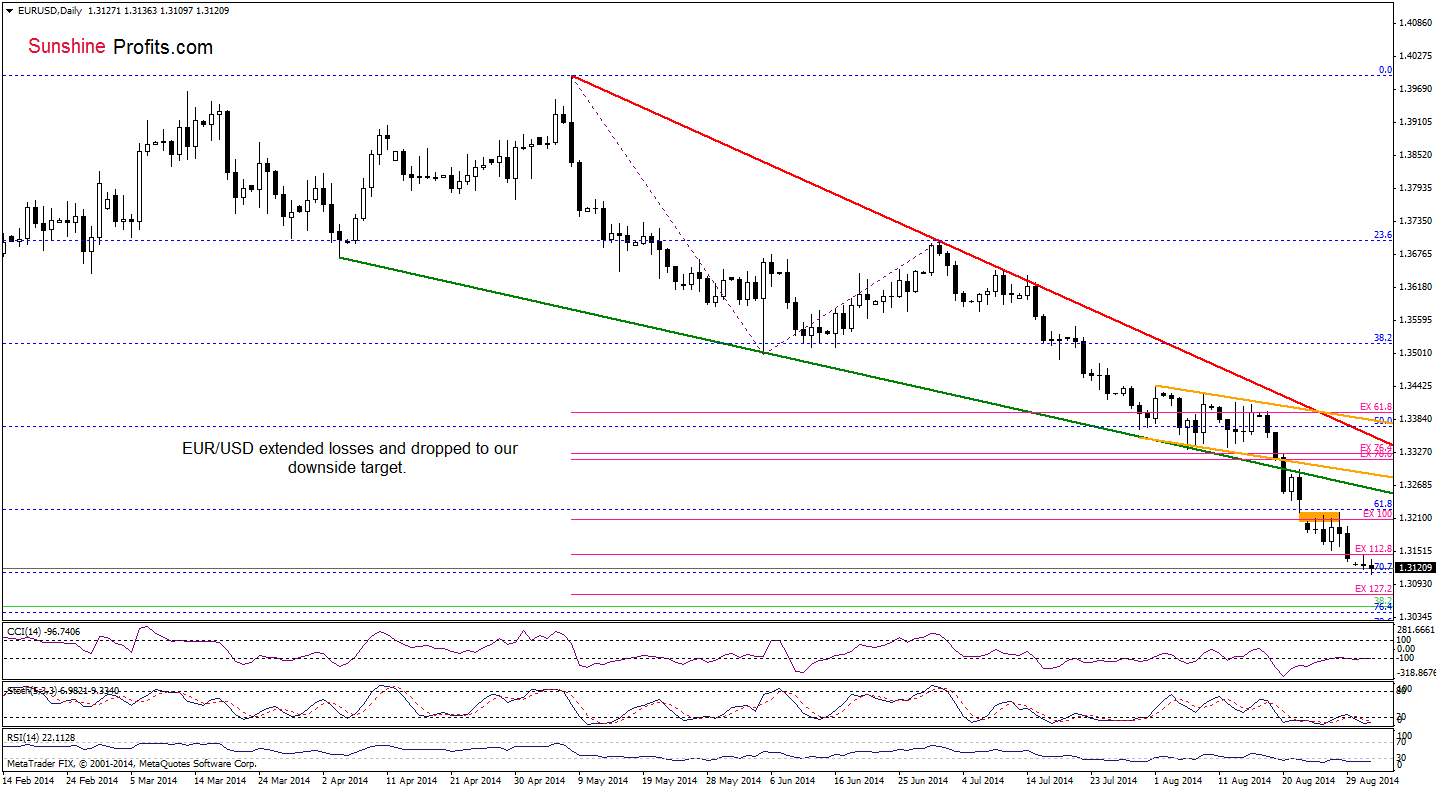
The first thing that catches the eye on the above chart is a strong positive divergence between the CCI and the exchange rate (we can also see them between two other indicators and EUR/USD). Although this is a bullish signal, which suggests a corrective upswing in the near future, we think that as long as there are no buy signal, another attempt to move lower is more likely than not. Additionally, based on our experience, we noticed that the 127.2% Fibonacci price projection and the support zone created by the 76.4% and 78.6% Fibonacci retracement levels are much stronger than the current Fibonacci retracement and more often stopped the decline in the past. Therefore, if currency bulls do not manage to push the pair above the orange gap, we believe that the next downside target will be at 1.3075 or even around 1.3016-1.3047, where the above-mentioned levels are.
Please note that we will have a decision or at least more information regarding the European QE on Thursday - perhaps this will be the day when currencies reverse their direction for some time. We will keep our eyes open and report to you accordingly.
Very short-term outlook: mixed with bearish bias
Short-term outlook: mixed
MT outlook: mixed
LT outlook: bearish
Trading position (short-term): In our opinion no positions are justified from the risk/reward perspective. We will keep you informed should anything change, or should we see a confirmation/invalidation of the above.
GBP/USD
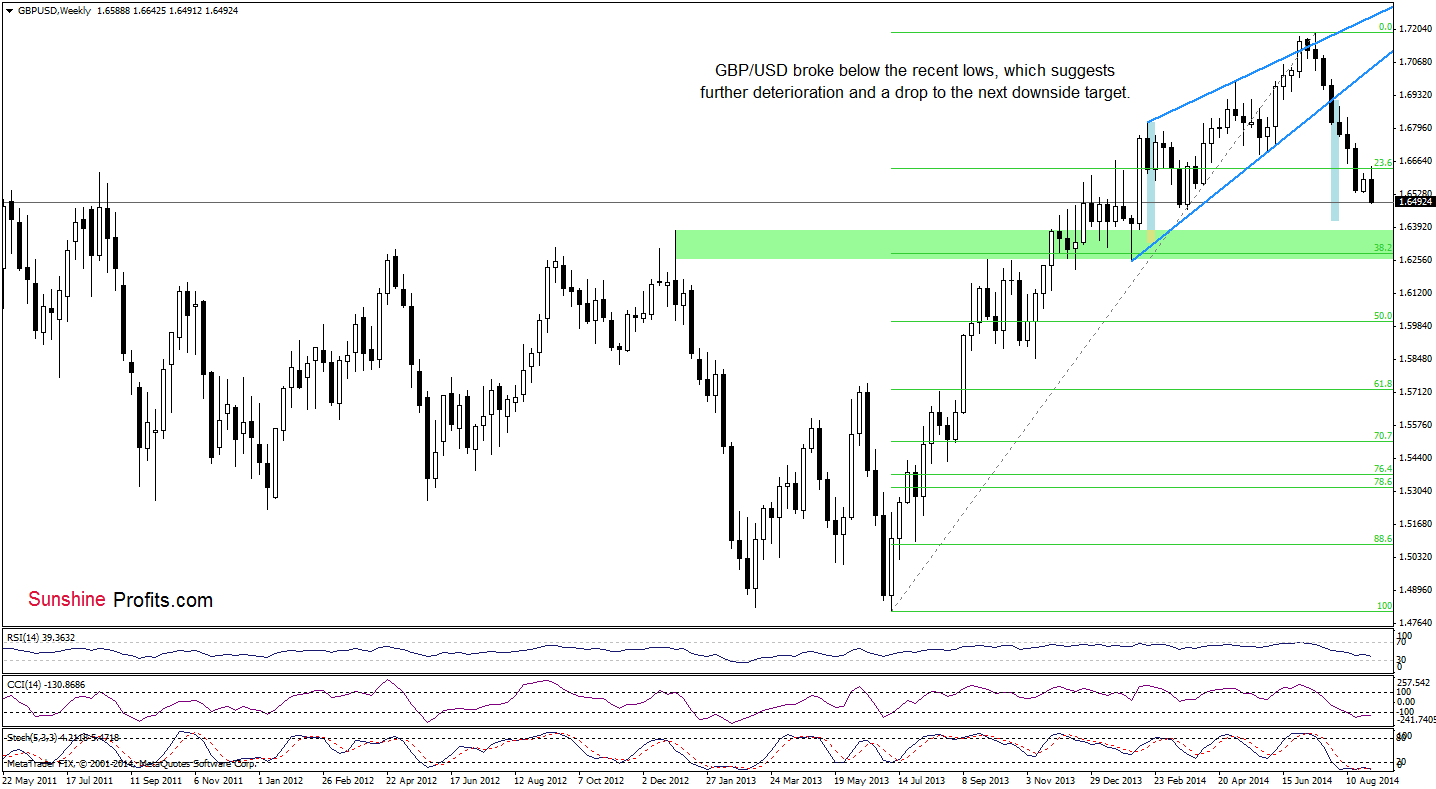
The medium-term picture deteriorated as GBP/USD declined below the recent lows. Taking into account the fact that there are no buy signals, which could bode well and precede a pause or an upswing, we think that currency bears will try to reach to around 1.6419, where the size of the downswing will correspond to the height of the rising wedge (marked with blue).
Are there any short-term supports that could hinder the realization of the above-mentioned scenario? Let’s check.
Quoting our last commentary on this currency pair:
(…) GBP/USD is still trading slightly above the green support zone created by the April low and the 127.2% Fibonacci extension (based on the May-July rally) (…) if the exchange rate moves lower, the next target for currency bears will be around the March low, which is reinforced by the 141.4% Fibonacci extension.
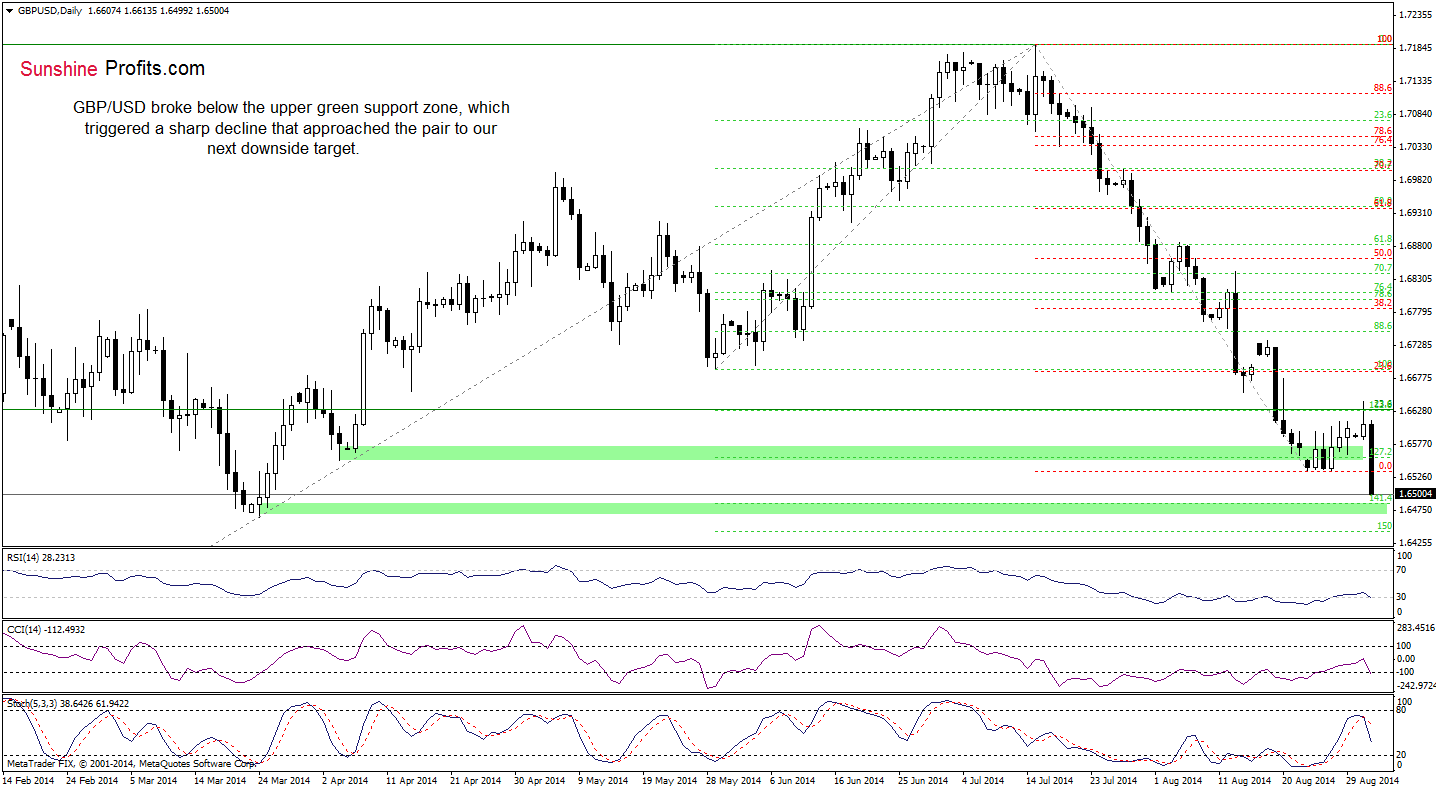
As you see on the daily chart the situation in the very short-term situation has deteriorated as GBP/USD broke below the upper green zone and approached our next downside target. If this area holds, we’ll see a rebound from here and an increase to (at least) the recent highs. Nevertheless, taking into account the current position of the indicators (the Stochastic Oscillator generated a sell signal, while the RSI and CCI reversed), it seems to us that currency bears will realize their medium-term scenario in the coming days.
Very short-term outlook: mixed with bearish bias
Short-term outlook: mixed
MT outlook: bearish
LT outlook: mixed
Trading position (short-term): In our opinion, no positions are justified from the risk/reward perspective. We will keep you informed should anything change, or should we see a confirmation/invalidation of the above.
USD/JPY
On Friday, we wrote the following:
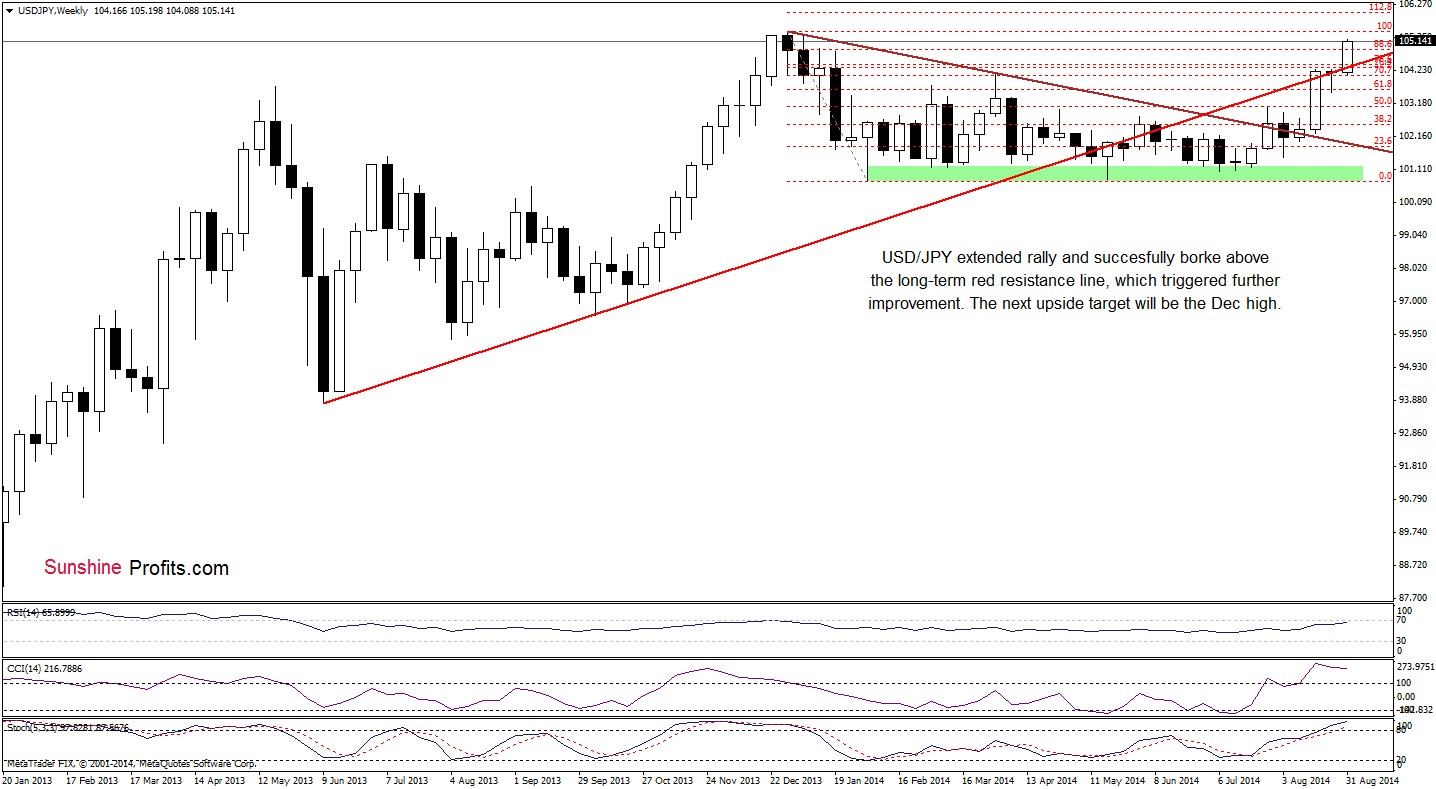
(…) the exchange rate still remains slightly below the previously-broken resistance zone created by the long-term red resistance line and the 70.7% Fibonacci retracement. If the pair moves higher and invalidates the breakdown, it will be a strong bullish signal that will trigger an increase to around 104.88, where the 88.6% Fibonacci retracement is.
Looking at the weekly chart, we clearly see that the situation not only developed in line with the above-mentioned scenario, but currency bulls managed to push the pair higher. If they do not give up, we may see further improvement and the next upside target will be the Dec high of 105.42. Nevertheless, we should keep an eye on the indicators because they suggest that correction is just around the corner.
Will the daily chart give us more clues about future moves? Let’s check.
In our Forex Trading Alert posted on Aug 20, we wrote the following:
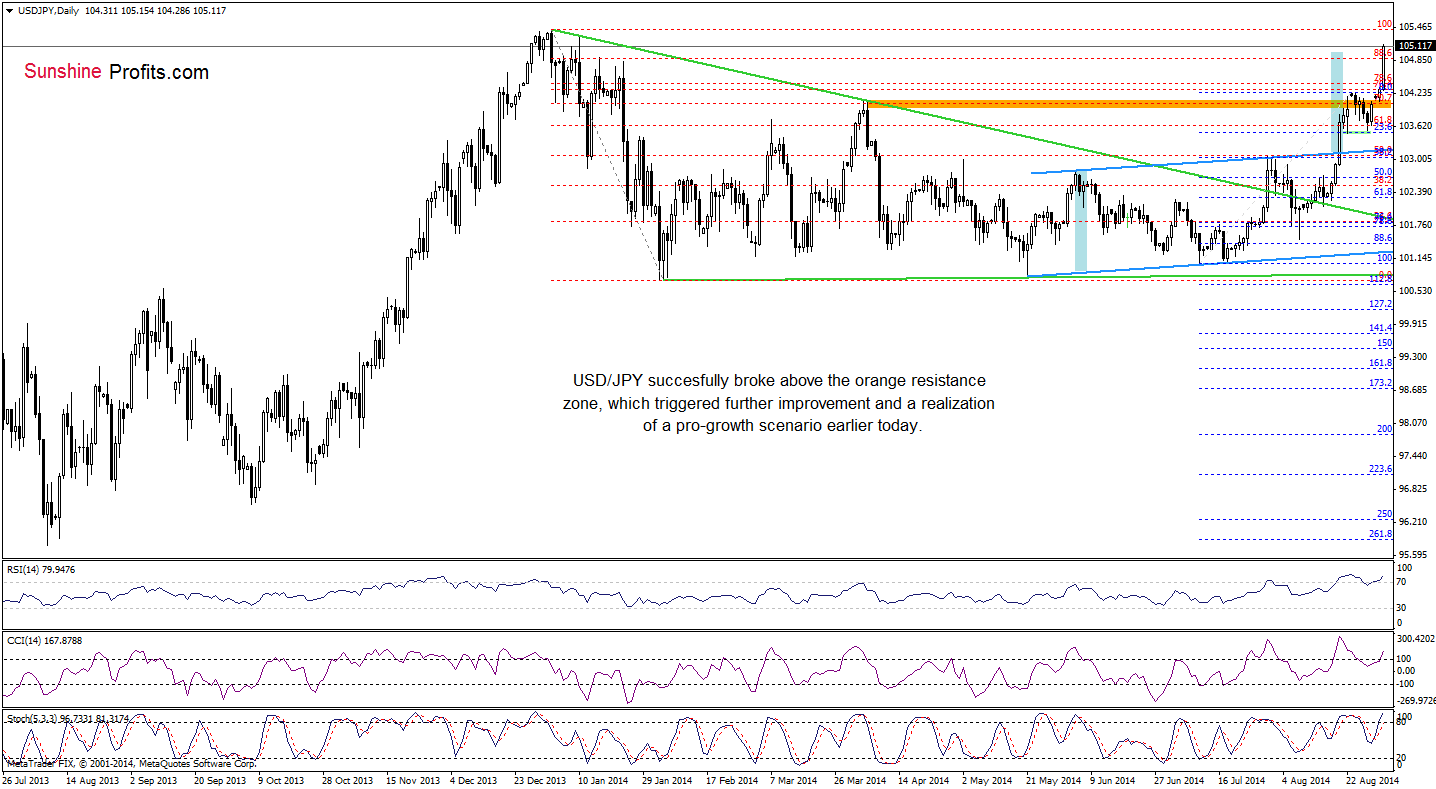
The first thing that catches the eye on the above chart is a breakout above the upper line of the rising trend cannel. This is a strong bullish signal, which will (if it is not invalidated) trigger further improvement in the coming day (or even days). How high could USD/JPY go? As you see on the above chart, if currency bulls do not give up and break above the April high (which is reinforced by the 70.7% Fibonacci retracement), we may see an increase even to around 104.81, where the size of the upswing will correspond to the height of the trend channel.
Looking at the above chart, we see that the situation developed in line with the above-mentioned scenario and USD/JPY reached our upside target. Taking into account the current position of the indicators (although they are overbought and there is a negative divergence between the CCI and the exchange rate), it seems to us that currency bulls will test the strength of the Dec high of 105.42 before we’ll see a correction and a drop to the bottom of the recent pullback at 103.54.
Very short-term outlook: bullish
Short-term outlook: mixed with bearish bias
MT outlook: mixed
LT outlook: bearish
Trading position (short-term): In our opinion no positions are justified from the risk/reward perspective at the moment. We will keep you informed should anything change, or should we see a confirmation/invalidation of the above.
Thank you.
Nadia Simmons
Forex & Oil Trading Strategist
Przemyslaw Radomski, CFA
Founder, Editor-in-chief
Gold & Silver Trading Alerts
Forex Trading Alerts
Oil Investment Updates
Oil Trading Alerts
