
Forex Trading Alert originally sent to subscribers on August 12, 2014, 1:27 PM.
In today’s alert we will take a different view on the currency sector. We will focus on the index that impacts every pair we regularly cover – the USD Index. The long-, medium- and short-term pictures paint an interesting picture that will impact the individual currency rates for days, weeks, and months. It’s definitely worth keeping these charts in mind when making any forex trade.
In our opinion, the following forex trading positions are justified - summary:
Let’s start with the long-term chart (chart courtesy of http://stockcharts.com.)
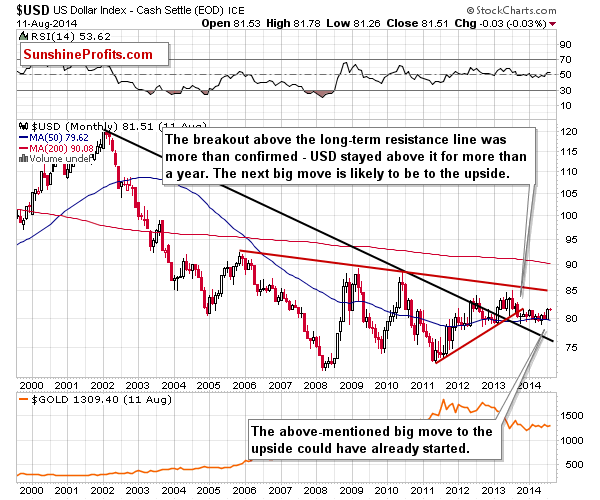
The long-term resistance line was broken at the beginning of 2013 and the currency index has spent the following year in a consolidation pattern – verifying the breakout. The most profound attempt to move lower was seen in the second half of 2013, when the USD declined below the 50-month moving average and almost touched the previously broken resistance line. The line held and the move below the above-mentioned moving average was invalidated. The latter later served as support many times and was not successfully broken.
Based on the long-term breakout, we have been expecting the next significant move to be to the upside and it seems that the waiting is over. The rally that we’ve seen in July was significant enough to look like a start of a new big rally.
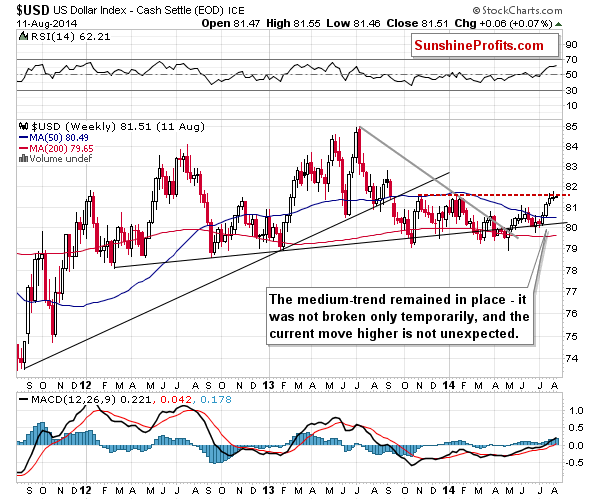
On the medium-term chart, the July rally is also visible, but from this perspective we see one additional thing – the resistance level created by the late-2013 and early-2014 highs. This tells us that even though the USD Index is likely to rally in the coming months, it may need to take a breather for a week or a few of them. Once the resistance levels are taken out, the next resistance is slightly below the 83 level, at the mid-2013 high, but this top is not very important, so the resistance is not very strong either. Ne next significant resistance is at the 84-85 area because that’s where the USD Index topped in 2012 and 2013.
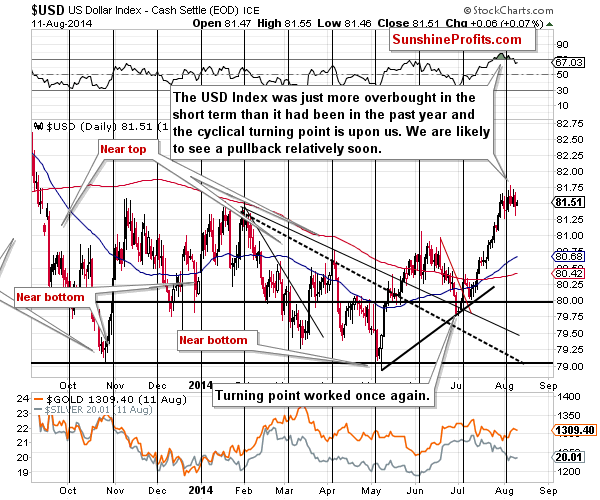
The short-term chart confirms that we could indeed see a decline before seeing the continuation of the rally. We have already commented on the above chart in today’s Gold & Silver Trading Alert, so we will quote what we wrote also here:
The U.S. dollar is after a sizable rally and right after the turning point, which is likely to cause at least a small decline.
If the USD Index doesn’t decline in the next several days, it will prove the dollar’s strength. We saw a sizable rally in July and if the US dollar is able to hold these gains and only correct in a mild, horizontal way, then we will likely see another big upswing shortly. For now, the index is still close to the cyclical turning point, and thus prone to a corrective downswing.
Please note that with each passing day, the USD Index is getting further from the turning point, and the odds for a decline diminish. Another reason is that we are already seeing a consolidation pattern in the index – we are no longer “extremely likely” to see at least a pause, as we are already seeing it. The RSI indicator is once again below the 70 level, so the situation is no longer overbought on a short-term basis.
Summing up, the USD Index is likely to move much higher in the following months, but not necessarily right away. The medium-term resistance was reached so a short-term decline here seems likely.
Thank you.
Nadia Simmons
Forex & Oil Trading Strategist
Przemyslaw Radomski, CFA
Founder, Editor-in-chief
Gold & Silver Trading Alerts
Forex Trading Alerts
Oil Investment Updates
Oil Trading Alerts
