
Forex Trading Alert originally sent to subscribers on July 15, 2014, 5:08 PM.
Earlier today, the U.S. dollar hit a three-week high against its Canadian counterpart after Federal Reserve Chair Janet Yellen testimony in Congress. Will the exchange rate climb above 1.0800?
In our opinion the following forex trading positions are justified - summary:
EUR/USD
The medium-term outlook hasn’t changed much as EUR/USD still remains in the consolidation below the long-term resistance line. Today, we’ll take a closer look at the very short-term changes.
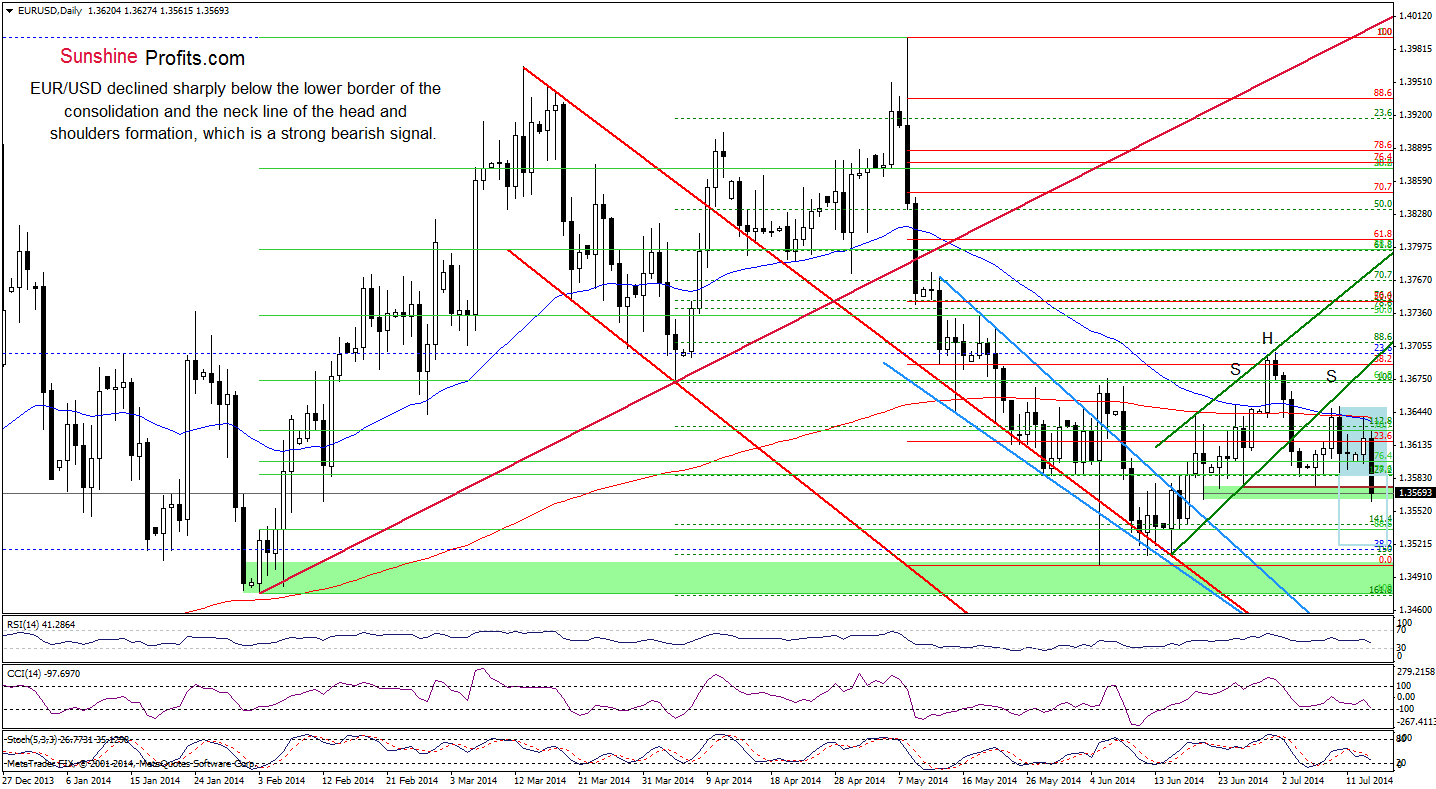
Looking at the above chart, we see that EUR/USD declined below the lower border of a consolidation (marked with blue), which triggered further deterioration and a drop below the neck line of the head and shoulders reversal formation. Taking this bearish fact into account, we are still convinced that our Wednesday’s commentary on this currency pair is still up-to-date:
(…) we think that the pair is currently building the right shoulder of this pattern. If this is the case (…), we’ll see a correction to the neck line based on the June 26 and July 7 lows (but further deterioration will be even more likely if the pair drops below the green support zone). If this area is broken, the exchange rate will test the strength of the June lows, where the size of a downswing will correspond to the height of the formation (this scenario is currently reinforced by the strong resistance zone created by the 50- and 200-day moving averages).
Very short-term outlook: bearish
Short-term outlook: mixed with bearish bias
MT outlook: bearish
LT outlook: bearish
Trading position (short-term): We are quite close to opening short positions in the EUR/USD pair, but, in our view, the move below the neck level is a bit too small to trust it. We’ll keep our eyes open and will keep you updated.
USD/CAD
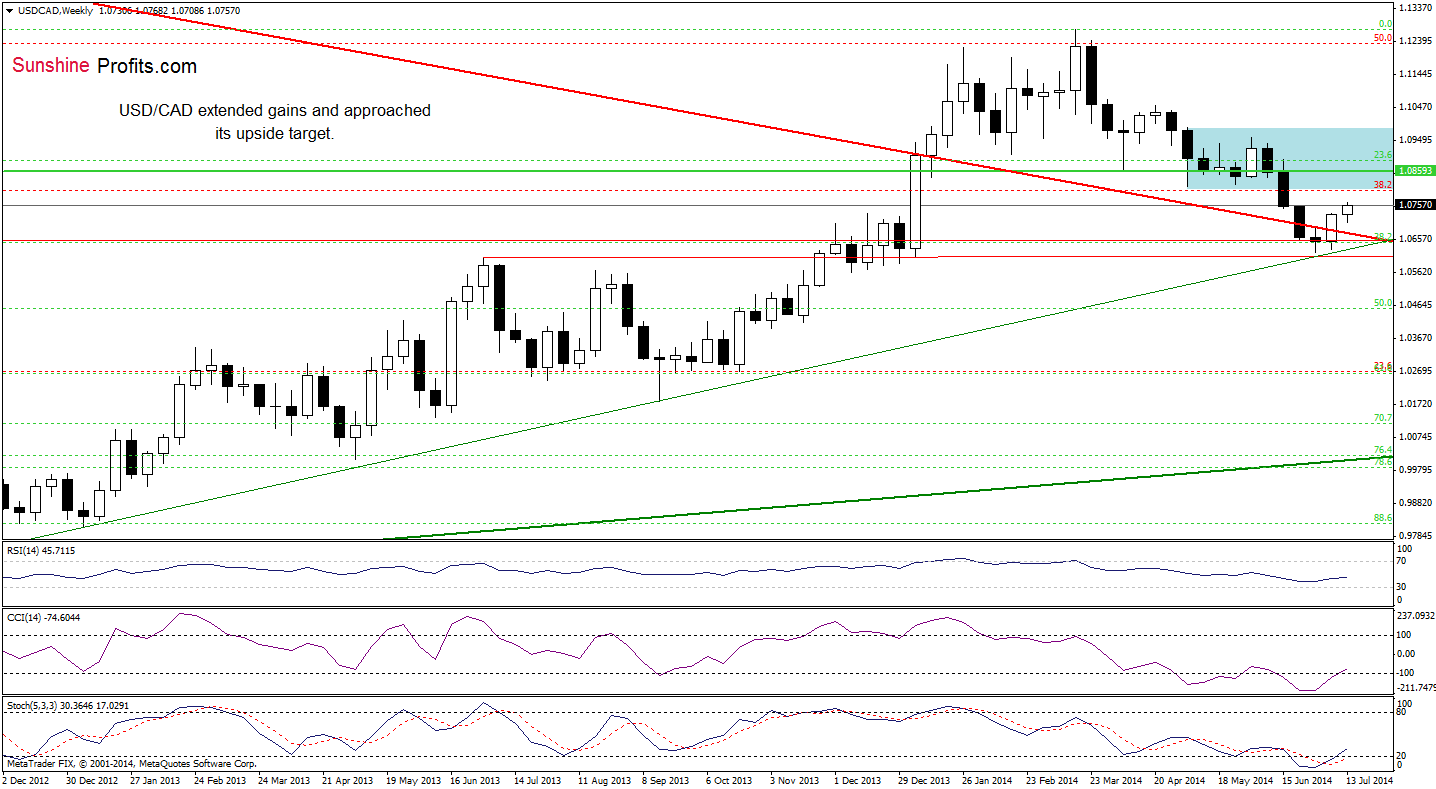
Quoting our Forex Trading Alert posted on July 11:
(…) USD/CAD rebounded sharply, invalidating last month’s breakdown below the red declining support/resistance line. This is a strong bullish signal that will likely encourage forex traders to push the buy button, which may translate to further improvement (especially if the CCI and Stochastic Oscillator generate buy signals). If this is the case, the initial upside target will be around 1.0813, where the previously-broken lower border of the consolidation (marked with blue) is.
From this perspective, we see that the exchange rate extended gains this week, while the CCI and Stochastic Oscillator generated buy signals. Therefore, we believe that we’ll see further improvement and currency bulls will realize the above-mentioned scenario in the coming week (or weeks).
Having discussed the above, let’s move on to the daily chart.
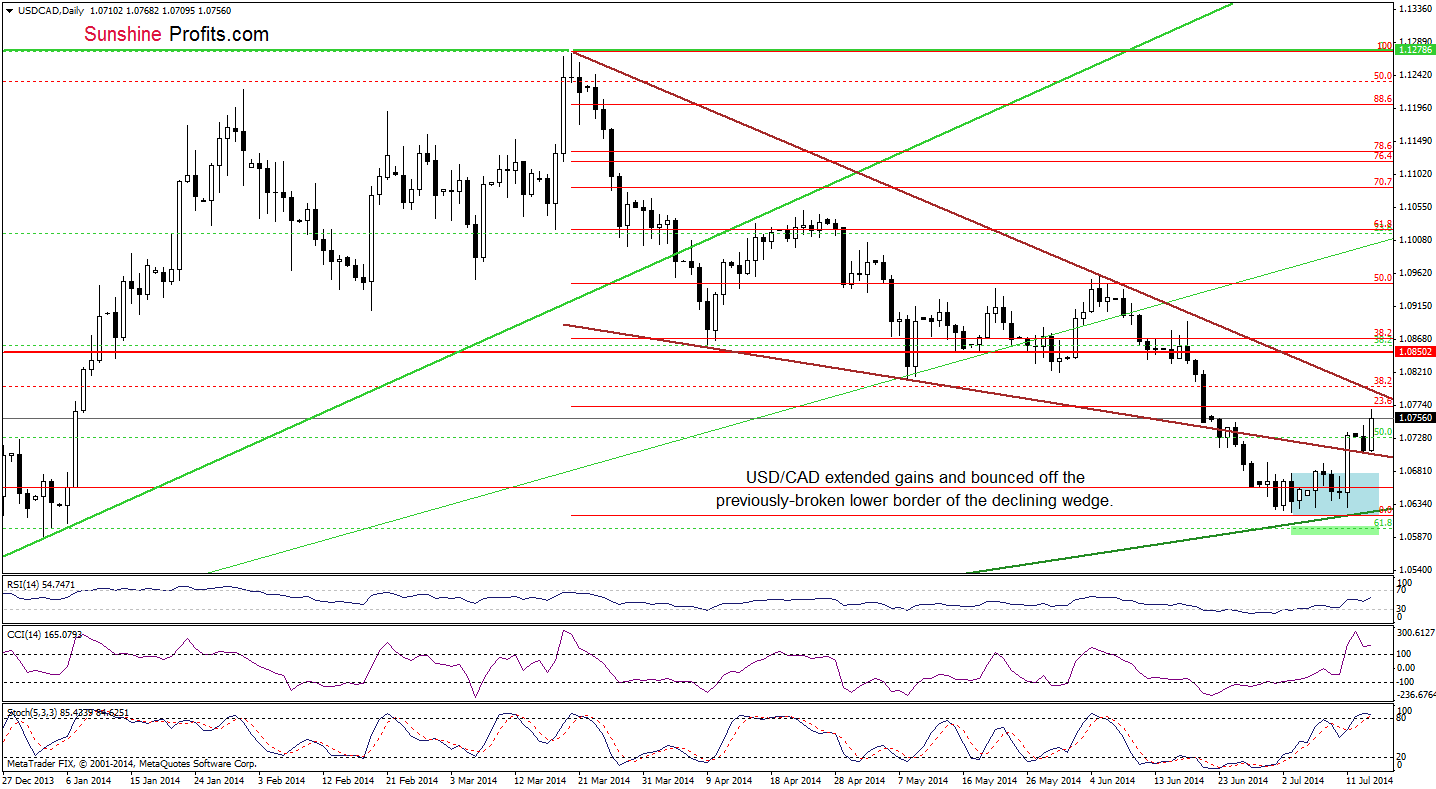
On Friday, we wrote the following:
(…) the exchange rate climbed above the lower border of the declining wedge, invalidating earlier breakdown. This is a strong bullish signal, which may accelerate further improvement. If this is the case, the initial upside target for currency bulls will be around 1.0773, where the 23.6% Fibonacci retracement (based on the entire March-July decline) is. If it is broken, the next target will be the upper line of the declining wedge (currently around 1.0811).
As you see on the above chart, the situation has developed in line with our last commentary after USD/CAD bounced off the previously-broken lower border of the declining wedge and approached its initial upside target. Despite this improvement, we should keep in mind that the CCI and Stochastic Oscillator are overbought (additionally, there is a negative divergence between the CCI and the exchange rate), which suggests that the space for gains might be limited and a pause or correction is just around the corner.
Very short-term outlook: mixed
Short-term outlook: mixed
MT outlook: mixed
LT outlook: bearish
Trading position (short-term): In our opinion no positions are justified from the risk/reward perspective. We will keep you informed should anything change, or should we see a confirmation/invalidation of the above.
AUD/USD
The medium-term outlook remains mixed as AUD/USD is still trading in a consolidation between the May lows and the April high. Today, we’ll take a closer look at the daily chart.
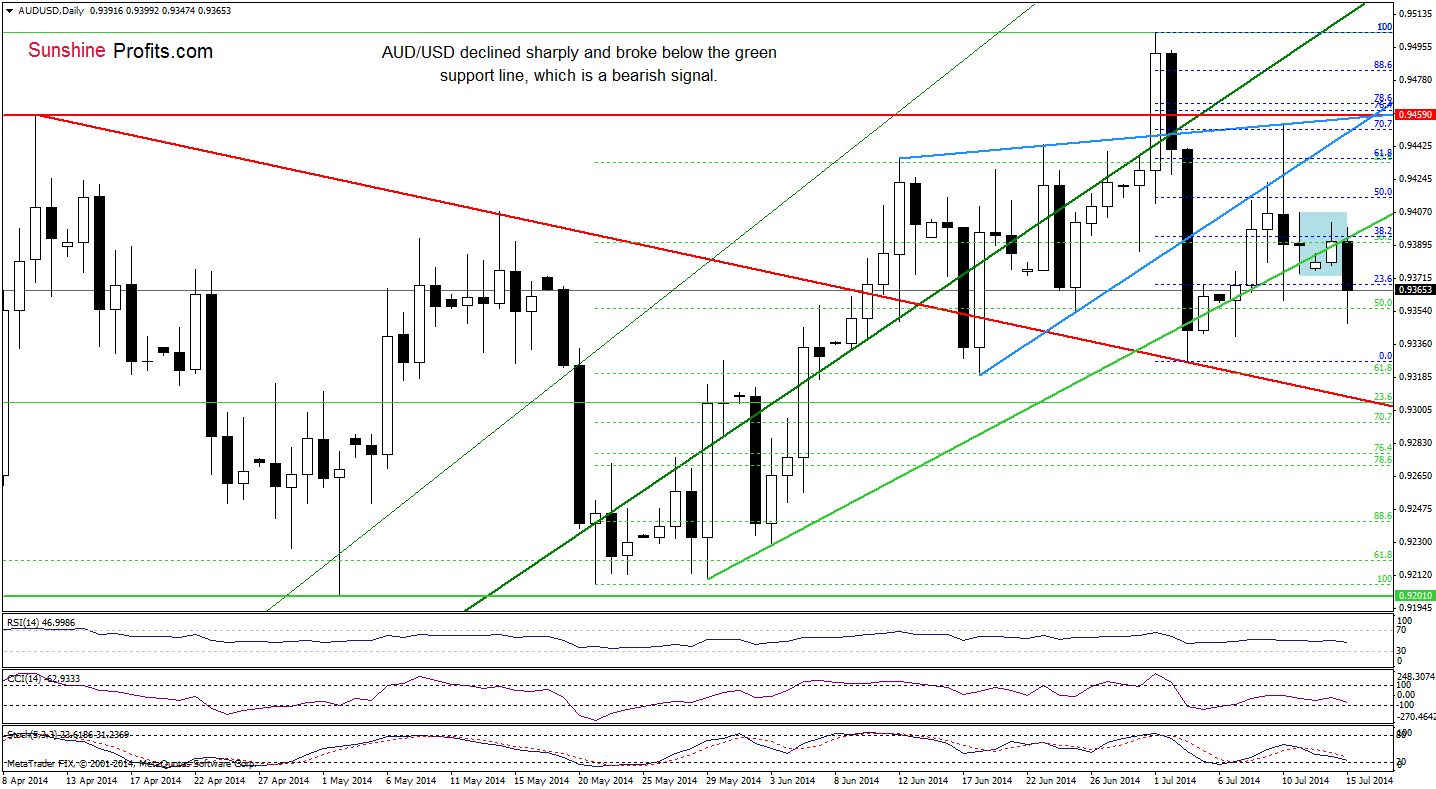
From this perspective, we see that AUD/USD declined below its key support line, which triggered a pullback below the lower border of the consolidation (marked with blue). This is a bearish signal, therefore, we believe that our last commentary on this currency pair is up-to-date:
(…) if this important line is broken (…), we think that the current correction will accelerate and we’ll see a drop to the July low of 0.9327 or even to the declining red support line (currently around 0.9316).
Very short-term outlook: mixed
Short-term outlook: mixed
MT outlook: mixed
LT outlook: bearish
Trading position (short-term): In our opinion, no positions are justified from the risk/reward perspective. We will keep you informed should anything change, or should we see a confirmation/invalidation of the above.
Thank you.
Nadia Simmons
Forex & Oil Trading Strategist
Przemyslaw Radomski, CFA
Founder, Editor-in-chief
Gold & Silver Trading Alerts
Forex Trading Alerts
Oil Investment Updates
Oil Trading Alerts
