
Forex Trading Alert originally sent to subscribers on April 29, 2014, 12:05 PM.
Earlier today, the euro declined sharply from almost two-week high against the U.S. dollar after preliminary data showed that German consumer prices fell 0.2% this month, and increased 1.3% on a year-over-year basis (while analysts had expected a monthly decline of 0.1% and an annual increase of 1.4%). Did this weakness change anything in the short-term outlook?
In our opinion the following forex trading positions are justified - summary:
- EUR/USD: none
- GBP/USD: none
- USD/JPY: none
- USD/CAD: none
- USD/CHF: none
- AUD/USD: short (stop-loss order: 0.9410; initial price target: 0.9060)
EUR/USD
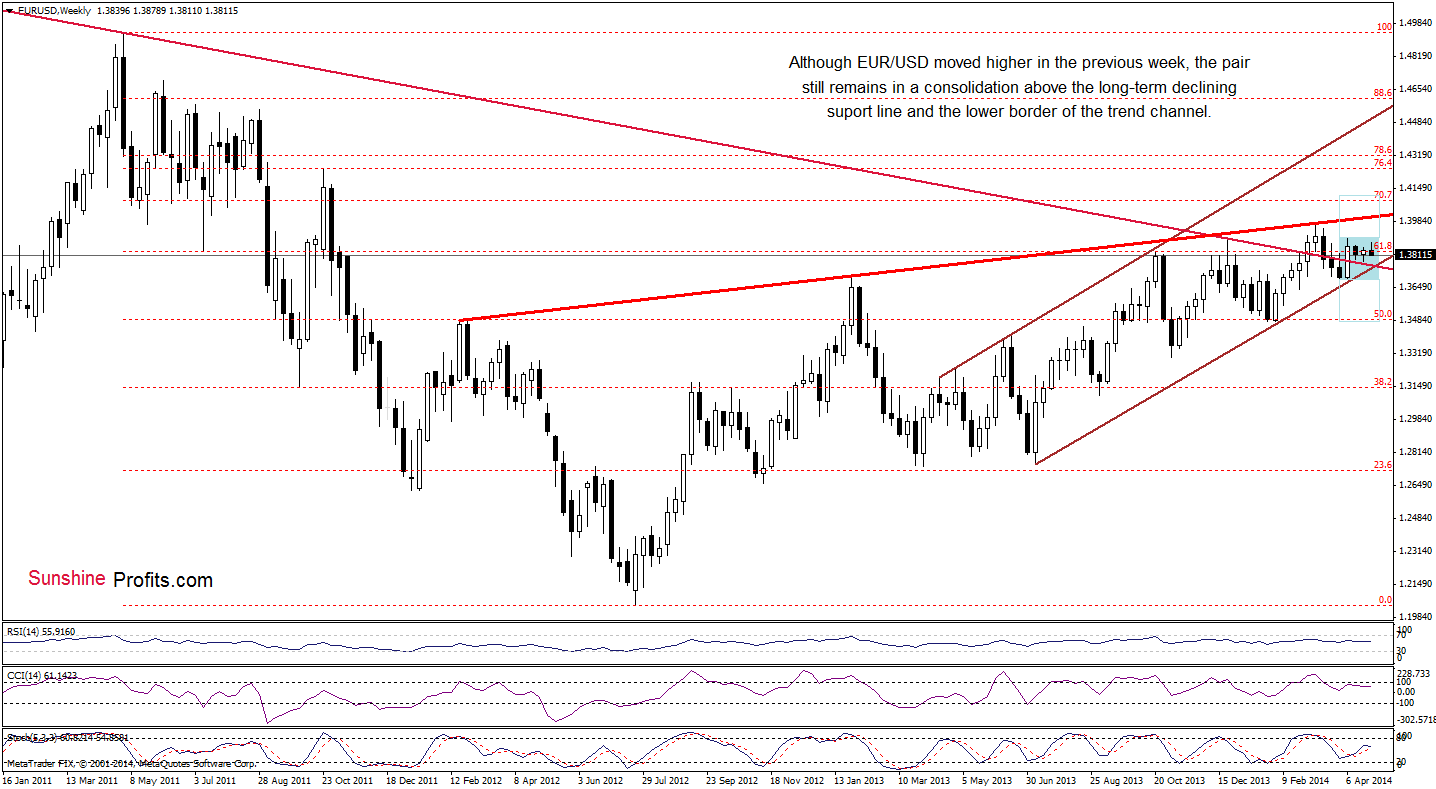
Looking at the weekly chart, we see that although EUR/USD extended gains and hit a 2-week high of 1.3879, the situation in the medium term hasn’t changed much as the pair still remains in a consolidation (marked with light blue). Please keep in mind that the nearest resistance is still around 1.3905, where the upper line of the consolidation is.
Once we know the above, let’s take a look at the daily chart.
In our last Forex Trading Alert, we wrote the following:
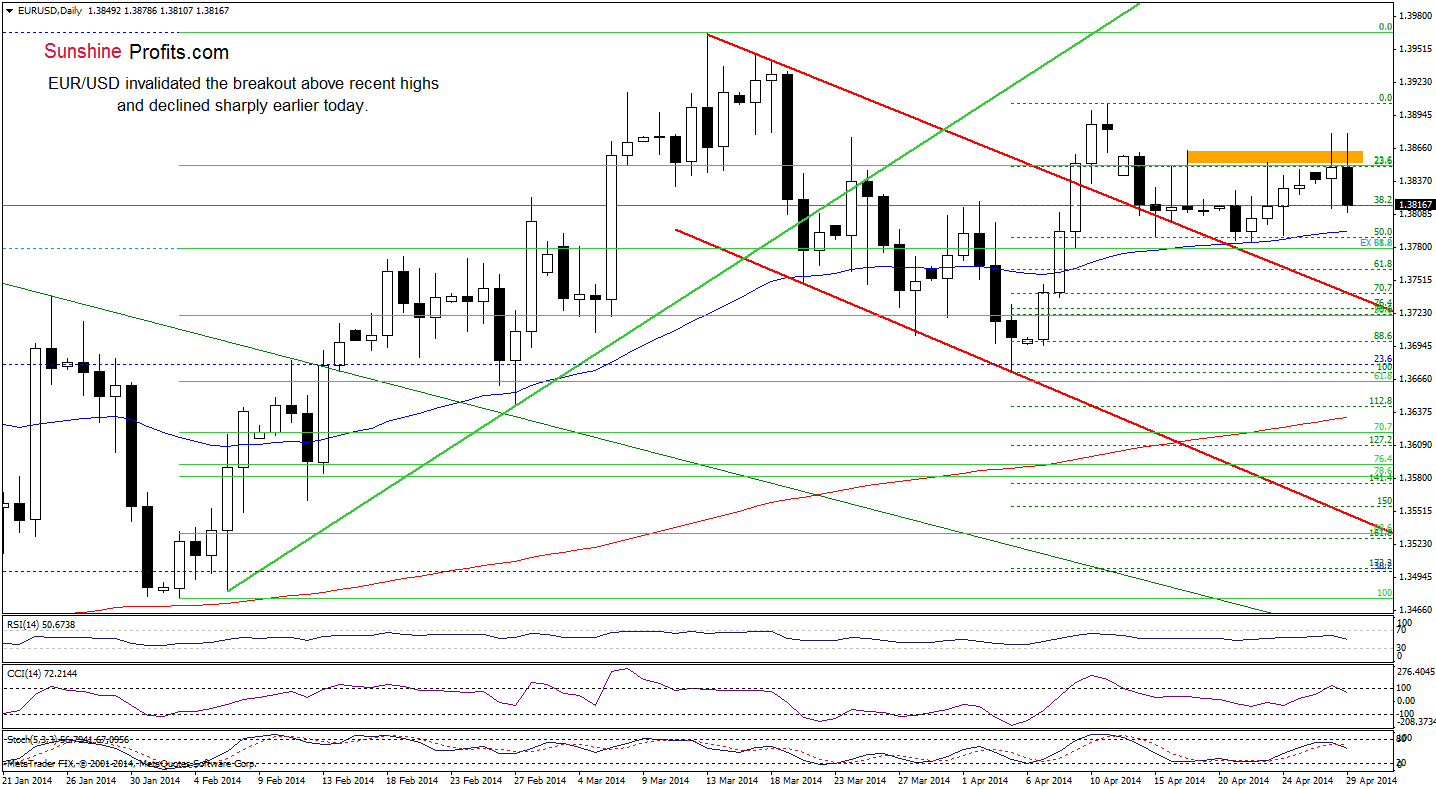
(…) if the buyers push the order button once again and push the pair above today’s high, we will likely see another attempt to reach the April high.
As you see on the above chart, although EUR/USD moved higher and broke above the resistance zone created by the Apr.17 and Apr.23 highs once again, the buyers didn’t manage to hold gained levels. This show of weakness encouraged sellers to act and triggered a sharp decline below yesterday’s low. In this way, another breakout was invalidated, which is a strong bearish signal. Additionally, the CCI and Stochastic Oscillator generated sell signals, which suggests that further deterioration should not surprise us. Please note that if the exchange rate extends losses, the initial downside target for the sellers will be the 50-day moving average (currently around 1.3795).
Very short-term outlook: bearish
Short-term outlook: mixed with bearish bias
MT outlook: bearish
LT outlook: bearish
Trading position: In our opinion no positions are justified from the risk/reward perspective.
GBP/USD
From the weekly perspective, we see that the situation hasn’t changed much. Therefore what we wrote yesterday is up-to-date.
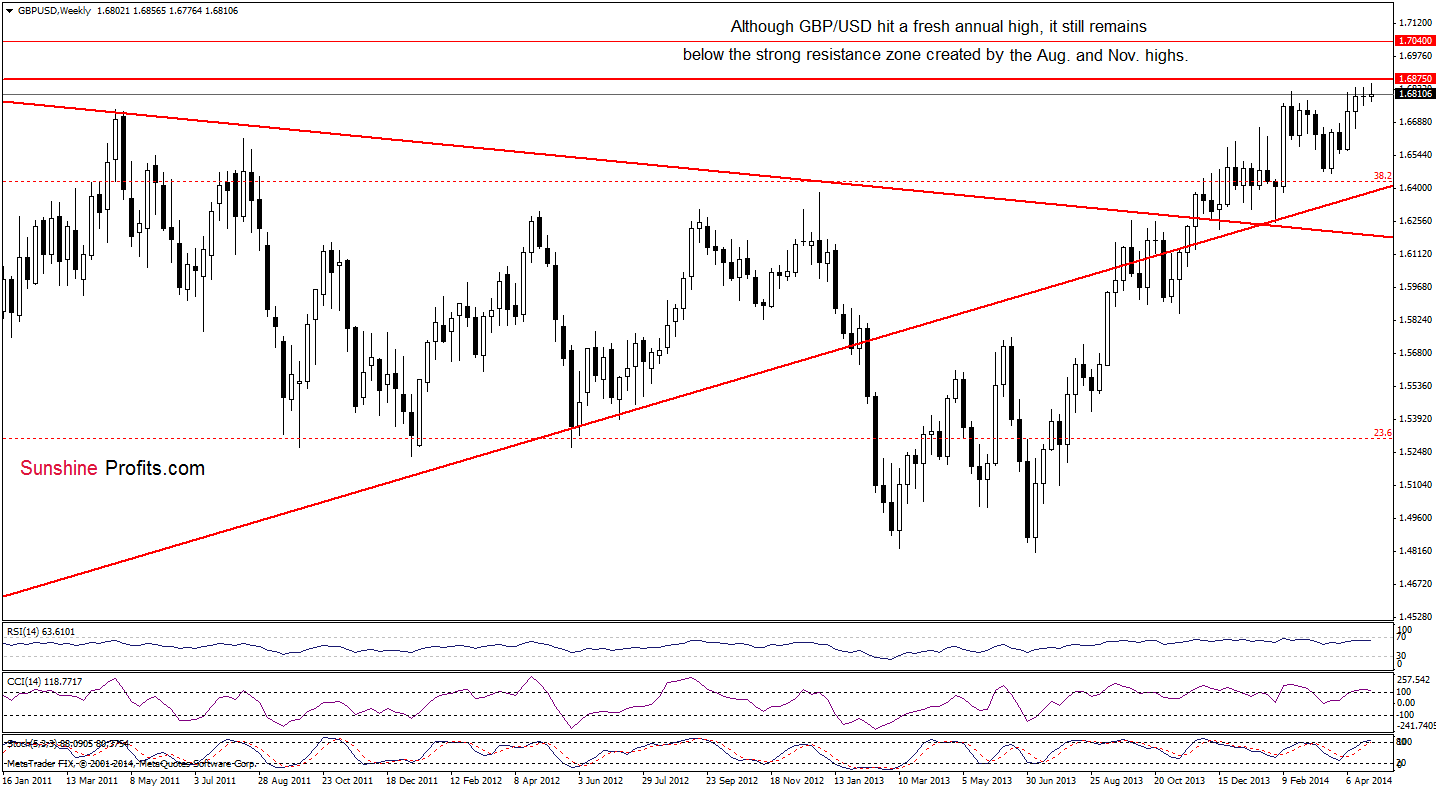
(…) Although GBP/USD extended gains and hit a fresh 2014 high, the pair reversed and declined, invalidating the breakout above the previous high. This is a bearish signal – especially when we factor in the proximity to the strong resistance zone created by Aug. and Nov. 2009 highs and the current position of the indicators (the CCI and Stochastic Oscillator are overbought). Taking these circumstances into account, another attempt to move lower should not surprise us.
Let’s take a closer look at the daily chart.
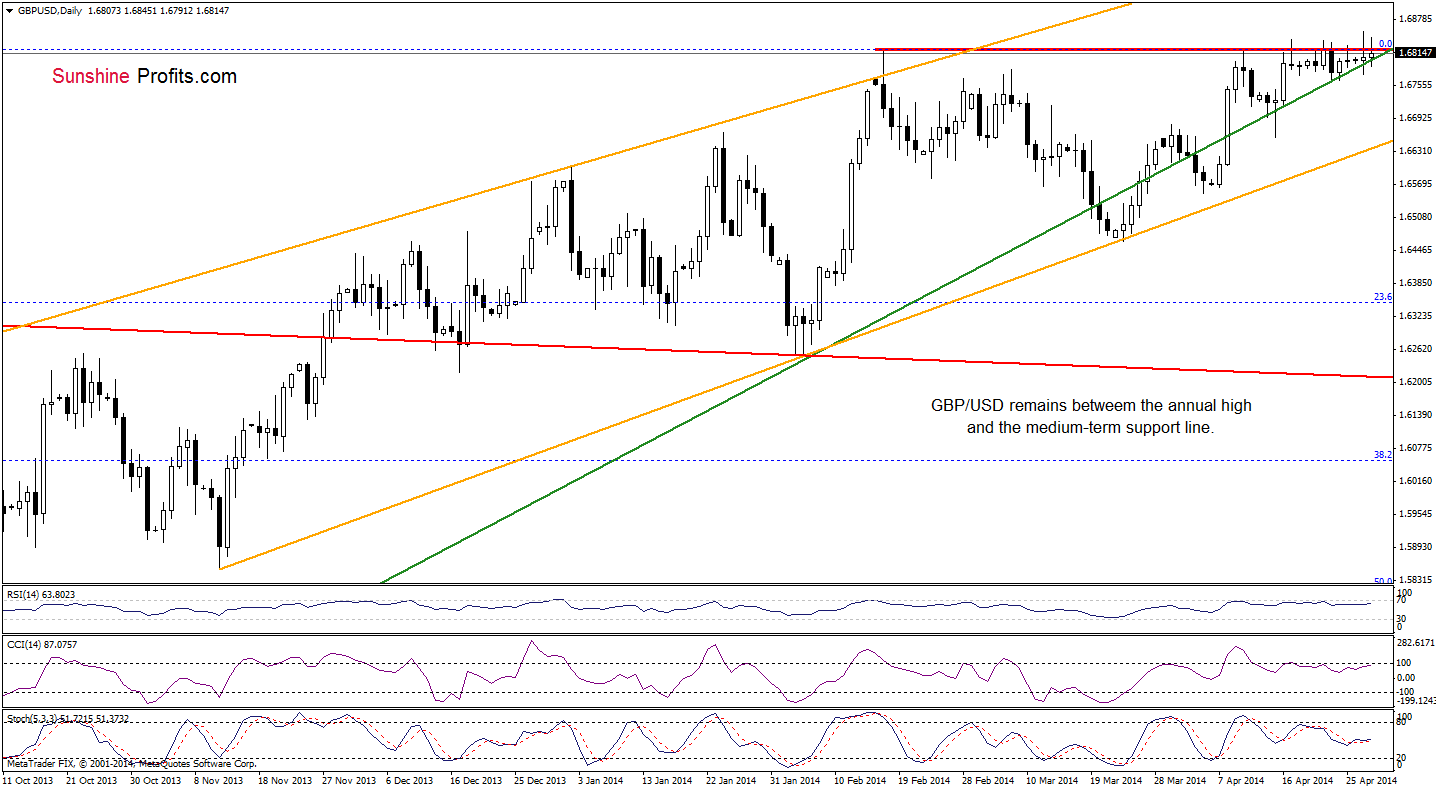
Looking at the daily chart, we see the very short-term outlook is still unclear as GBP/USD remains between the 2014 high and the medium-term green support line. From this perspective, it seems that as long as there is no confirmed breakout (or breakdown), another sizable move is not likely to be seen.
Very short-term outlook: mixed
Short-term outlook: mixed
MT outlook: bearish
LT outlook: mixed
Trading position (short-term): In our opinion, no positions are justified from the risk/reward perspective.
USD/JPY
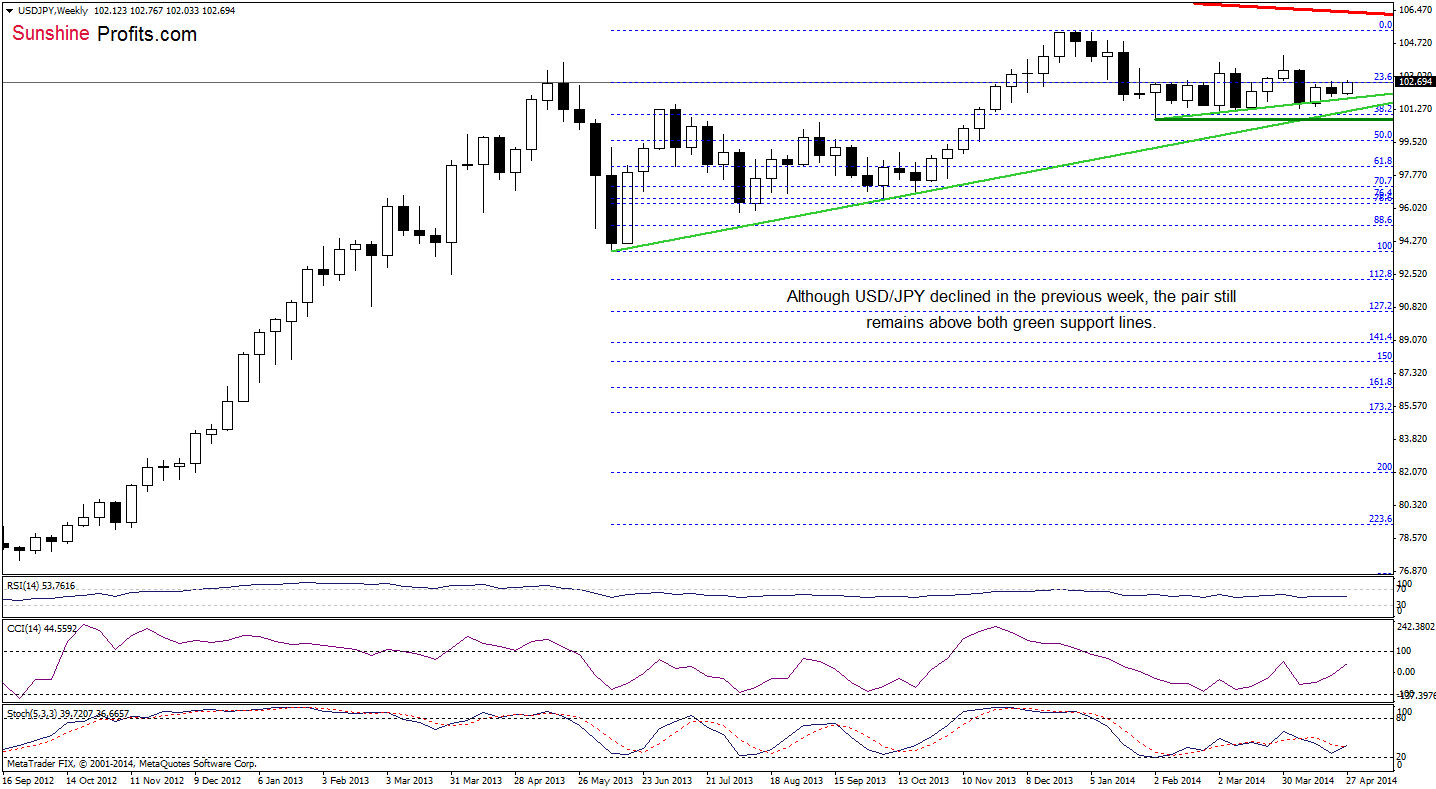
On the weekly chart, we see that although USD/JPY declined in the previous week, the pair rebounded this week, improving the medium-term outlook.
Let’s take a look at the daily chart.
In our previous Forex Trading Alert, we wrote the following:
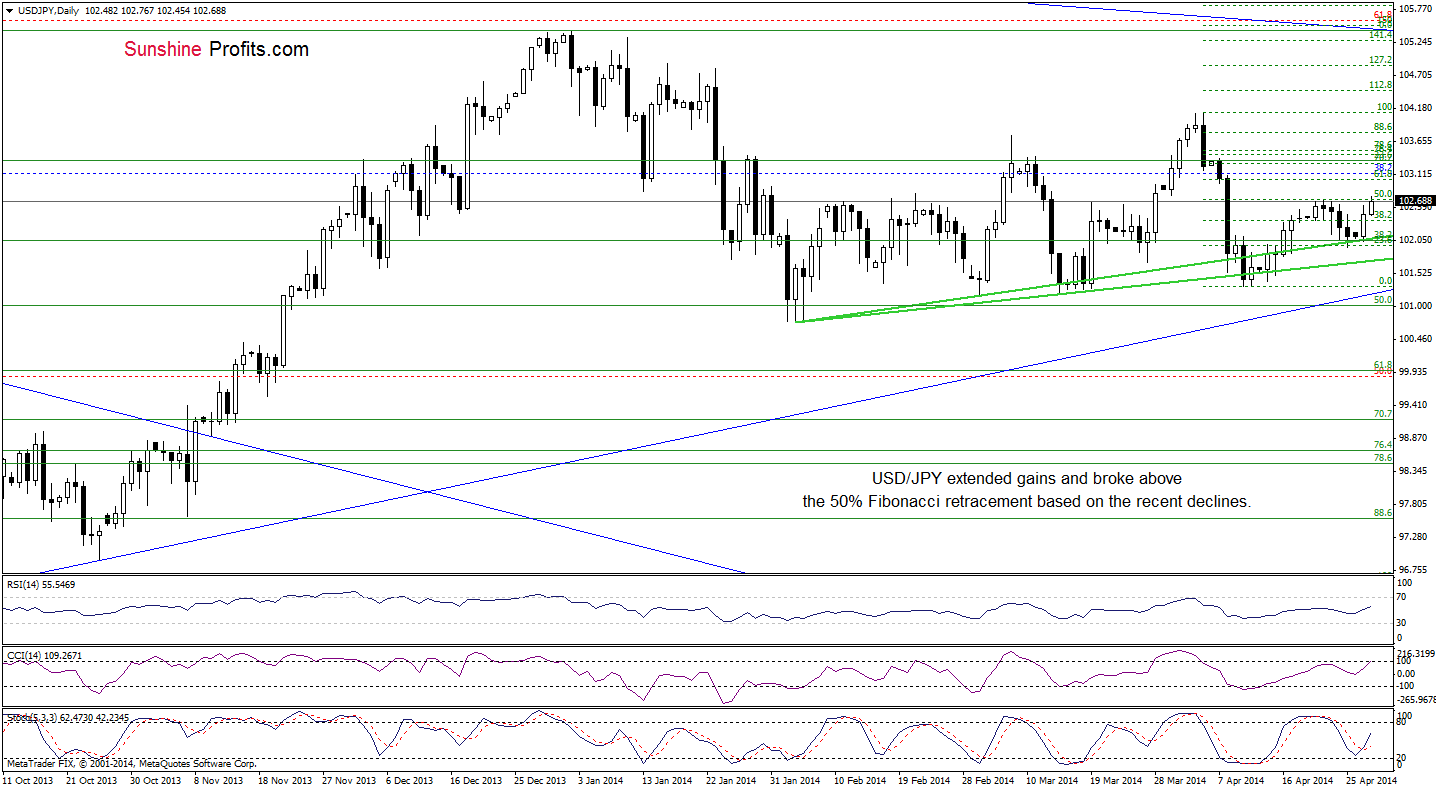
(…) the exchange rate approached the recent highs. If this resistance area holds, we may see another test of the strength of the green line. However, if it is broken, the next upside target for the buyers will be the 61.8% Fibonacci retracement based on the entire April decline (around 103).
As you see on the daily chart, the buyers do not give up and successfully pushed the exchange rate higher, climbing above the recent highs and the 50% Fibonacci retracement. Taking this fact into account and combining it with the position of the indicators (none of them is overbought), it seems that the above-mentioned upside target will be reached in the near future.
Very short-term outlook: bullish
Short-term outlook: mixed with bullish bias
MT outlook: bullish
LT outlook: bearish
Trading position (short-term): In our opinion no positions are justified from the risk/reward perspective at the moment.
USD/CAD
Yesterday, we wrote the following:
(…) although USD/CAD moved higher in the previous weeks, the pair didn’t even erased 50% of earlier losses. The size of the corrective upswing is still quite small, which suggests that another attempt to move lower can’t be ruled out.
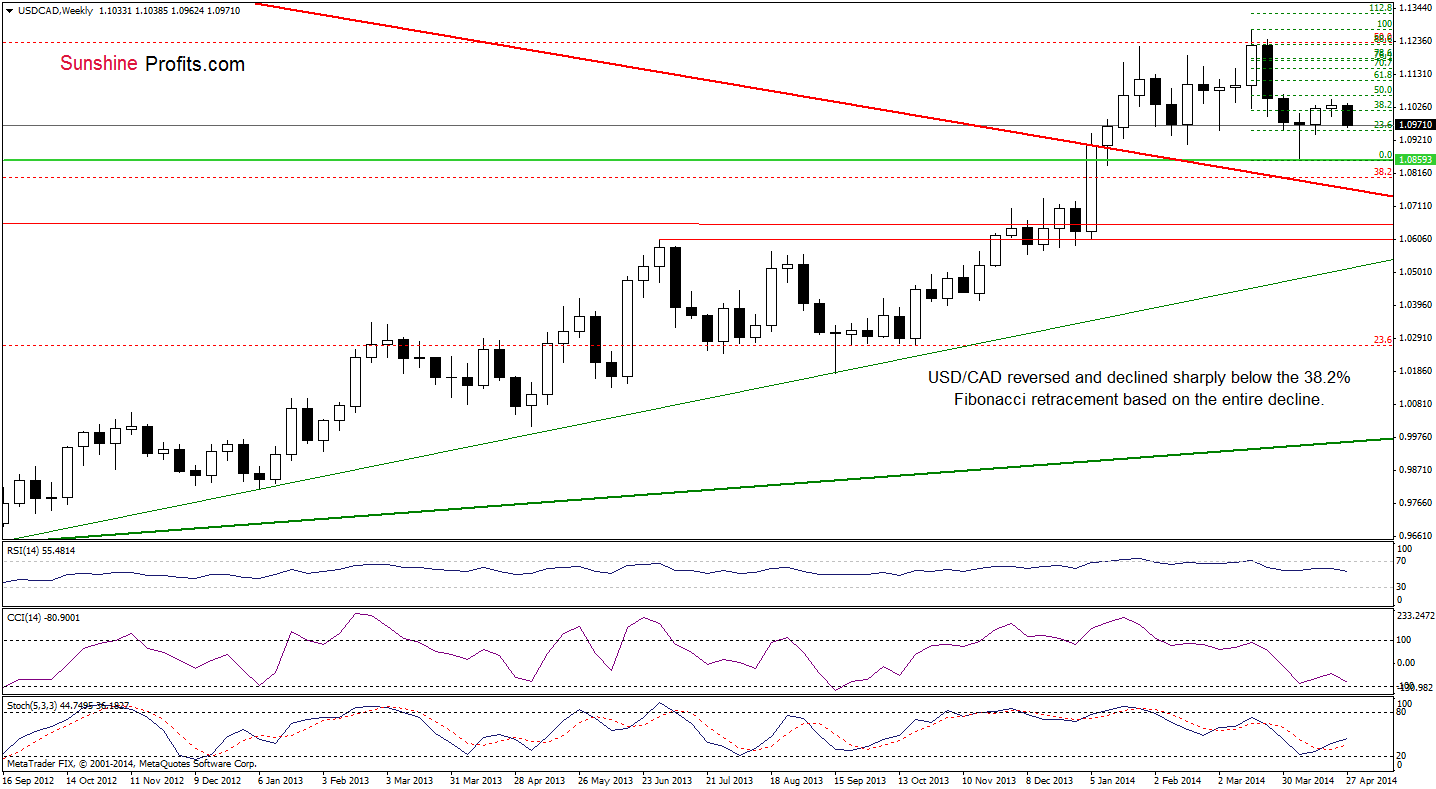
Looking at the weekly chart, we see that the exchange rate reversed and extended declines. With this downward move, the pair moved below the previously-broken 38.2% Fibonacci retracement, and it seems that the initial target for the sellers (at least from this perspective) will be around 1.0941. If this support is broken, we may see a drop to around 1.0857, where the April low is.
Let’s move on to the daily chart.
Quoting our last Forex Trading Alert:
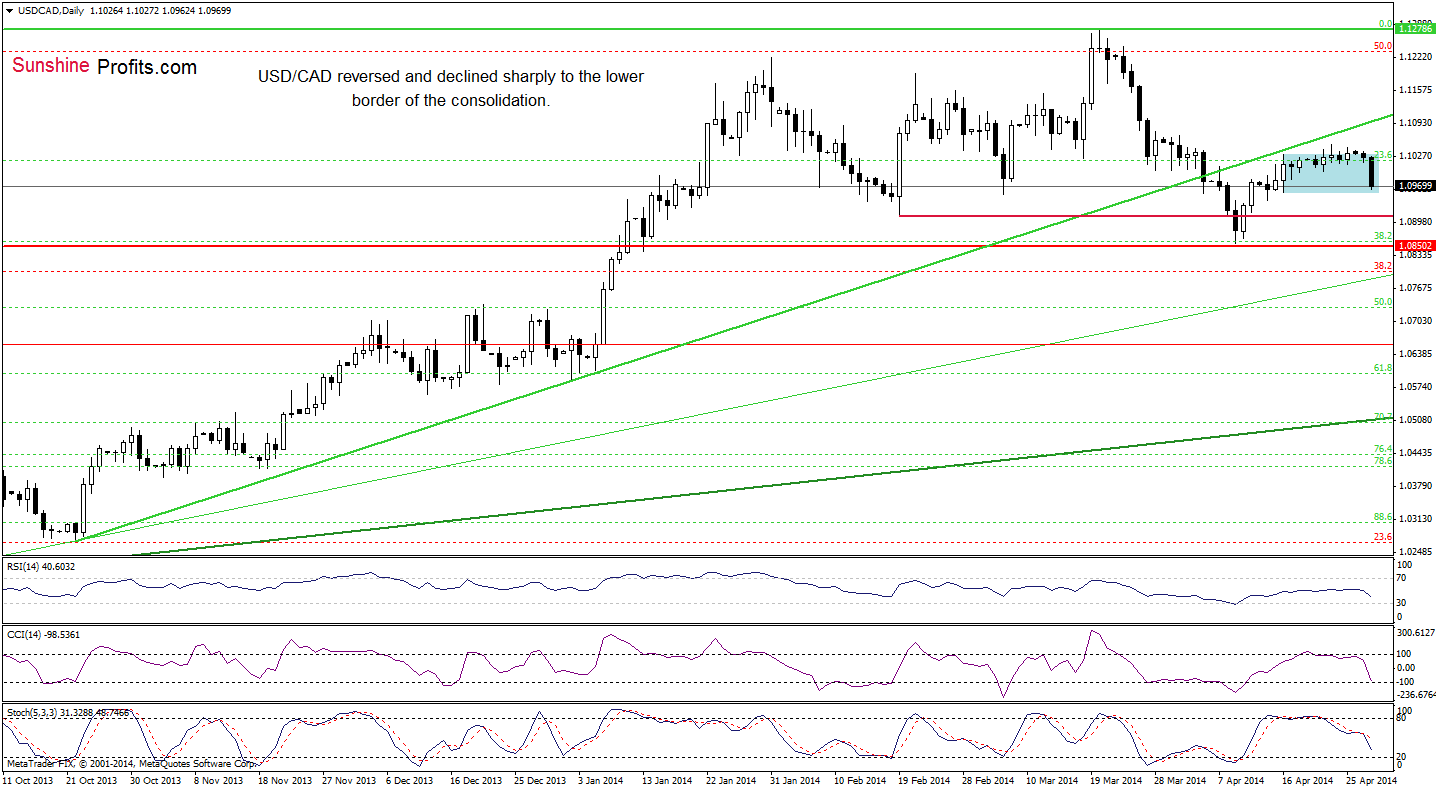
(…) there were several attempts to break above the upper line of the consolidation (created by the Apr.16 high) in the previous week, they all failed. Earlier today, we saw another try to move higher, but the buyers disappointed and USD/CAD came back to the consolidation range once again. Taking these facts into account and combining with the current position of the indicators (sell signals generated by the CCI and Stochastic Oscillator remain in place), it seems that a correction in the coming days should not surprise us. If this is the case, we will likely see a pullback to around 1.0982 (the April 17 low) or even to 1.0958, where the lower border of the consolidation is.
As you see on the above chart, forex traders pushed the sell button and approached the downside target earlier today as USD/CAD hit an intraday low of 1.0962. If the proximity to the support level encourages buyers to act, we may see a corrective upswing in the coming day (or days). However, if the sellers do not give up and the pair declines below the lower border of the consolidation, we may see a correction even to around 1.0882 (in this area the size of the downswing will correspond to the height of the consolidation range).
Very short-term outlook: bearish
Short-term outlook: bearish
MT outlook: bullish
LT outlook: bearish
Trading position (short-term): In our opinion no positions are justified from the risk/reward perspective.
USD/CHF
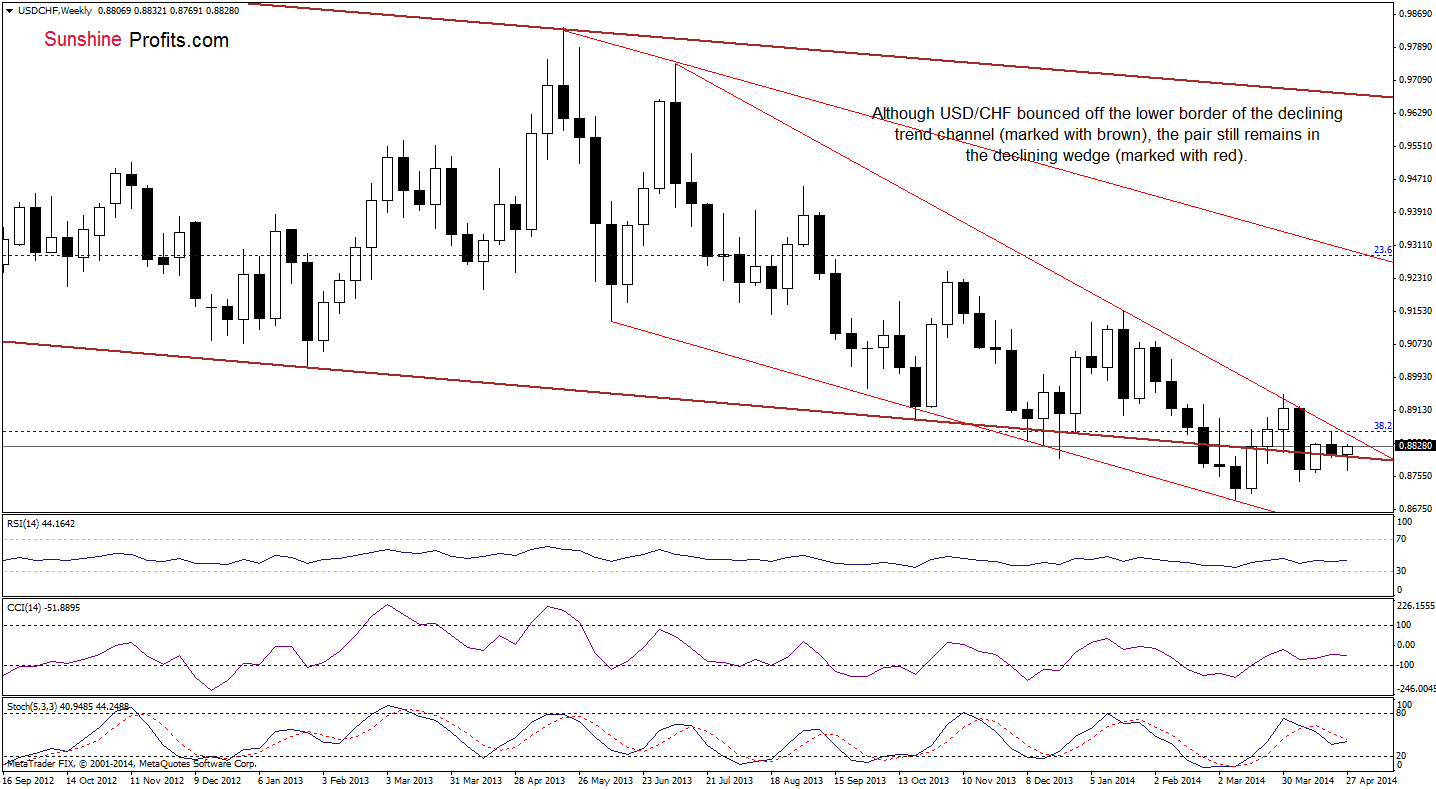
Looking at the weekly chart, we see that USD/CHF came back above the lower line of the declining trend channel, invalidating earlier small breakdown. This is a bullish signal, which suggests that we may see further improvement and an increase to the upper line of the declining wedge (currently around 0.8860, which corresponds to the previous week high).
Once we know the above, let’s take a closer look at the daily chart.
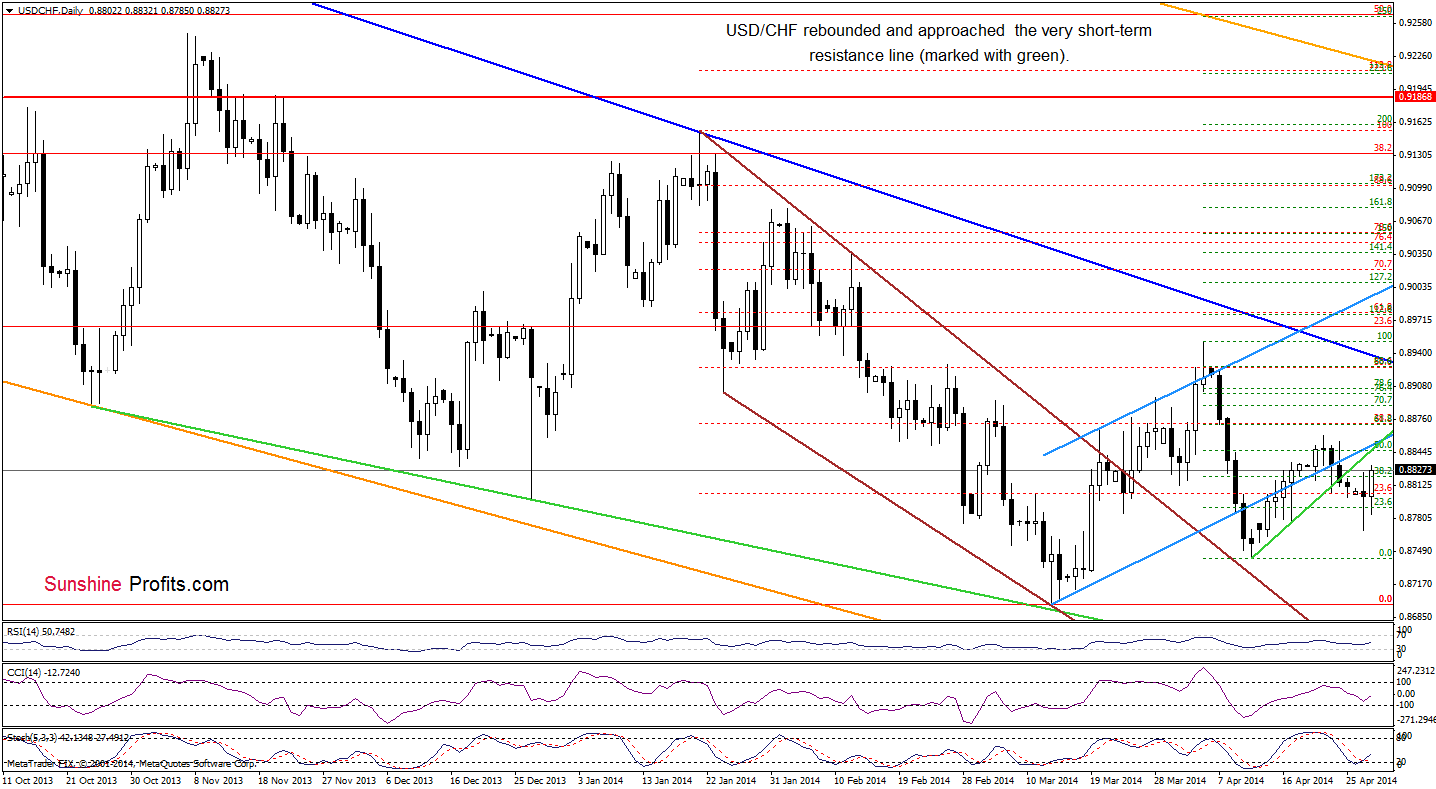
As you see on the above chart, USD/CHF reversed and rebounded sharply, climbing above yesterday’s high. Despite this improvement, the exchange rate still remains below the very short-term green line and the lower border of the rising trend channel, which together create the nearest resistance zone. From this perspective, it seems that as long as we won’t see a breakout above this area, the space for further increases will be limited. Nevertheless, taking into account the current position of the indicators, another attempt to move higher should not surprise us.
Very short-term outlook: mixed
Short-term outlook: mixed
MT outlook: bearish
LT outlook: bearish
Trading position (short-term): In our opinion no positions are justified from the risk/reward perspective.
AUD/USD
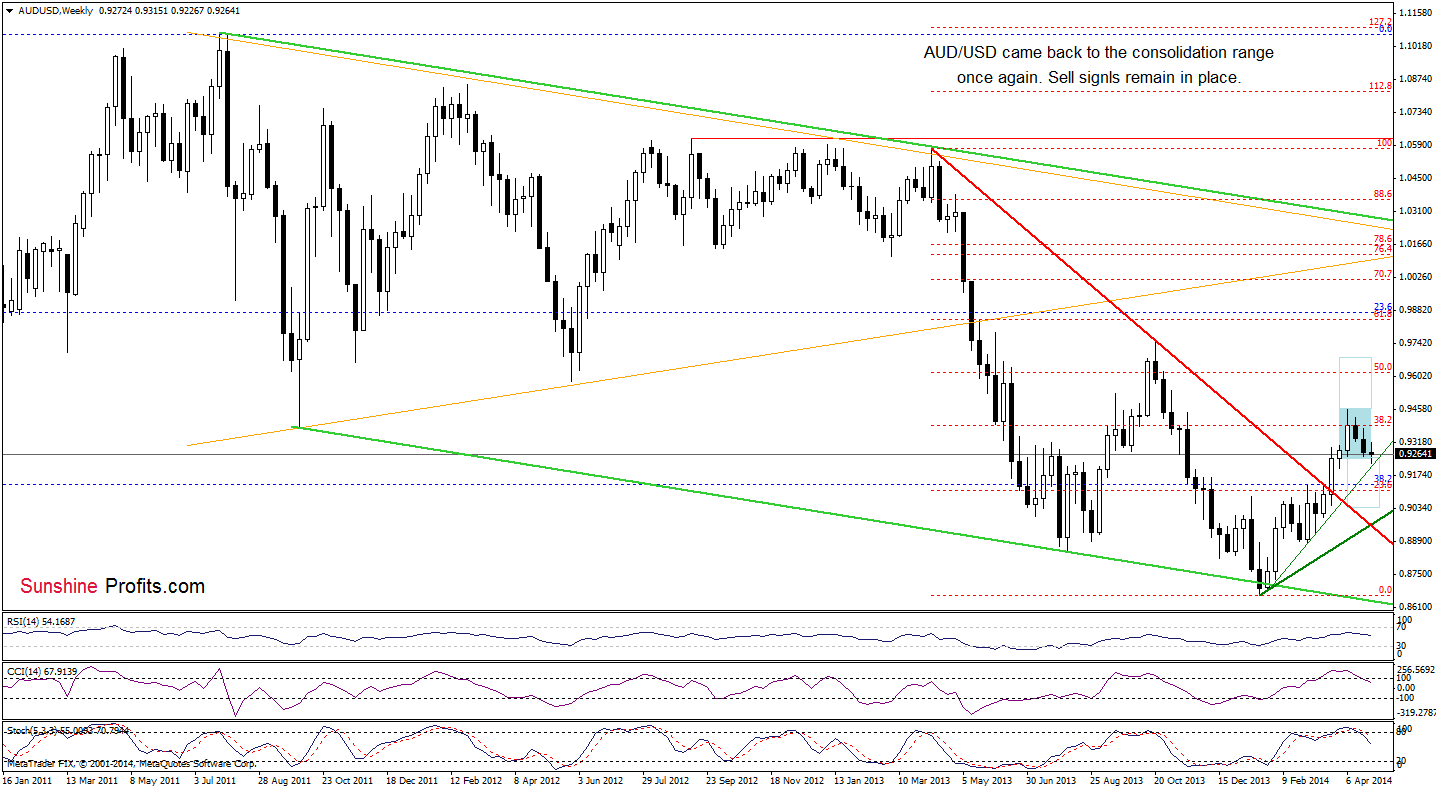
Looking at the weekly chart, we see that AUD/USD came back to the consolidation range. From this perspective, it seems that the current decline will accelerate after a breakdown below the thin green support line based on the February and March lows (around 0.9211 at the moment). If this is the case, we may see further deterioration and a drop to around 0.9046 (at this level the size of the downswing corresponds to the height of the consolidation range). Please keep in mind that sell signals generated by the CCI and Stochastic Oscillator remain in place, supporting the bearish case.
Once we know the medium-term situation, let’s move on to the daily chart.
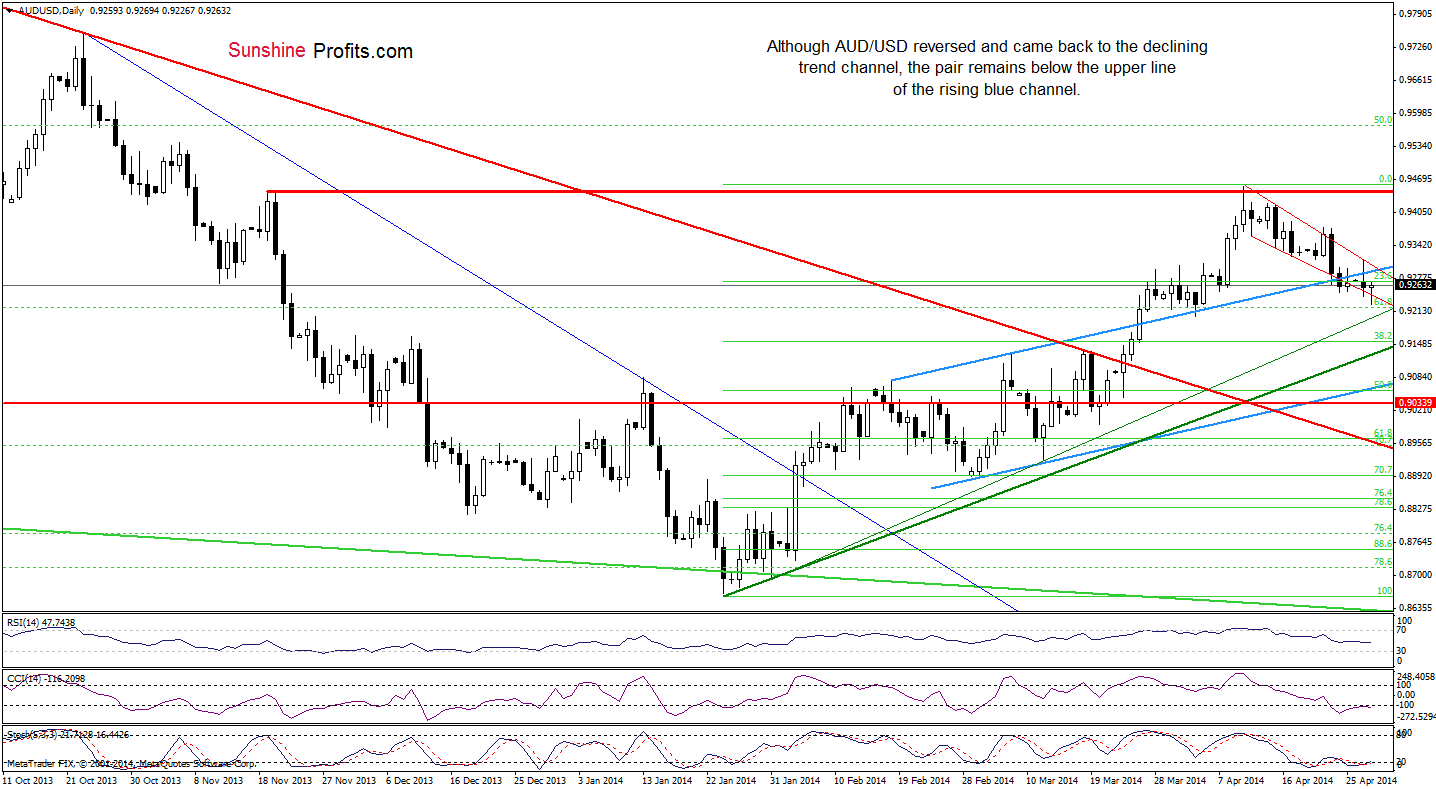
On the above chart, we see that although AUD/USD extended declines earlier today, the pair reversed and came back to the declining trend channel (marked with red). With this upswing, the exchange rate invalidated the breakdown below the lower line of this formation, which is a positive signal. Nevertheless, despite this improvement, AUD/USD still remains below the previously-broken upper border of the blue rising trend channel. If this resistance line encourages sellers to act, we will likely see another attempt to move lower. In this case, the next downside target for the sellers will be around 0.9204, where the Apr.3 low is. On the other hand, if the buyers do not give up and break above this blue line, it seems that the upper border of the declining trend channel will likely pause (or even stop) further improvement – similarly to what we saw yesterday.
Very short-term outlook: bearish
Short-term outlook: bearish
MT outlook: bearish
LT outlook: bearish
Trading position (short-term): Short. Stop-loss order: 0.9410 and initial price target: the lower border of the blue rising trend channel (currently at 0.9060).
Thank you.
Nadia Simmons
Forex & Oil Trading Strategist
Przemyslaw Radomski, CFA
Founder, Editor-in-chief
Gold & Silver Trading Alerts
Forex Trading Alerts
Oil Investment Updates
Oil Trading Alerts
