
Forex Trading Alert originally sent to subscribers on April 25, 2014, 11:03 AM.
Earlier today, the British pound moved higher against the U.S. dollar after data showed that U.K. retail sales rose 0.1% in March, beating expectations for a 0.4% drop. Despite these encouraging numbers, GBP/USD is still trading between the medium-term support and the 2014 high. Are there any technical factors that could drive the exchange rate higher or lower in the near future?
In our opinion the following forex trading positions are justified - summary:
- EUR/USD: none
- GBP/USD: short (stop-loss order: 1.6855)
- USD/JPY: none
- USD/CAD: none
- USD/CHF: none
- AUD/USD: short (stop-loss order: 0.9410; initial price target: 0.9060)
EUR/USD
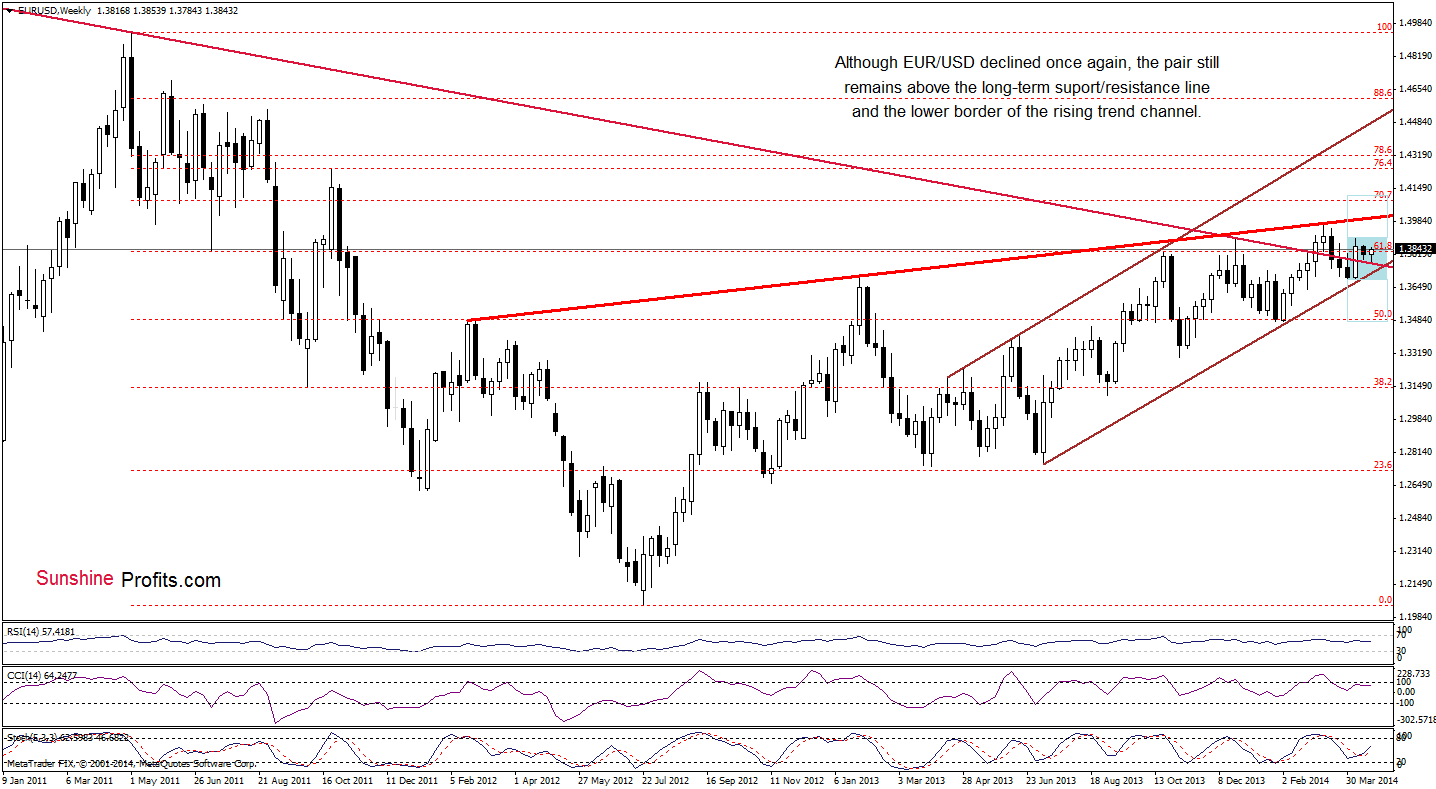
From the weekly perspective, we see that the situation hasn’t changed much. Therefore, what we wrote in our previous Forex Trading Alert is still up-to-date.
(…) EUR/USD remains in a consolidation (marked with light blue). If the proximity to the previously-broken long-term declining line encourages buyers to act, we will likely see an increase to the upper border of the consolidation (at 1.3905). However, if this important support line is broken, we may see a drop to the lower border of the rising trend channel (currently around 1.3728).
Once we know the above, let’s take a look at the daily chart.
Quoting our last Forex Trading Alert:
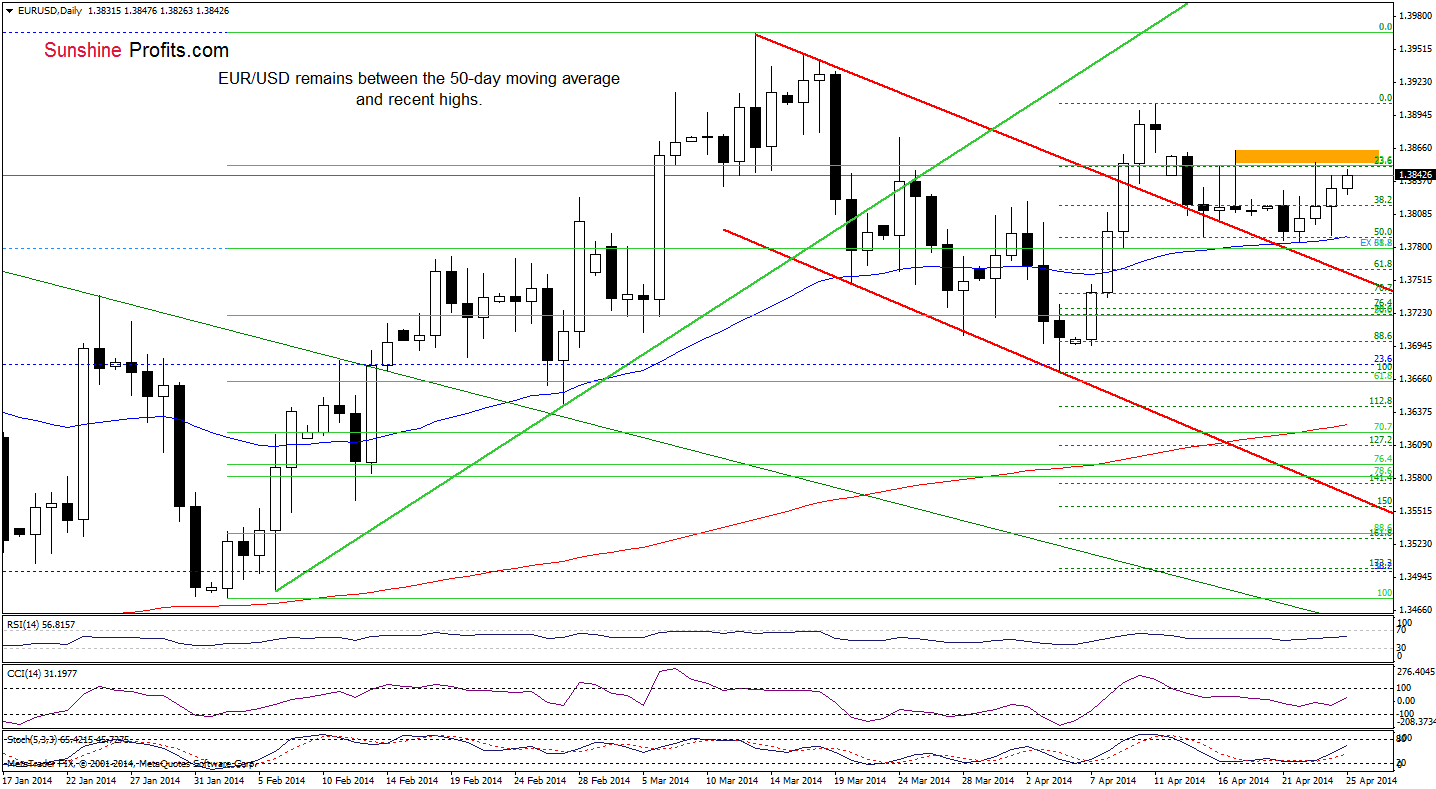
(…) the 50-day moving average successfully stopped further deterioration. (…) it seems that as long as this support is in play, the space for declines is limited and another attempt to move higher should not surprise us. If this is the case, and the pair moves above the April 17 high, we will likely see an increase to the April high (1.3905). Nevertheless, if the resistance level holds, we may see another test of the strength of the 50-day moving average (currently at 1.3787).
As you see on the above chart, despite earlier drop the buyers didn’t give up and pushed the pair above yesterday’s high, approaching the resistance zone created by the Apr.17 and Apr.23 highs. As we mentioned above, if this area is broken, EUR/USD will likely increase to the April high (1.3905). Otherwise, we’ll see a pullback to the 50-day moving average, which currently intersects the 50% Fibonacci retracement (based on the recent rally).
Very short-term outlook: mixed
Short-term outlook: mixed
MT outlook: bearish
LT outlook: bearish
Trading position: In our opinion no positions are justified from the risk/reward perspective. We will keep you informed should anything change, or should we see a confirmation/invalidation of the above.
GBP/USD
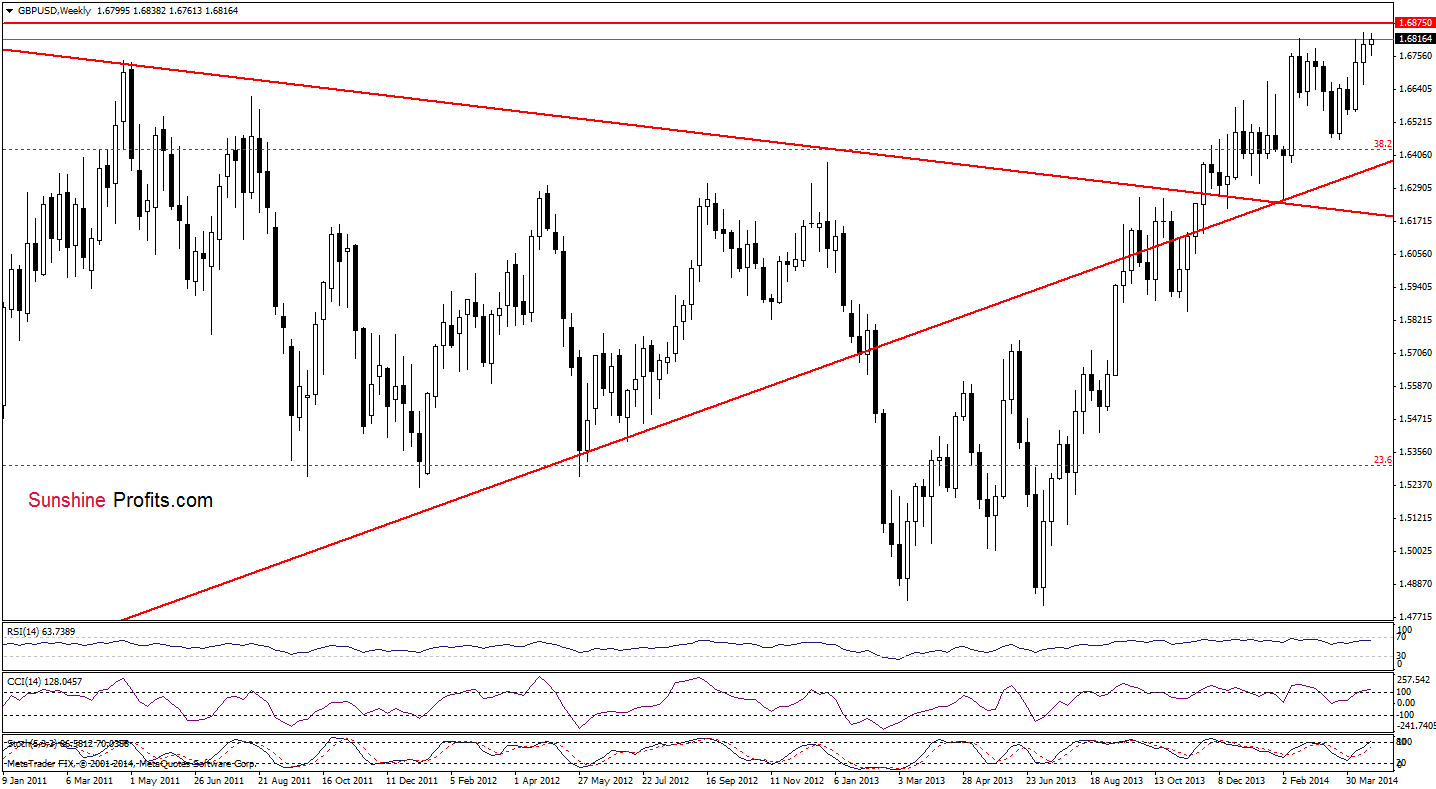
From the weekly perspective, the situation hasn’t changed much as GBP/USD still remains under the 2014 high and the strong resistance zone created by Aug. and Nov. 2009 highs, which may pause or even stop further improvement. Taking these facts into account, another attempt to move lower should not surprise us.
Let’s take a closer look at the daily chart.
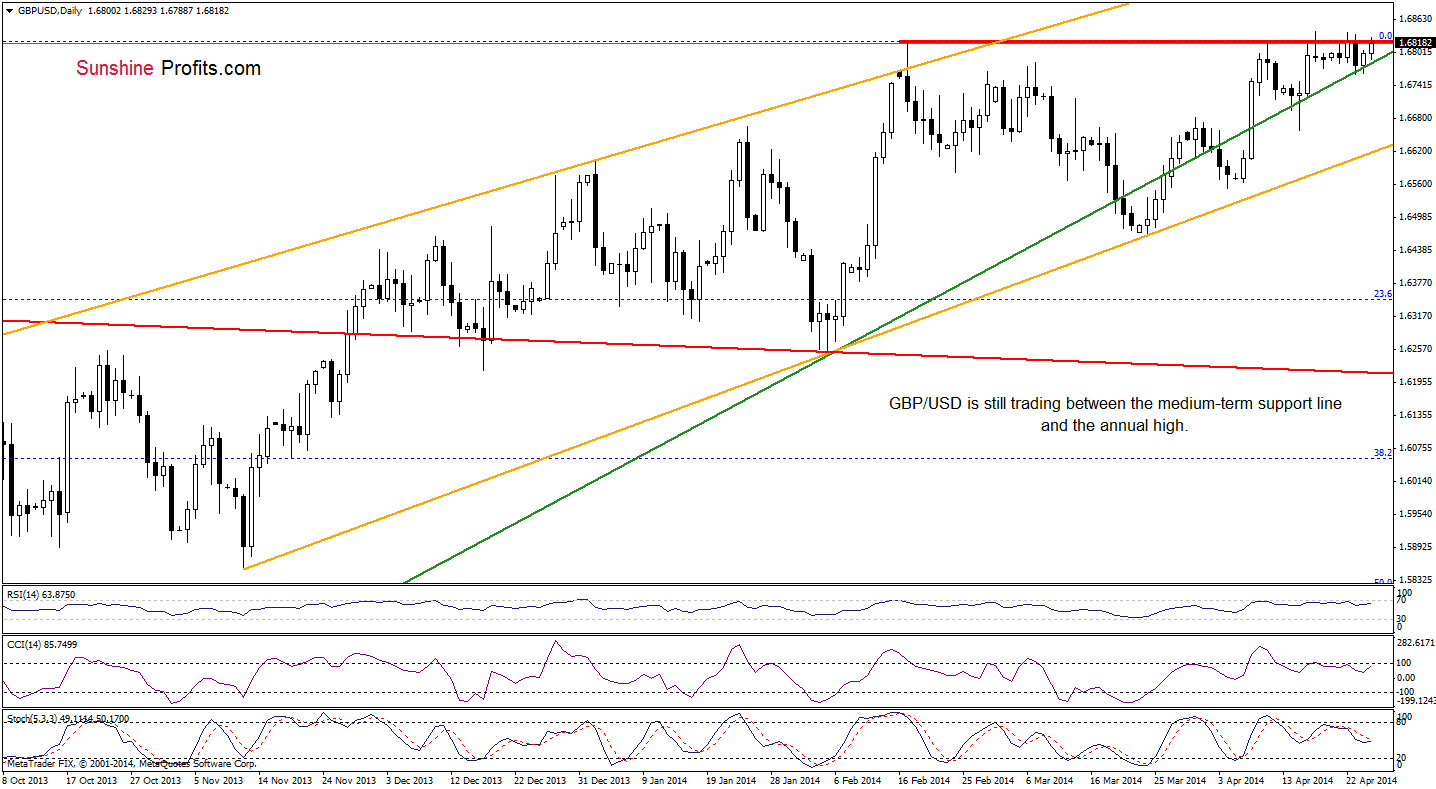
As you see on the above chart, the situation hasn’t changed much as GBP/USD remains between the green medium-term support line and the resistance level (created by the annual high). Taking into account the fact that the space between these two lines narrows, we will likely see a breakout above the 2014 high (or a breakdown below the major support line) in the nearest future, which will trigger another sizable move.
Please keep in mind that the strong resistance zone (discussed below the weekly chart) and the position of the daily indicators support sellers at the moment. Therefore, another attempt to move lower in the coming day (or days) should not surprise us.
Very short-term outlook: bearish
Short-term outlook: bearish
MT outlook: bearish
LT outlook: mixed
Trading position (short-term; our opinion): Short. Stop-loss order: 1.6855. Please note that if the pair moves above our stop-loss level, it seems that it will rally some more before heading south once again. If this is the case, we’ll consider re-opening short positions around the 2009 high. We will keep you informed should anything change, or should we see a confirmation/invalidation of the above.
USD/JPY
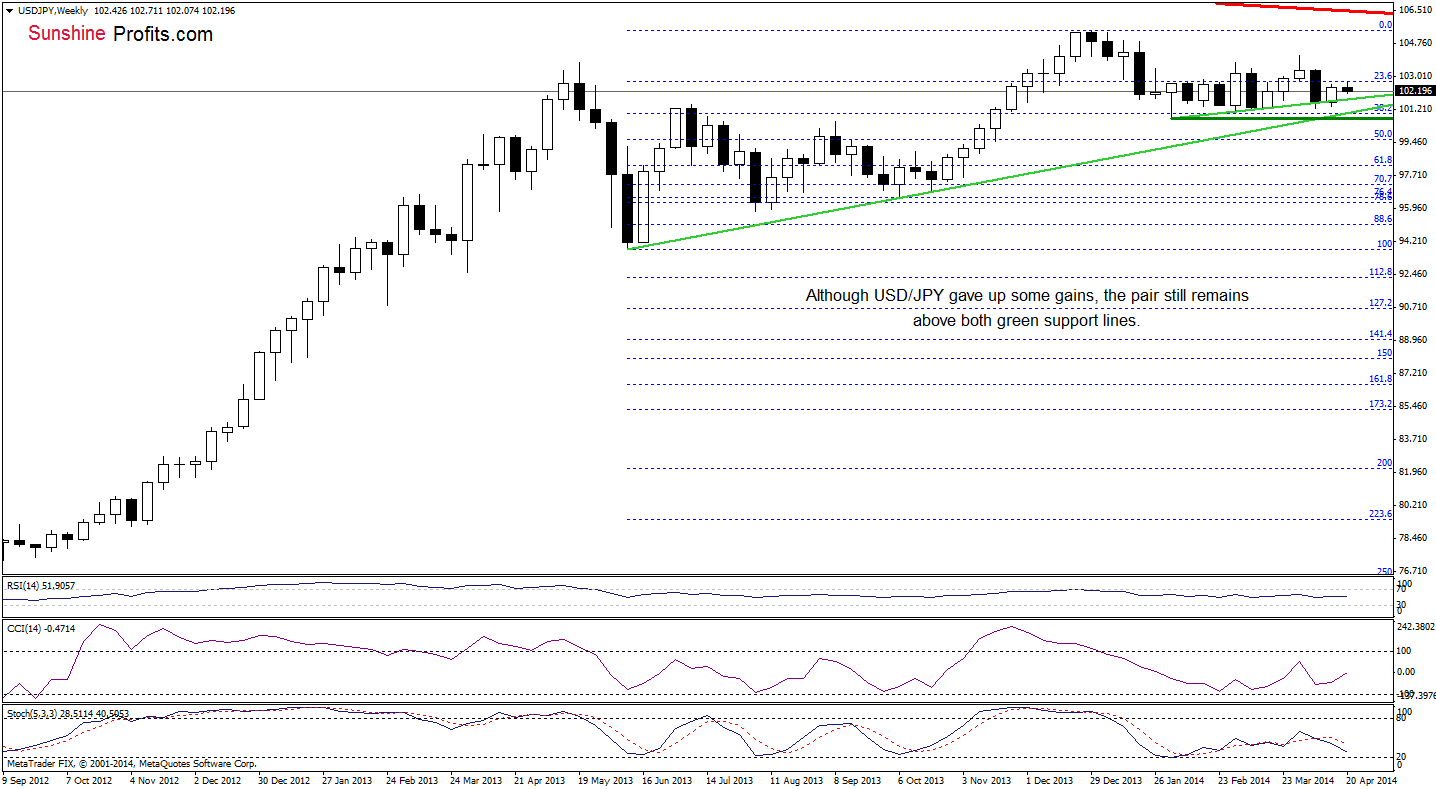
From the weekly perspective, we see that although USD/JPY gave up some gains, the overall situation hasn’t changed much as the exchange rate remains above both green support lines.
Let’s take a look at the daily chart.
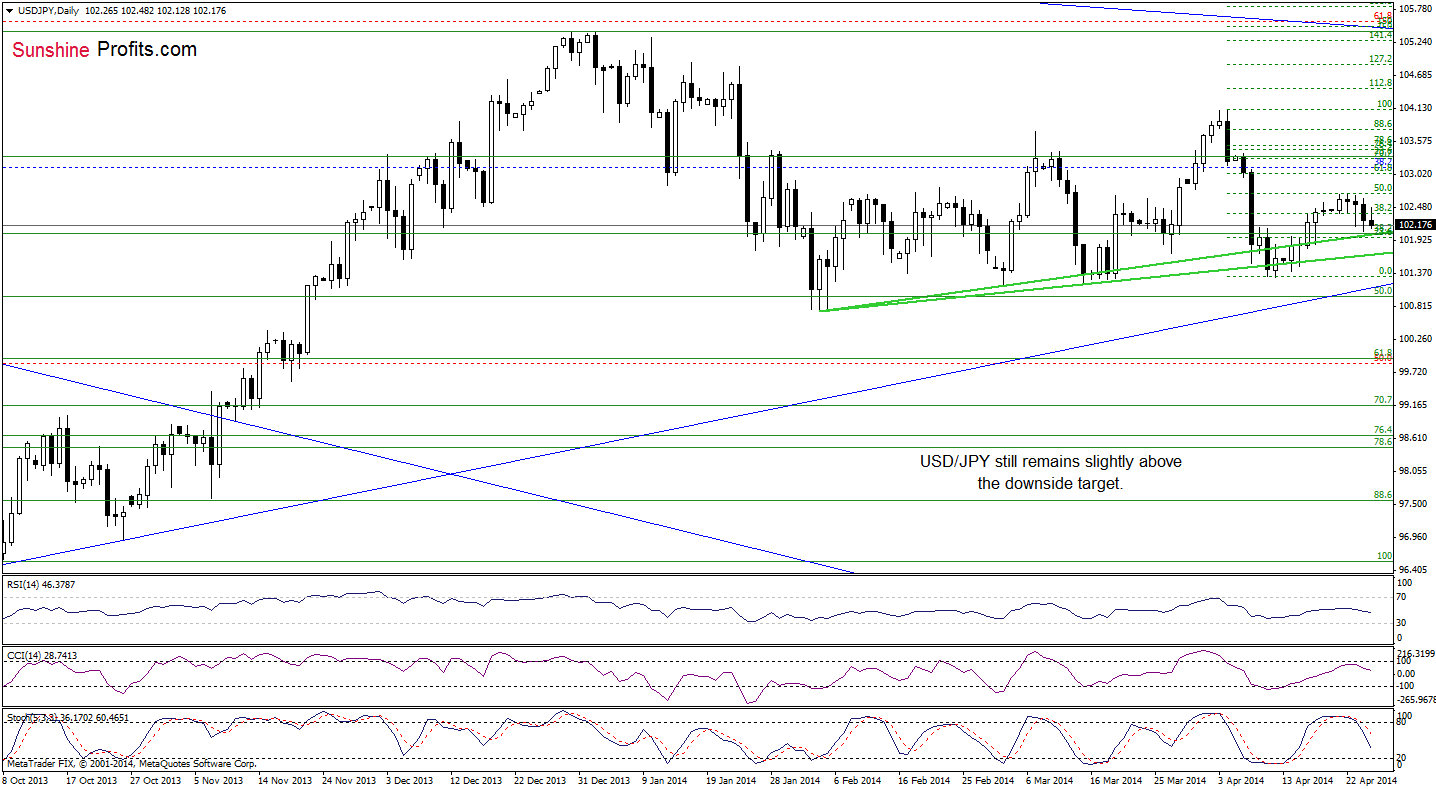
Looking at the above chart, we see that the situation hasn’t changed much as USD/JPY remains between yesterday’s high and low. Taking this fact into account, what we wrote in our last Forex Trading Alert is still up-to date.
(…) the pair extended losses and the sellers approached their downside target once again. On one hand, if this support line encourages buyers to act, we may see a corrective upswing to the recent highs. However, if it is broken, we will likely see a drop to the lower green line (currently around 101.68).
Please keep in mind that sell signals generated by the CCI and Stochastic Oscillator remains in place, which suggests that the sellers will likely realize this bearish scenario in the coming day (or days).
Very short-term outlook: bearish
Short-term outlook: mixed with bearish bias
MT outlook: bullish
LT outlook: bearish
Trading position (short-term): In our opinion no positions are justified from the risk/reward perspective at the moment. We will keep you informed should anything change, or should we see a confirmation/invalidation of the above.
USD/CAD
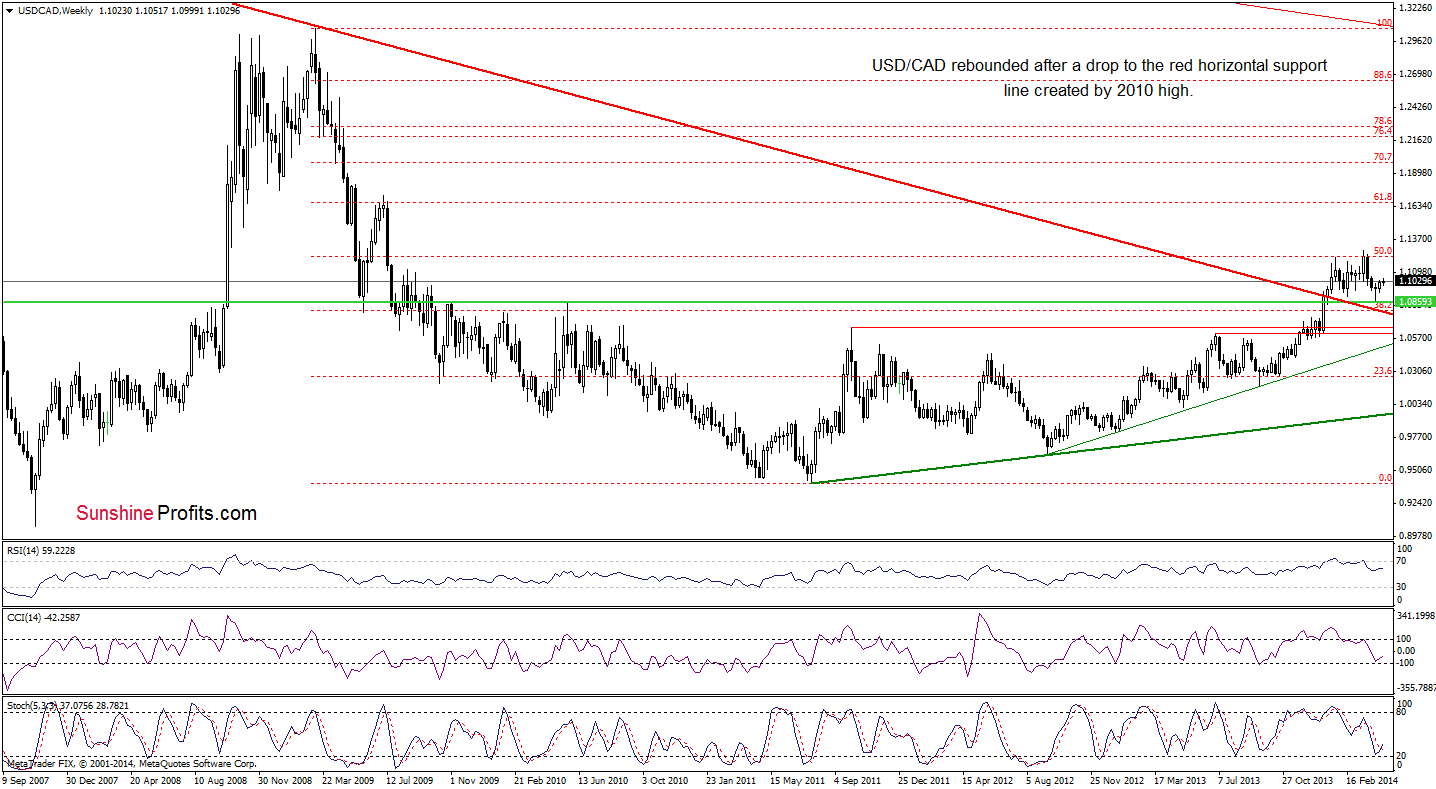
From the weekly perspective, we see that the situation in USD/CAD hasn’t changed. Therefore, what we wrote in our previous Forex Trading Alert is still valid.
(…) although the exchange rate declined in the previous weeks, it still remains above the previously-broken long term declining support/resistance line (marked with red). With this downward move, the pair declined to the horizontal green support line (created by the 2010 high) and rebounded. Nevertheless, the size of the corrective upswing is still quite small, which suggests that another attempt to move lower can’t be ruled out.
Let’s move on to the daily chart.
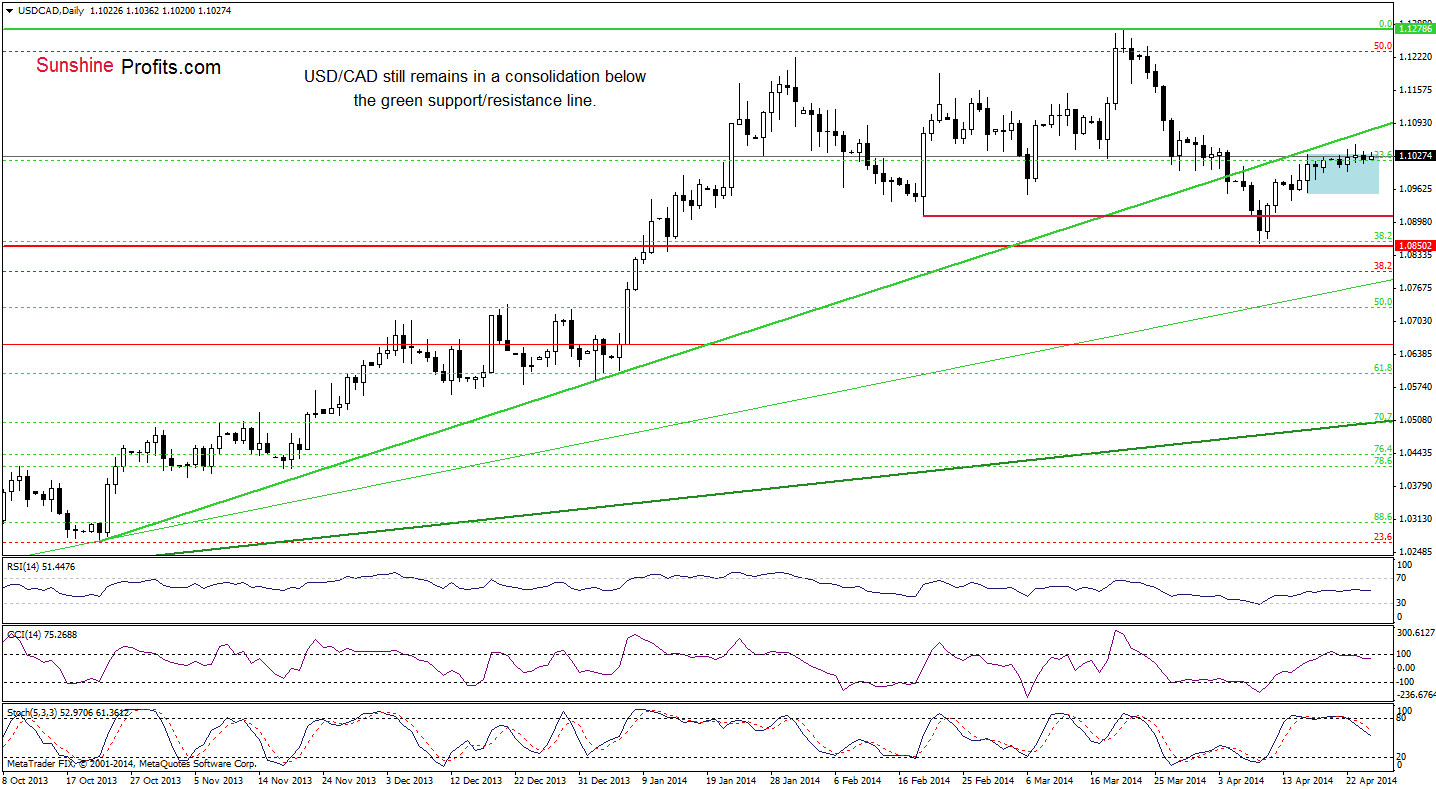
Looking at the above chart, we see that the situation hasn’t changed much as USD/CAD still remains in a consolidation between the Apr.16 high and low. Taking this fact into account, our last commentary is up-to-date.
(…) On one hand, if USD/CAD moves higher once again, we may see another attempt to break above the green resistance line. However, taking into account the current position of the indicators (the CCI and Stochastic Oscillator generated sell signals yesterday), it seems that a correction in the coming days should not surprise us. If this is the case, we will likely see a pullback to around 1.0982 (the April 17 low) or even to 1.0958, where the lower border of the consolidation is.
Very short-term outlook: mixed with bearish bias
Short-term outlook: mixed with bearish bias
MT outlook: bullish
LT outlook: bearish
Trading position (short-term): In our opinion no positions are justified from the risk/reward perspective. We will keep you informed should anything change, or should we see a confirmation/invalidation of the above.
USD/CHF
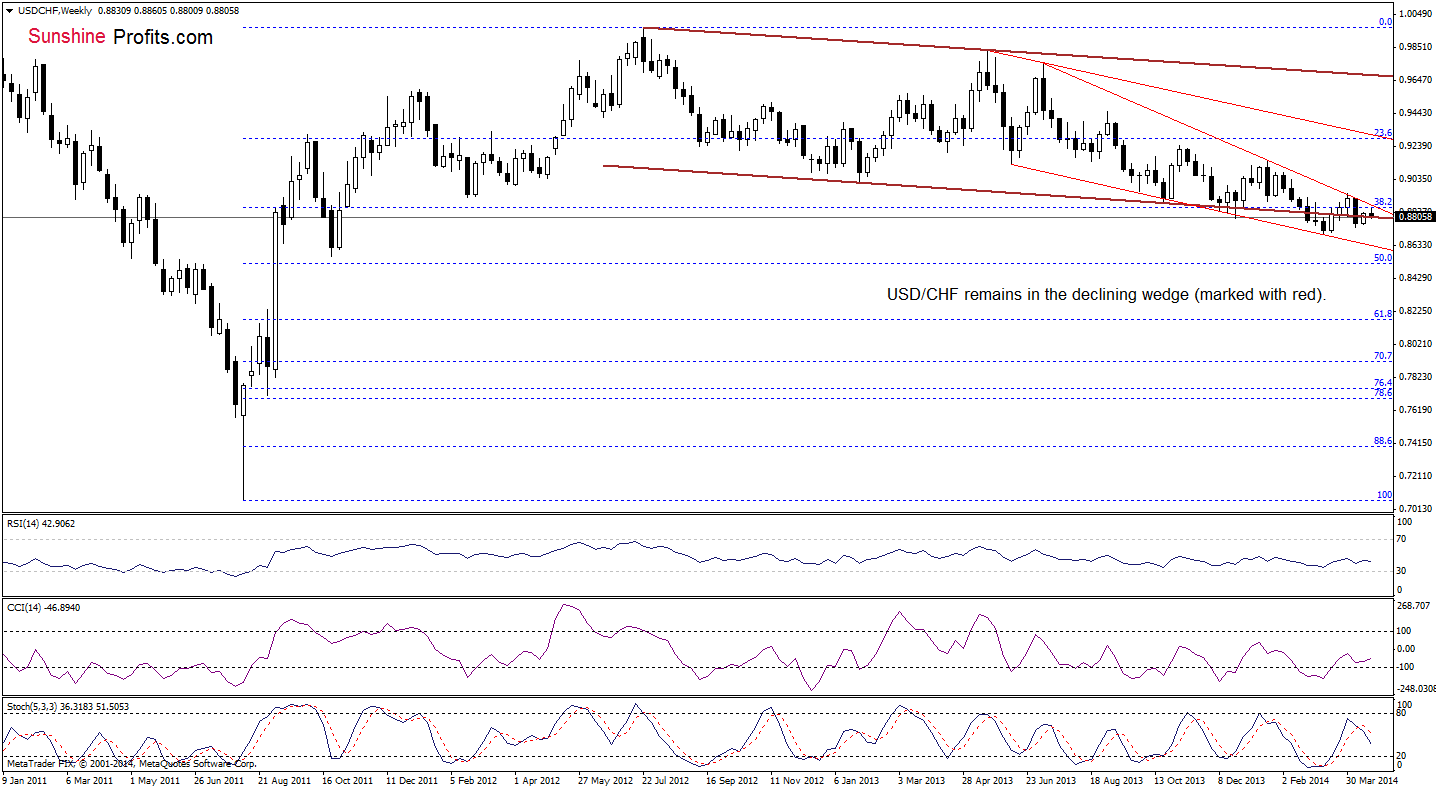
From this perspective, we see that the situation hasn’t changed much. Therefore, what we wrote in our previous Forex Trading Alert is still up-to-date.
(…) If the proximity to the upper border of the declining wedge encourages sellers to act, we may see further deterioration and a drop to the lower line of the declining trend channel (marked with brown) – currently around 0.8800.
Once we know the above, let’s take a closer look at the daily chart.
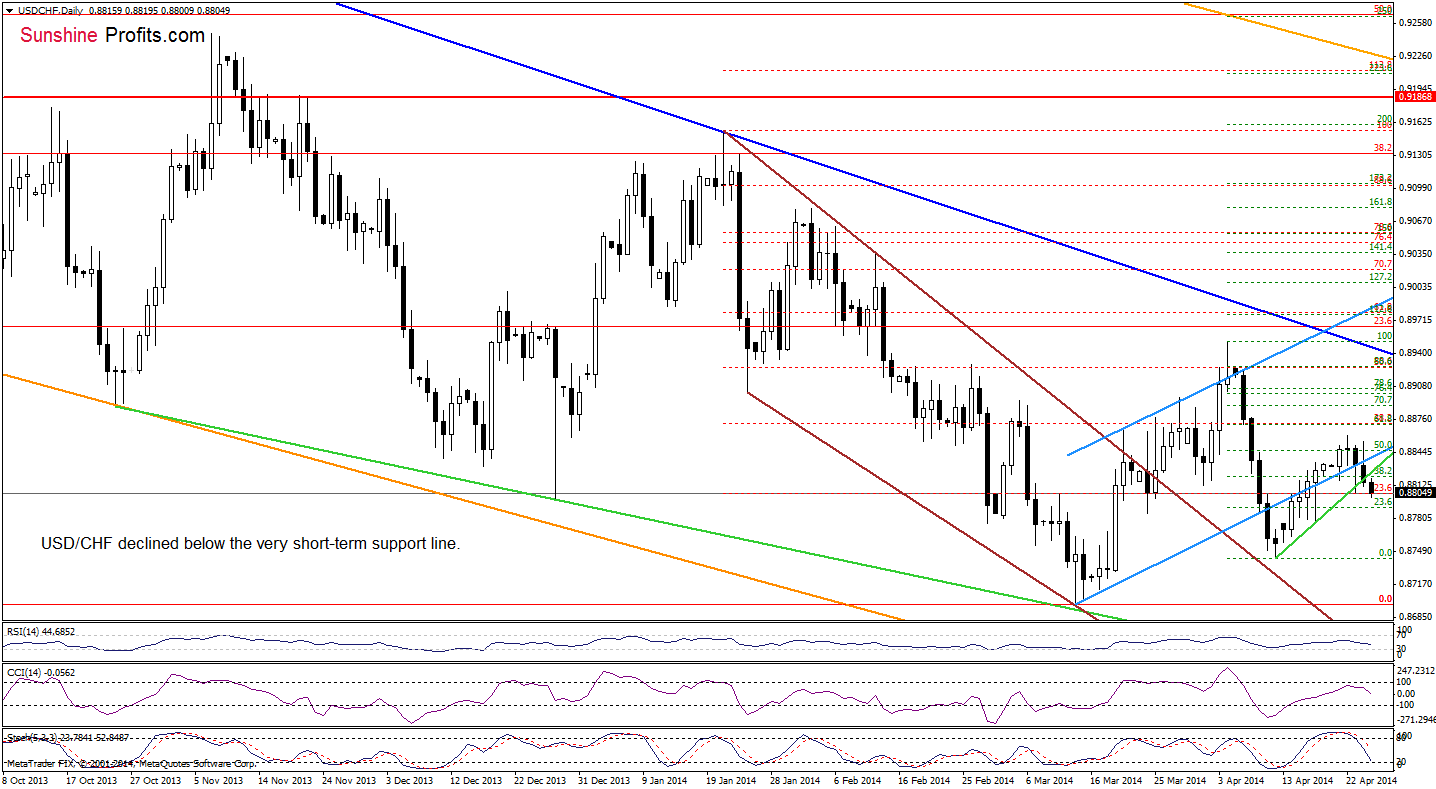
Quoting our previous Forex Trading Alert:
(…) taking into account sell signals generated by the CCI and Stochastic Oscillator, it seems that the sellers will likely try to push the pair lower in the near future. In this case, we may see a decline to the Apr.17 low or even to the monthly low of 0.8742.
As you see on the above chart, USD/CHF broke below the very short-term support line earlier today, which is a bearish signal. Taking this fact into account and combining it with the position of the indicators, we will likely see further deterioration in the coming day and a drop to one of the above-mentioned support levels.
Very short-term outlook: mixed
Short-term outlook: mixed
MT outlook: bearish
LT outlook: bearish
Trading position (short-term): In our opinion no positions are justified from the risk/reward perspective. We will keep you informed should anything change, or should we see a confirmation/invalidation of the above.
AUD/USD
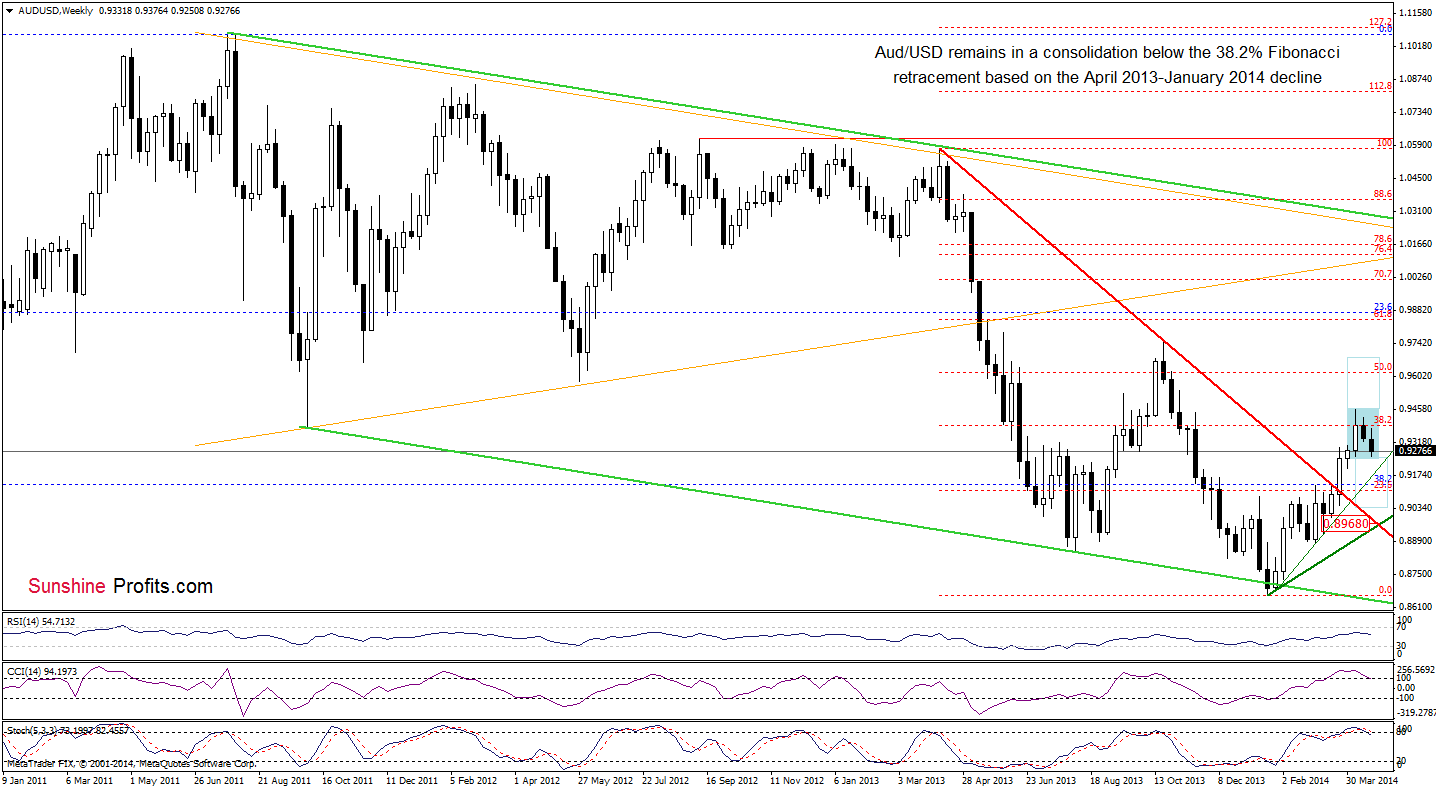
Looking at the weekly chart, we see that although AUD/USD rebounded slightly, the overall situation hasn’t changed much as the exchange rate still remains in the consolidation. As you see on the weekly chart, sell signals generated by the CCI and Stochastic Oscillator remain in place, supporting the bearish case. Therefore, another attempt to break below the lower border of the consolidation range can’t be ruled out.
Once we know the medium-term situation, let’s move on to the daily chart.
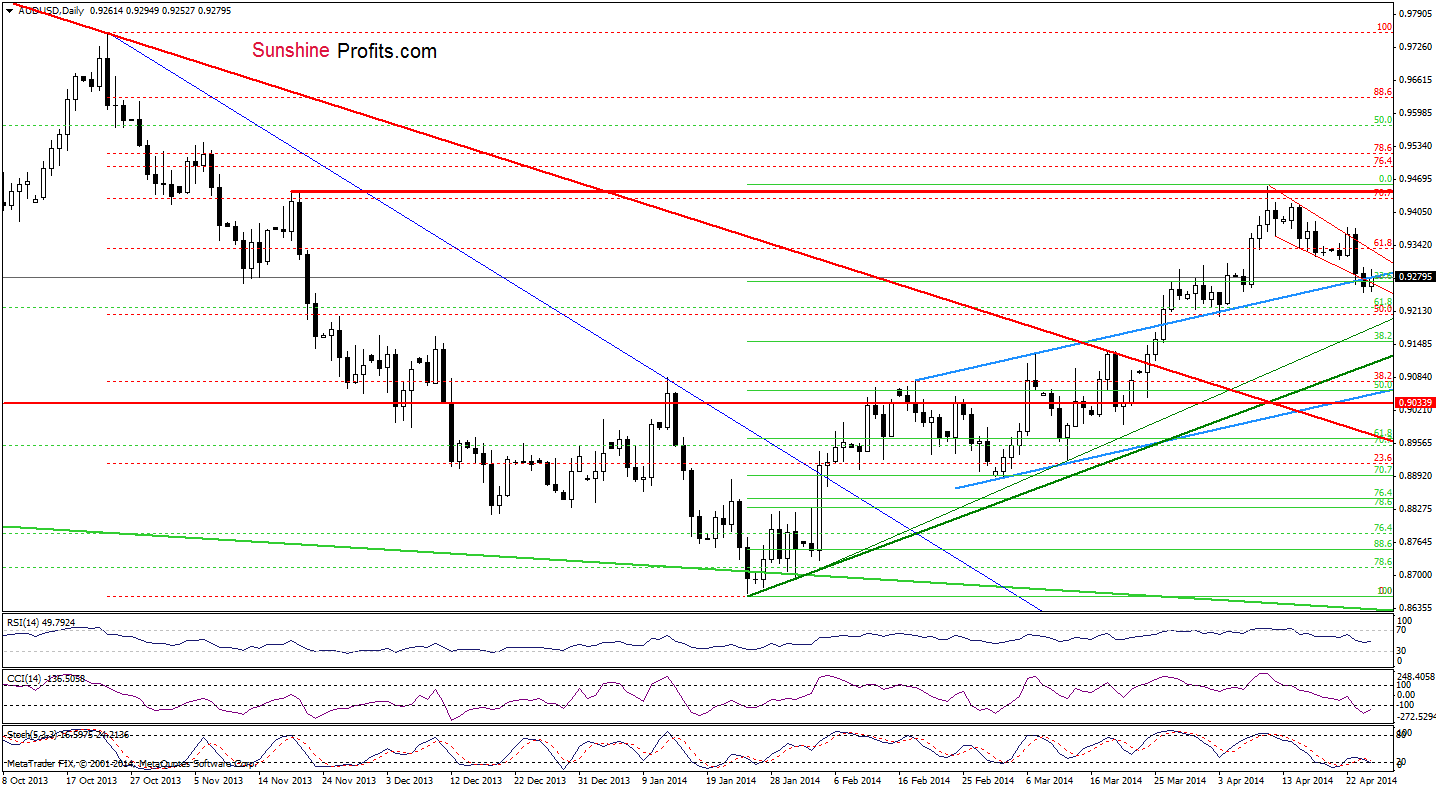
As you see on the above chart, AUD/USD rebounded and climbed above the lower declining red resistance line and the upper border of the blue rising trend channel. Despite the upswing, this improvement was only temporarily (at least at the moment when these words are written) and the exchange rate reversed. On one hand, if the buyers do not give up and push the pair above yesterday’s high, we may see an increase even to around 0.9335, where the upper line of the declining trend channel (marked with red) is. On the other hand, if AUD/USD declines below yesterday’s low, the next downside target will be around 0.9204, where the Apr.3 low is.
Very short-term outlook: bearish
Short-term outlook: bearish
MT outlook: bearish
LT outlook: bearish
Trading position (short-term): Short. Stop-loss order: 0.9410 and initial price target: the lower border of the blue rising trend channel (currently at 0.9060). We will keep you informed should anything change, or should we see a confirmation/invalidation of the above.
Thank you.
Nadia Simmons
Forex & Oil Trading Strategist
Przemyslaw Radomski, CFA
Founder, Editor-in-chief
Gold & Silver Trading Alerts
Forex Trading Alerts
Oil Investment Updates
Oil Trading Alerts
