
Forex Trading Alert originally sent to subscribers on April 3, 2014, 3:10 PM.
Earlier today, the U.S. currency moved higher against the euro as the European Central Bank left its benchmark interest rate unchanged (at a record-low 0.25%) and later ECB President Mario Draghi comments weighted on the common currency. What happened with other currency pairs? What is their current outlook? If you want to know our take on this question, we invite you to read our today's Forex Trading Alert.
In our opinion the following forex trading positions are justified - summary:
EUR/USD
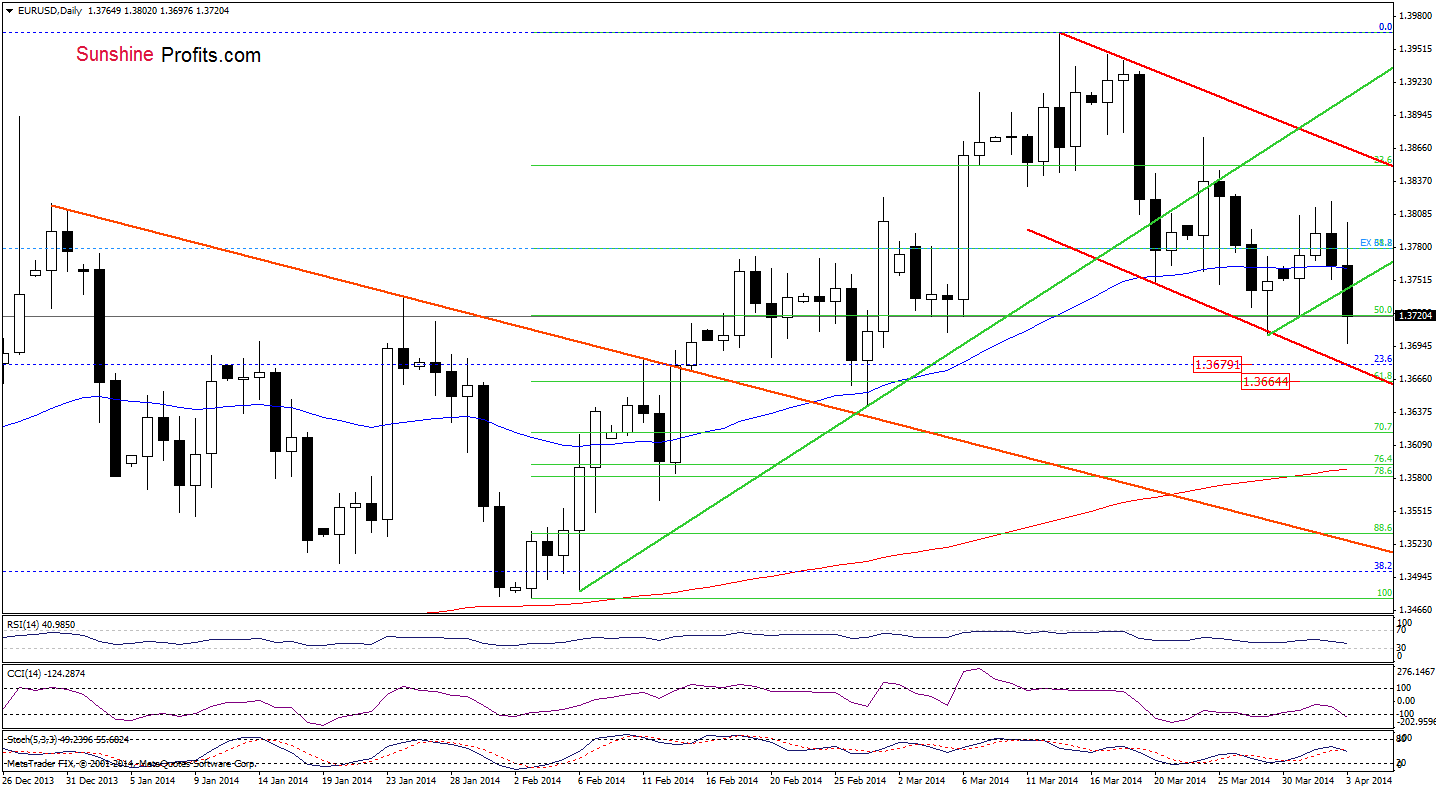
Although EUR/USD extended losses and hit a fresh monthly low of 1.3697, the pair rebounded and came back above the previous low. As you see on the daily chart, if the exchange rate declines once again, the first downside target for the sellers will be the lower border of the declining trend channel (marked with red), which corresponds to the 23.6% Fibonacci retracement based on the entire April 2013-March 2014 increase. Slightly below these levels is also the 61.8% Fibonacci retracement based on the recent rally, which together create a strong support zone.
Let’s zoom in on our picture and move on to the 4-hour chart.
Quoting our last Forex Trading Alert:
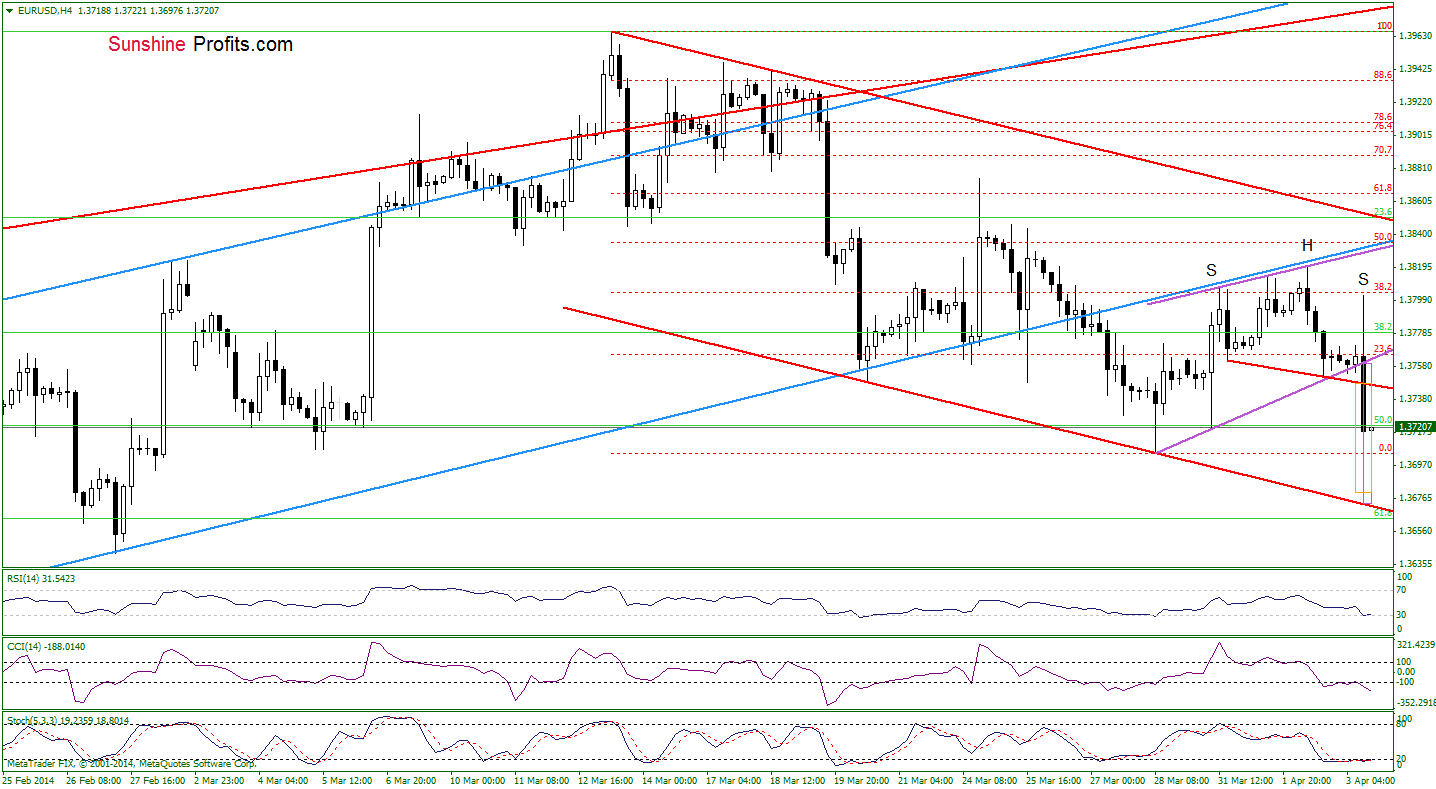
(…) the exchange rate approached the support line based on recent lows. If EUR/USD declines below this line, we will likely see a test of the strength of the 50% Fibonacci retracement level. If this support is broken, the next downside target will be the March 28 low. (…) If the sellers successfully push the exchange rate below the lower border of this formation (the rising trend channel marked with purple), we may see a drop even to the 61.8% Fibonacci retracement level (based on the entire February-March increase).
From this perspective, we see that the sellers pushed EUR/USD below the March 28 low and also the support line based on recent lows, which is a bearish signal. Additionally, we noticed a small head-and-shoulders pattern. According to theory, a drop below the neck level will likely trigger a decline to around 1.3681. Please not that slightly below this level is also the price target, which corresponds to the height of the purple trend channel. As you see on the above chart, this area is reinforced by the red declining support line (which stopped further deterioration in the previous moth), which suggests that the space for declines might be limited – especially when we factor in the current position of the indicators.
Very short-term outlook: bearish
Short-term outlook: mixed
MT outlook: mixed
LT outlook: bearish
Trading position: In our opinion no positions are justified from the risk/reward perspective. We will keep you informed should anything change, or should we see a confirmation/invalidation of the above.
GBP/USD
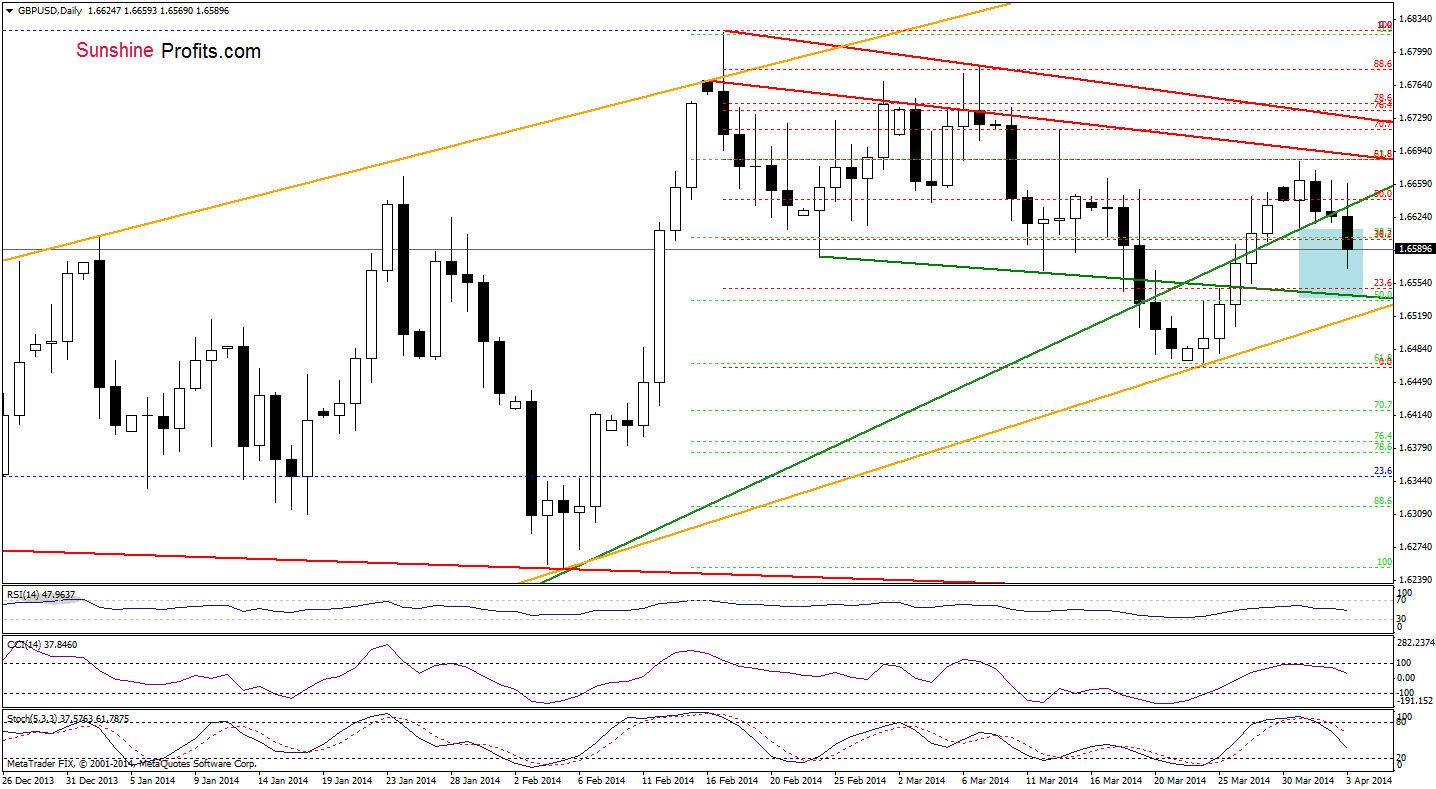
As you see on the daily chart, the situation has deteriorated as GBP/USD broke below the medium-term green support line, which is a negative signal. Taking into account the current position of the indicators (sell signals generated by the indicators remain in place), it seems that we will see further deterioration in the coming day (or days). If this is the case, the first downside target for the sellers will be the previously-broken green support line (currently around 1.6542).
Before we summarize this currency pair, let’s take a look at the 4-hour chart.
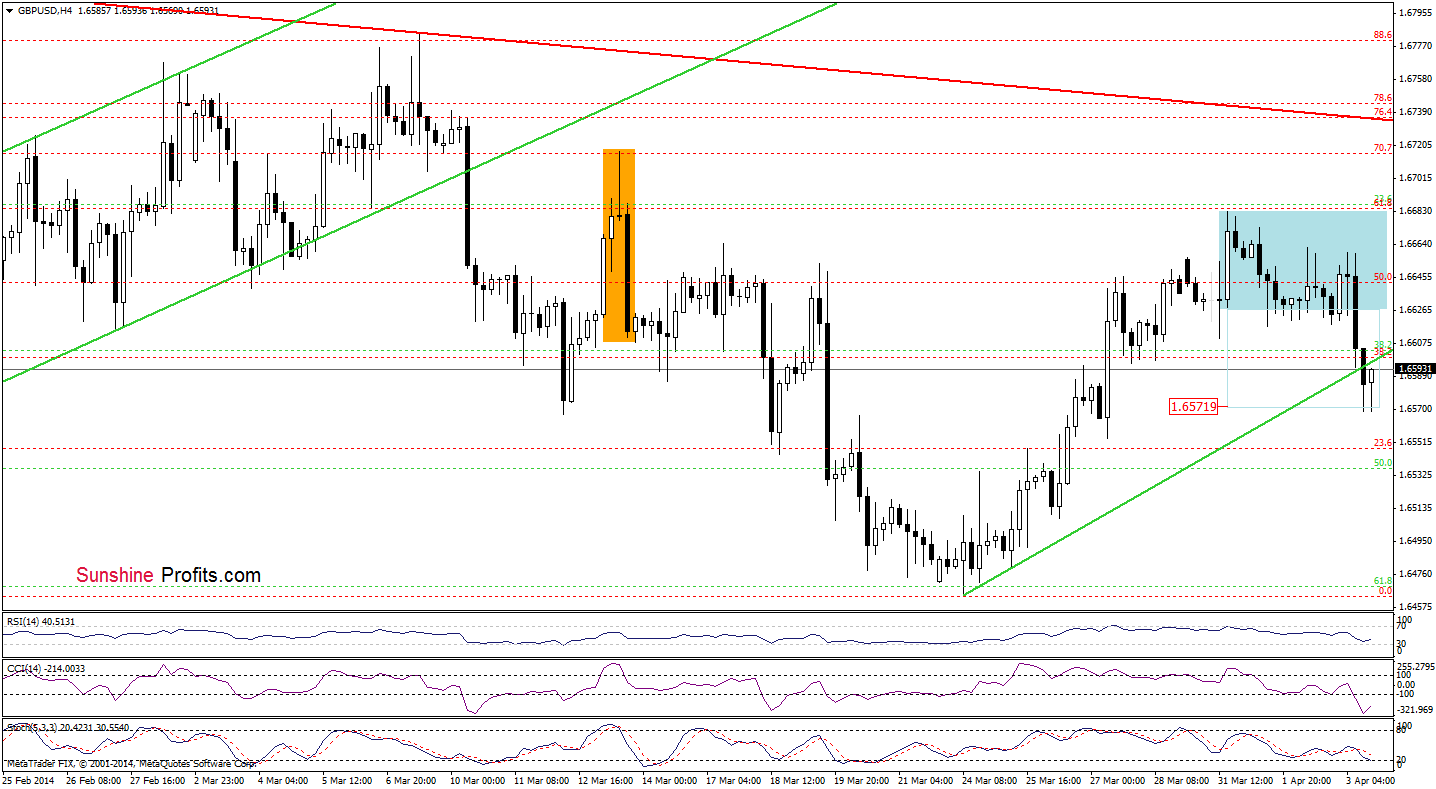
From this perspective, we see that the sellers successfully pushed GBP/USD below Monday’s low of 1.6611 and realized a bearish scenario after a breakdown below the lower border of the consolidation range. If the buyers manage to comeback above the very short-term rising line (which serves as resistance at the moment), we will likely see further improvement and an increase to the previously-broken Monday’s low. However, if they fail, we may see a drop to around 1.6548, where the 61.8% Fibonacci retracement based on the entire recent increase is (please note that this area is also reinforced by the green support line marked on the daily chart).
Very short-term outlook: bearish
Short-term outlook: mixed
MT outlook: mixed
LT outlook: mixed
Trading position (short-term): In our opinion no positions are justified from the risk/reward perspective at the moment. We will keep you informed should anything change, or should we see a confirmation/invalidation of the above.
USD/JPY
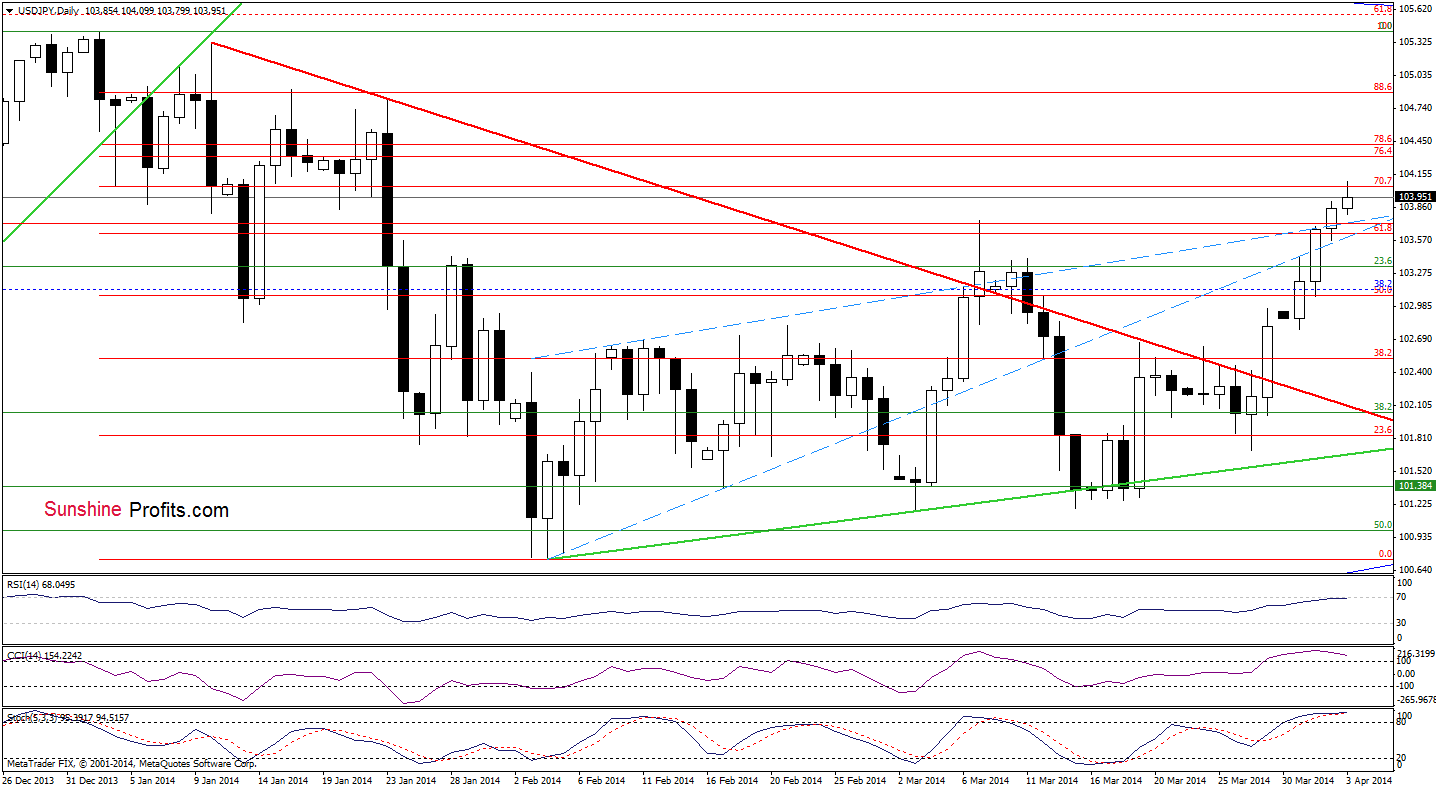
On the daily chart, we see that the pair extended gains and reached the 70.7% Fibonacci retracement (the next upside target). However, taking into account the fact that bodies of the recent candles are getting smaller (which suggests a decreasing power of buyers) and combining it with the current position of the indicators (the RSI approached the level of 70, while the CCI and Stochastic Oscillator are overbought), it seems that a correction is just around the corner – especially if the indicators generate sell signals.
Very short-term outlook: bullish
Short-term outlook: mixed
MT outlook: bullish
LT outlook: bearish
Trading position (short-term): In our opinion no positions are justified from the risk/reward perspective at the moment. We will keep you informed should anything change, or should we see a confirmation/invalidation of the above.
USD/CAD
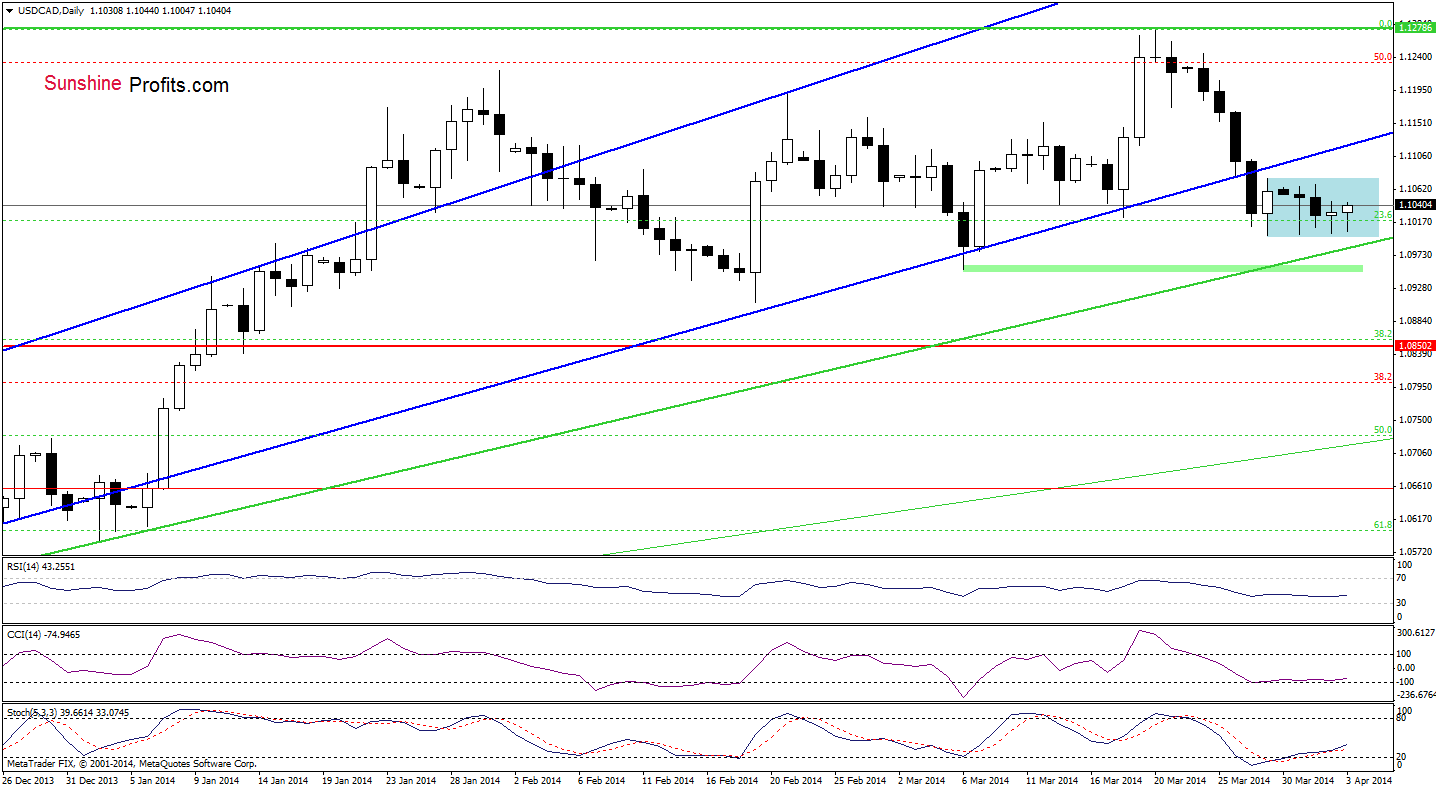
Looking at the above chart, we see that the situation hasn’t changed much as USD/CAD remains in a consolidation between Friday’s high and low. Therefore, what we wrote in our last Forex Trading Alert is still up-to-date.
(…) If the pair extends gains, we will likely see another attempt to reach the previously-broken lower border of the rising trend channel. Please note that even if the exchange rate drops below Friday’s low, the medium-term green support line will likely stop further deterioration. At this point, it’s worth noting that the CCI and Stochastic Oscillator generated buy signals, which reinforces a pro growth scenario.
Very short-term outlook: mixed with bullish bias
Short-term outlook: mixed
MT outlook: bullish
LT outlook: bearish
Trading position (short-term): In our opinion no positions are justified from the risk/reward perspective. We will keep you informed should anything change, or should we see a confirmation/invalidation of the above.
USD/CHF
Quoting our last Forex Trading Alert:
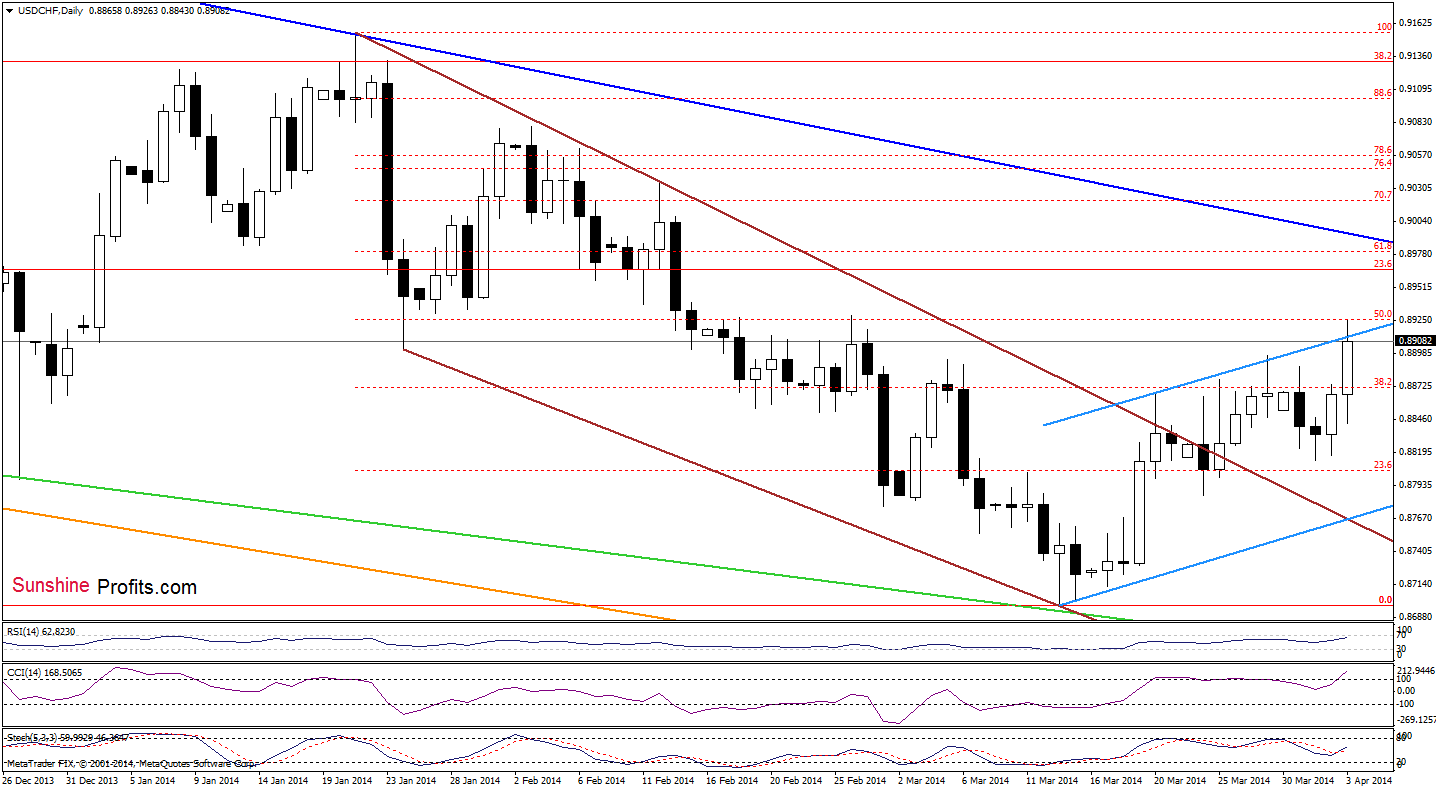
(…) USD/CHF (…) climbed to the 38.2% Fibonacci retracement once again. If this resistance level encourages sellers to act, we may see another pullback in the coming day (or days). However, if it is broken, we will likely see another attempt to move above 0.8894 and invalidate a negative impact of a bearish candlestick pattern on the exchange rate.
On the daily chart, we see that the buyers managed to push the exchange rate higher earlier today. With this upswing, the pair not only invalidated the bearish candlestick pattern, but also reached the 50% Fibonacci retracement and the upper line of the rising trend channel. If this resistance area holds, we may see a pullback in the coming day (or days) and a comeback to around yesterday’s low. However, if USD/CHF extends gains and moves higher, the next upside target for the buyers will be the 61.8% Fibonacci retracement, which together with the medium-term declining line (marked with blue) creates a strong resistance zone.
Very short-term outlook: mixed
Short-term outlook: mixed
MT outlook: bearish
LT outlook: bearish
Trading position (short-term): In our opinion no positions are justified from the risk/reward perspective. We will keep you informed should anything change, or should we see a confirmation/invalidation of the above.
AUD/USD
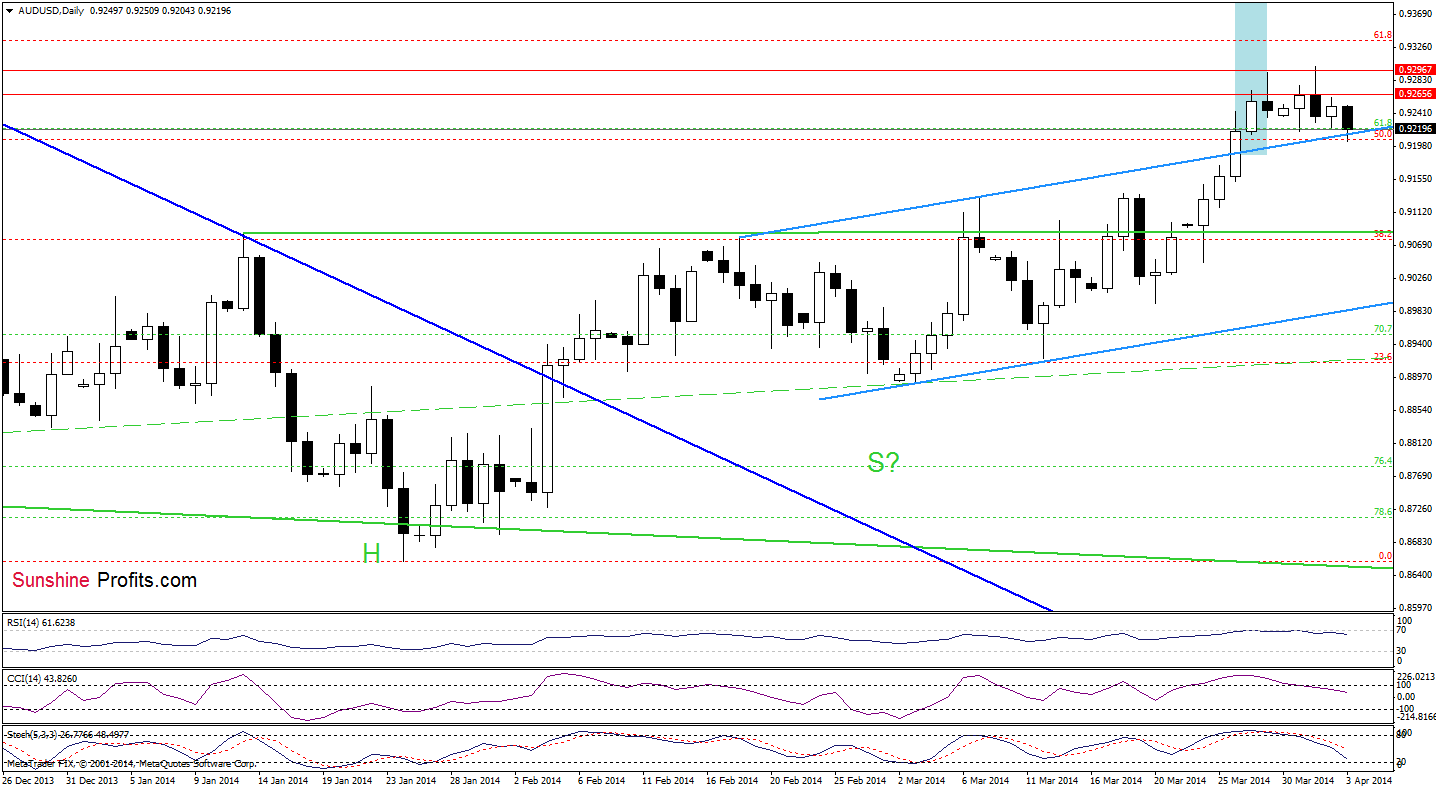
Looking at the above chart, we see that although AUD/USD declined earlier today, the overall situation hasn’t changed much as the exchange rate remains between a resistance zone created by lows from mid-November and the previously-broken upper line of the trend channel. Therefore, what we wrote in our previous Forex Trading Alert is up-to-date.
(…) as long as the pair remains in this narrow range, we won’t see a bigger upswing or downswing. Nevertheless, we should keep in mind that all sell signals remain in place, which suggests that we may see an attempt to move lower in the coming days. If this is the case, the first downside target will be around March 7 high (0.9132).
Very short-term outlook: mixed with bearish bias
Short-term outlook: bullish
MT outlook: bearish
LT outlook: bearish
Trading position (short-term; our opinion): In our opinion no positions are justified from the risk/reward perspective at the moment. However, if the pair drops below the upper line of the trend channel, we will consider opening short positions. We will keep you informed should anything change, or should we see a confirmation/invalidation of the above.
Thank you.
Nadia Simmons
Forex & Oil Trading Strategist
Forex Trading Alerts
Oil Investment Updates
Oil Trading Alerts
