
Forex Trading Alert originally sent to subscribers on March 3, 2014, 3:11 PM.
Earlier today, the U.S. dollar moved higher after positive economic data. The Commerce Department reported that personal spending rose 0.4% (above expectations for an increase of 0.1%) and personal income rose 0.3% (also above expectations for a 0.2% increase. Additionally, the core PCE price index rose 0.1% in line with expectations. What impact did it have on major currency pairs? If you want to know our take on this question, we invite you to read our today's Forex Trading Alert.
In our opinion the following forex trading positions are justified - summary:
EUR/USD
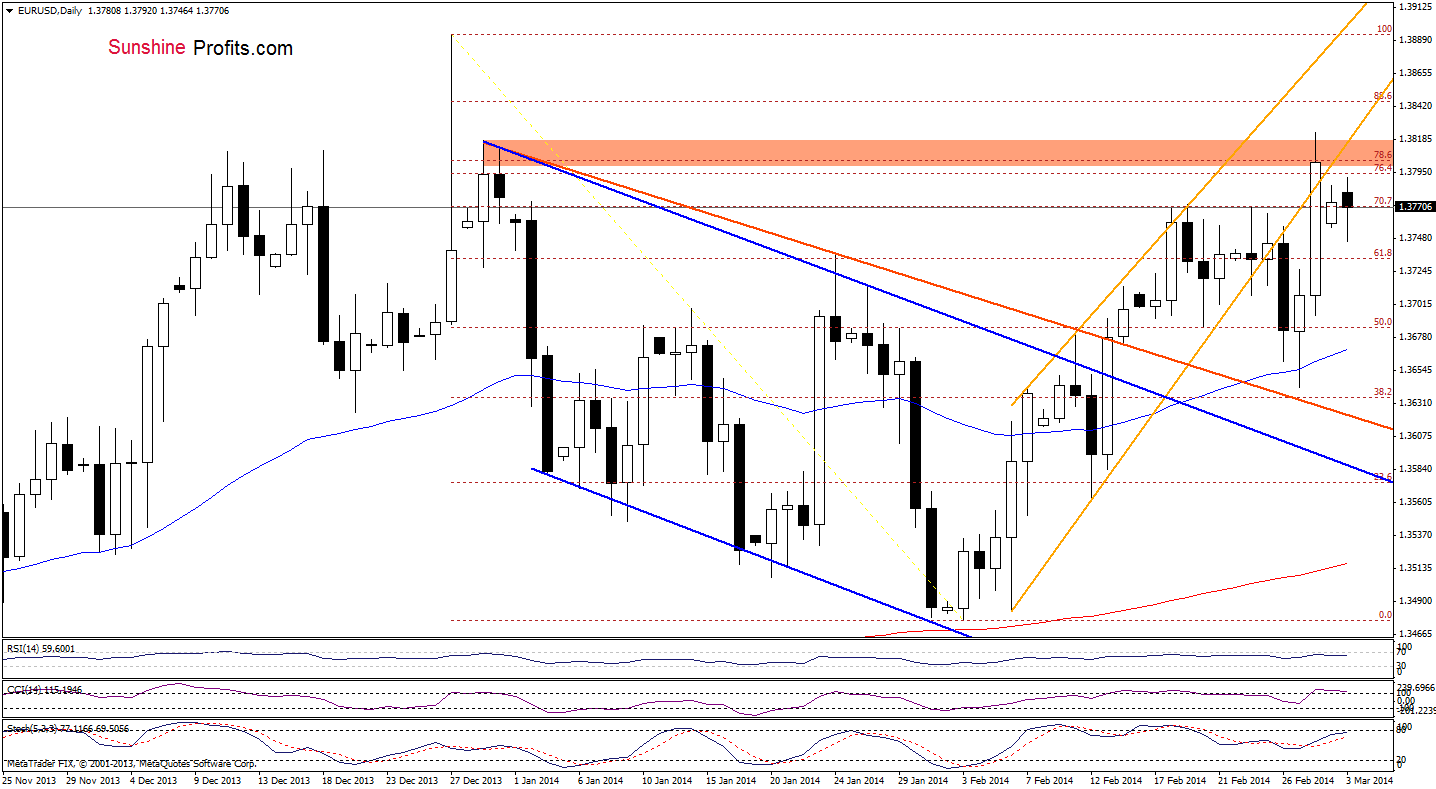
As you see on the daily chart, although EUR/USD broke above a strong resistance zone created by the 76.4% and 78.6% Fibonacci retracement levels based on the entire Dec.-Feb. decline (additionally this area is reinforced by the Dec.30 high), the pair gave up the gains and declined below it earlier today. With this downswing, the exchange rate also dropped below the previously-broken lower border of the rising trend channel. From this perspective, it seems that if the pair do not manage to come back above these levels, we will likely see further deterioration and the downside target will be around Friday low.
Very short-term outlook: mixed
Short-term outlook: bullish
MT outlook: mixed
LT outlook: bearish
Trading position (short-term): In our opinion no positions are justified from the risk/reward perspective. We will keep you informed should anything change, or should we see a confirmation/invalidation of the above.
GBP/USD
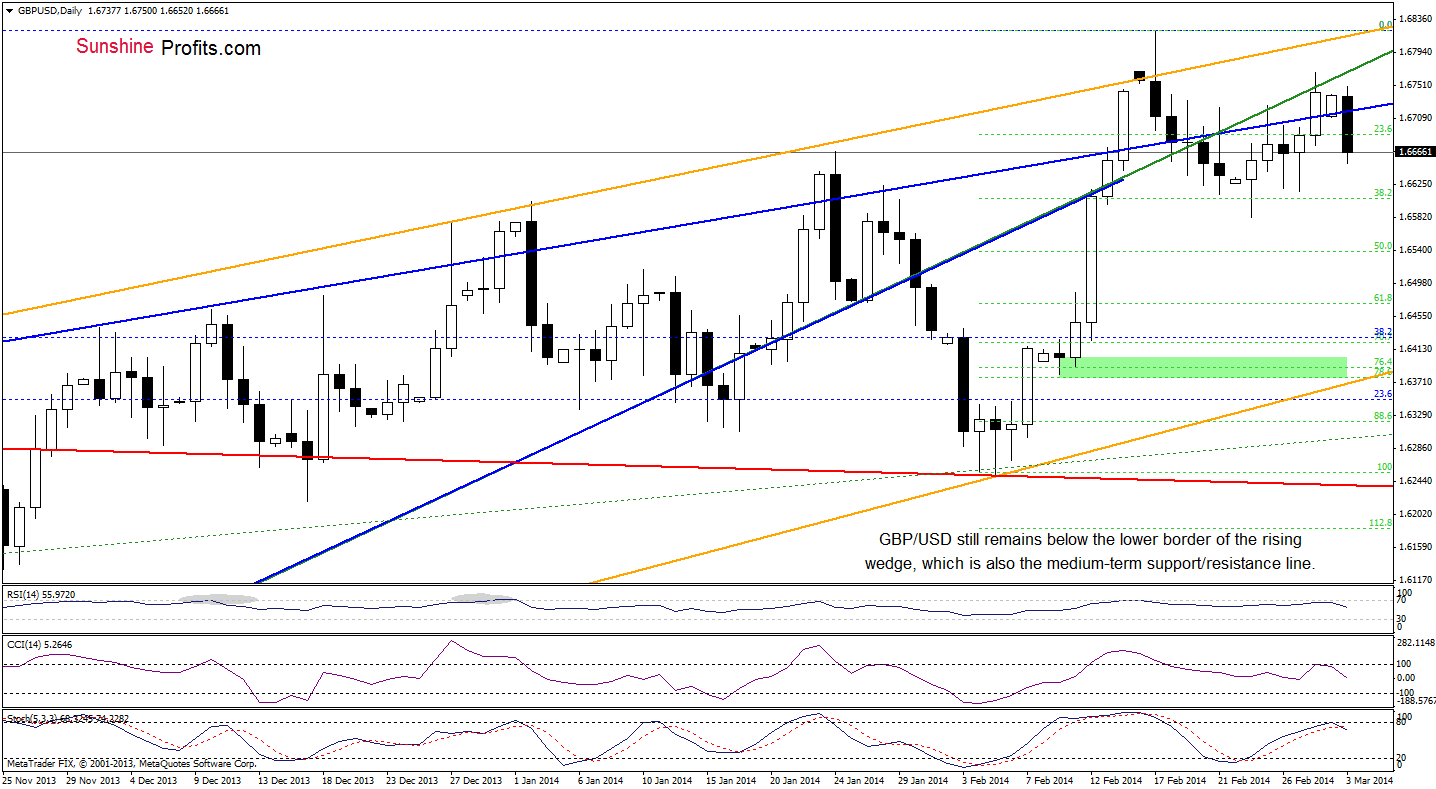
Looking at the above chart, we see that the situation has deteriorated slightly as GBP/USD declined below the upper line of the rising wedge. Taking this fact into account, we will likely see another attempt to reach the 38.2% Fibonacci retracement level. This scenario is currently reinforced by the position of the indicators – they all declined generating sell signals, which supports sellers at the moment.
Before we summarize this currency pair, let’s take a closer look at the 4-hour chart.
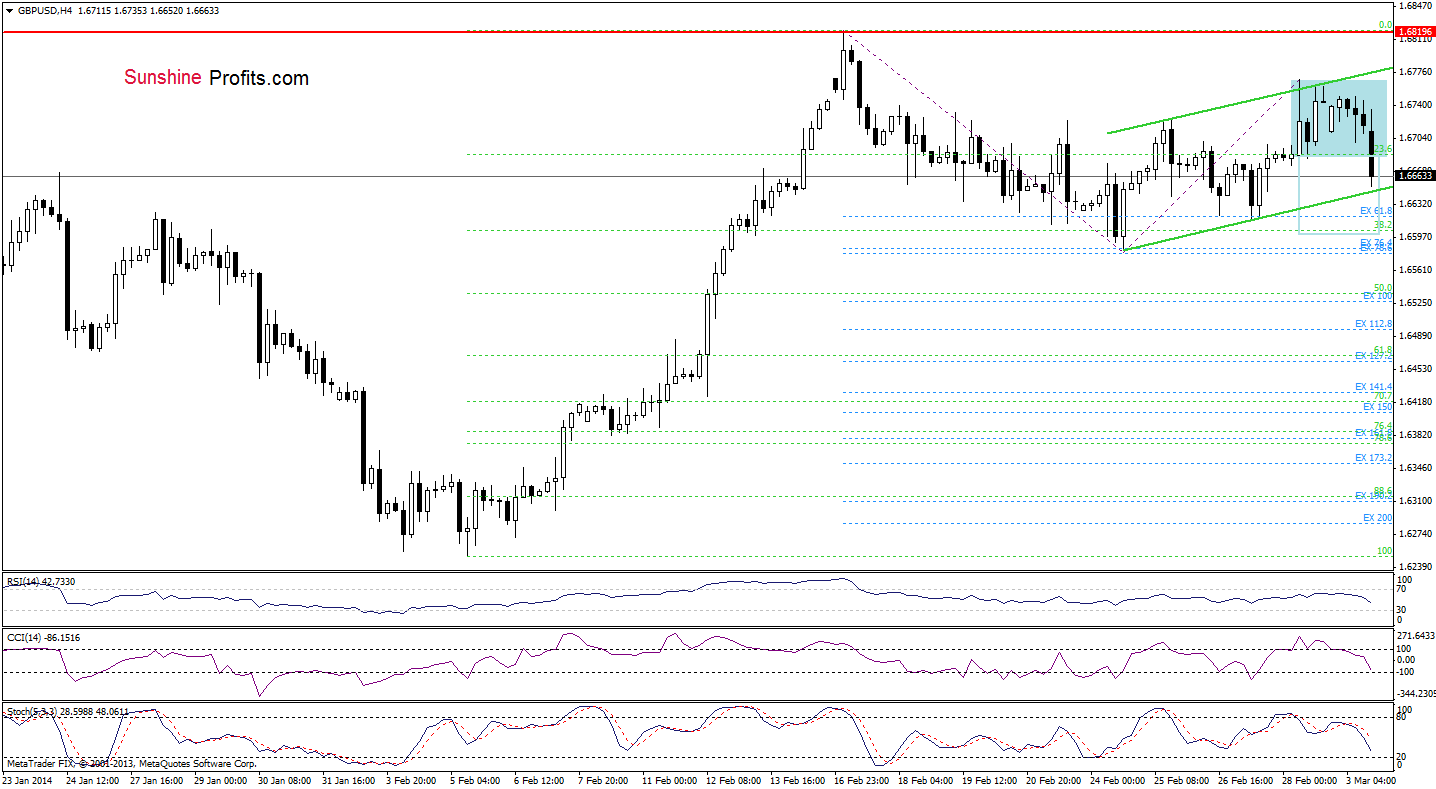
From this perspective, we see that GBP/USD broke below the lower border of a consolidation range (marked with blue), which suggests that we will likely see further deterioration in the following hours – especially if the exchange rate drops below the rising green support line (which is also a lower border of a small rising channel). This scenario is currently reinforced by sell signals generated by all three indicators (the RSI, CCI and Stochastic Oscillator).
Very short-term outlook: mixed
Short-term outlook: mixed
MT outlook: mixed
LT outlook: mixed
Trading position (short-term): In our opinion no positions are justified from the risk/reward perspective at the moment as the current situation is unclear. We will keep you informed should anything change, or should we see a confirmation/invalidation of the above.
USD/JPY
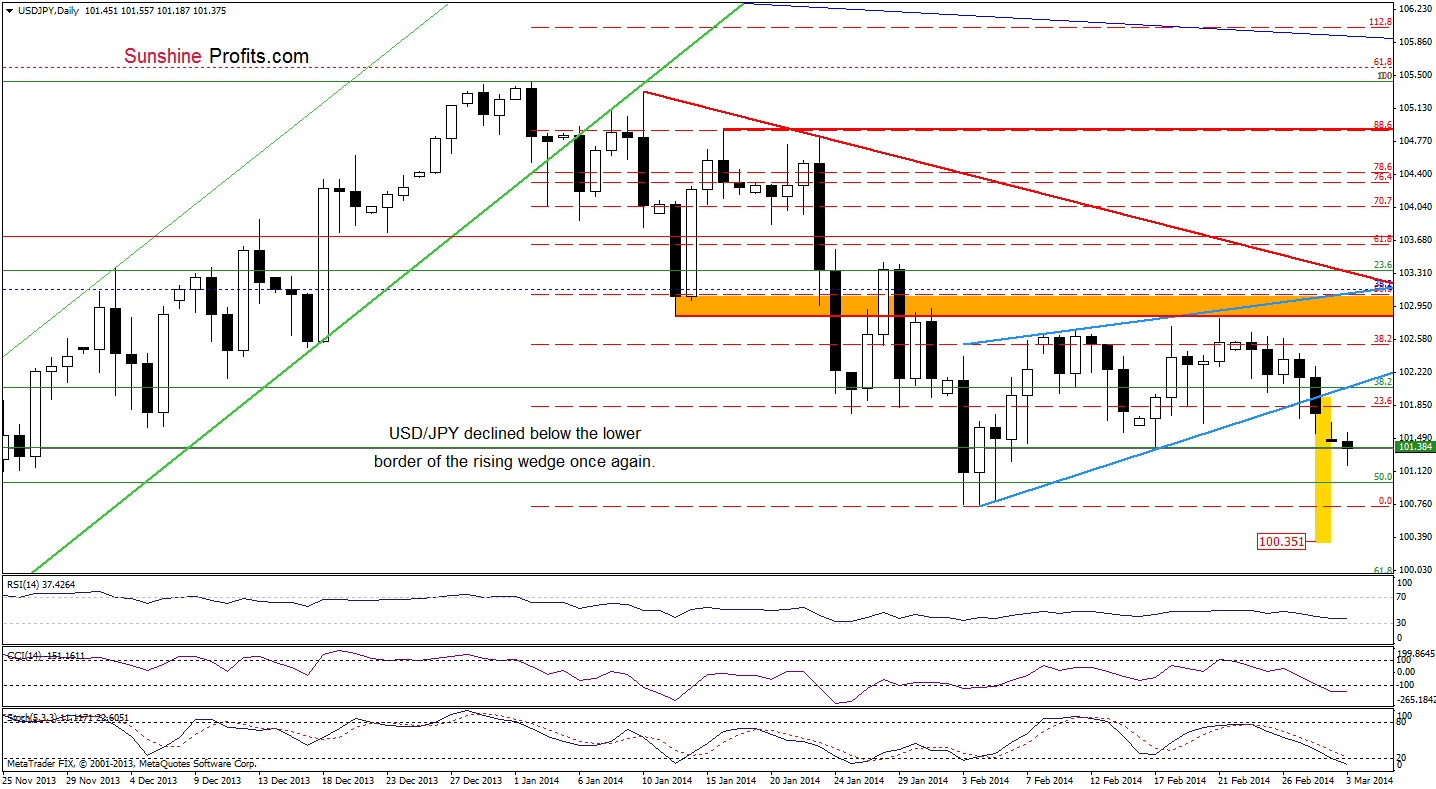
On Friday, USD/JPY closed the day below the lower border of the rising wedge (marked with light blue), which triggered further deterioration earlier today. Therefore, what we wrote in our previous Forex Trading Alert is up-to-date.
(…) if the sellers successfully push the pair below the very short-term support line (the lower border of the rising wedge), we will probably see a re-test of the strength of the February low (as a reminder, the price target after a breakdown is a bit lower than the monthly low and we marked it with a yellow rectangle). Looking at the position of the indicators, we see that sell signals remain in place supporting further deterioration.
Very short-term outlook: mixed with bearish bias
Short-term outlook: mixed with bearish bias
MT outlook: bullish
LT outlook: bearish
Trading position (short-term): In our opinion, the situation is too unclear to go short or long at the moment. So, no positions are justified from the risk/reward perspective. We will keep you informed should anything change, or should we see a confirmation/invalidation of the above.
USD/CAD
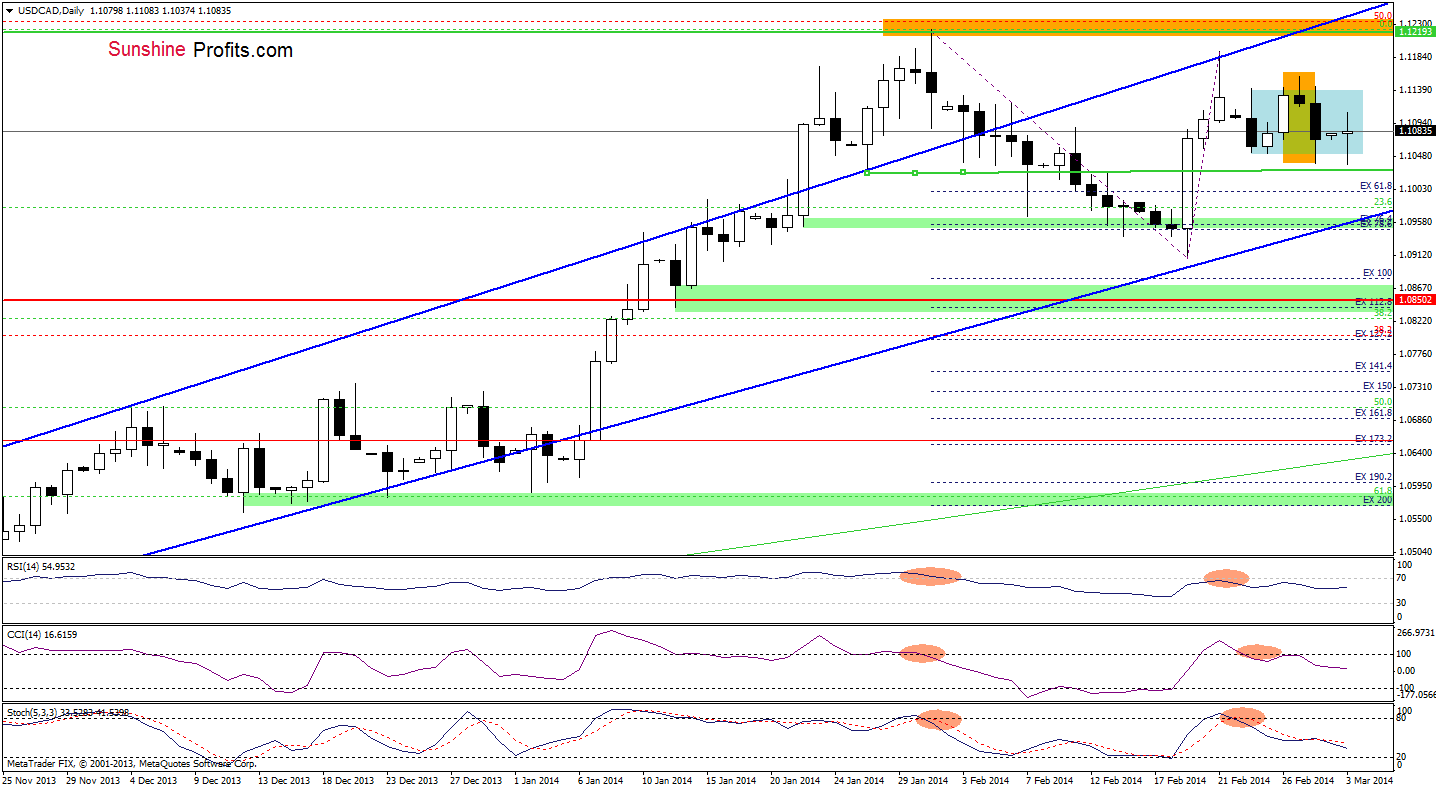
As you see on the daily chart, there were two attempts to move lower, but the sellers failed and USD/CAD came back to the consolidation range. From this perspective, the overall situation hasn’t changed much and is still a bit unclear as the pair remains between Friday high and low. Nevertheless, we should keep in mind that the last three candles from the previous week created a bearish evening star candlestick pattern (marked with an orange rectangle), which together with the current position of the indicators supports sellers at the moment. Taking these facts into account, it seems that if the exchange rate closes the day below the Feb.24 low, we may see further deterioration and a drop to the lower border of the rising trend channel, which corresponds to a support zone created by Jan.22, Feb.7 and Feb13 lows. However, if the buyers do not give up and invalidate the reversal candlestick formation (a daily close above 1.1158), we may see an upward move even to the January high.
On Friday we wrote the following:
(…) we will start including the 4-hour charts next week. There were many trading opportunities that turned out to be profitable (in hindsight) that we didn't take as they seemed too short-term oriented. It seems that the currency markets at this time provide much better risk/reward ratio for these shorter-term trades than what we have been featuring so far and we want you to help you take advantage of it.
Generally, today’s 4-hour charts for the 6 currency pairs that we follow didn’t generate any signals, but since we promised to start providing you with these charts, we will include one of them. If there are more signals, we will naturally include more of them. As always, we would love to hear from you about this improvement in the service.
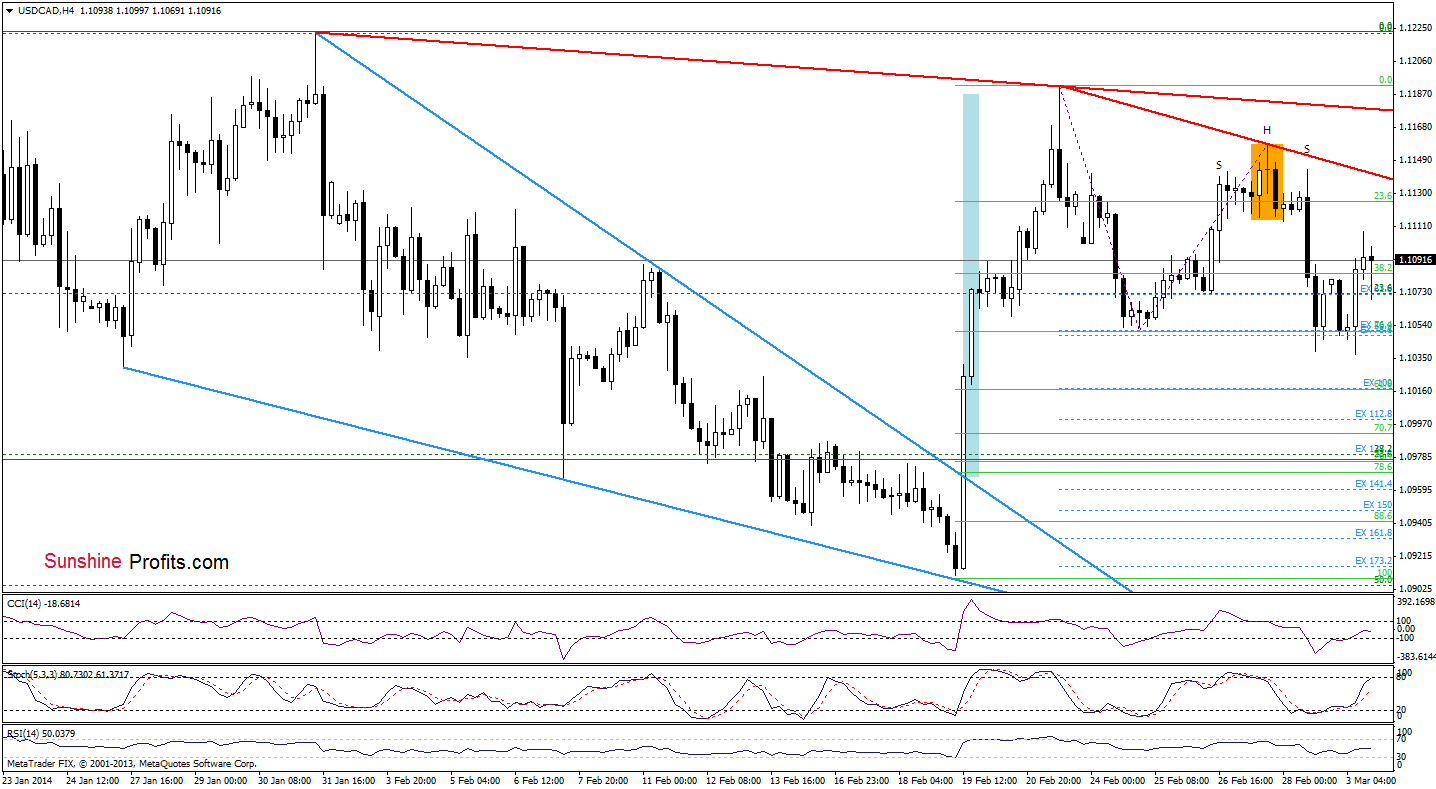
From this perspective, we see that there was a small head and shoulders pattern, which triggered a decline on Friday. As you see on the above chart, the sellers without a problem realized their bearish scenario and pushed the pair to the 50% Fibonacci retracement level (based on the recent rally) once again. Earlier today, this support level encouraged buyers to act and the exchange rate rebounded. Despite this growth, USD/CAD didn’t even reach the neck line of the bearish formation and still remains below two resistance lines marked with red (additionally, the lower line is currently reinforced by a bearish candlestick pattern - an evening star), which suggests that we may see another attempt to move lower in the nearest future (especially if the Stochastic Oscillator generate a sell signal).
Very short-term outlook: mixed
Short-term outlook: mixed
MT outlook: bullish
LT outlook: bearish
Trading position (short-term): In our opinion no positions are justified from the risk/reward perspective. We will keep you informed should anything change, or should we see a confirmation/invalidation of the above.
USD/CHF
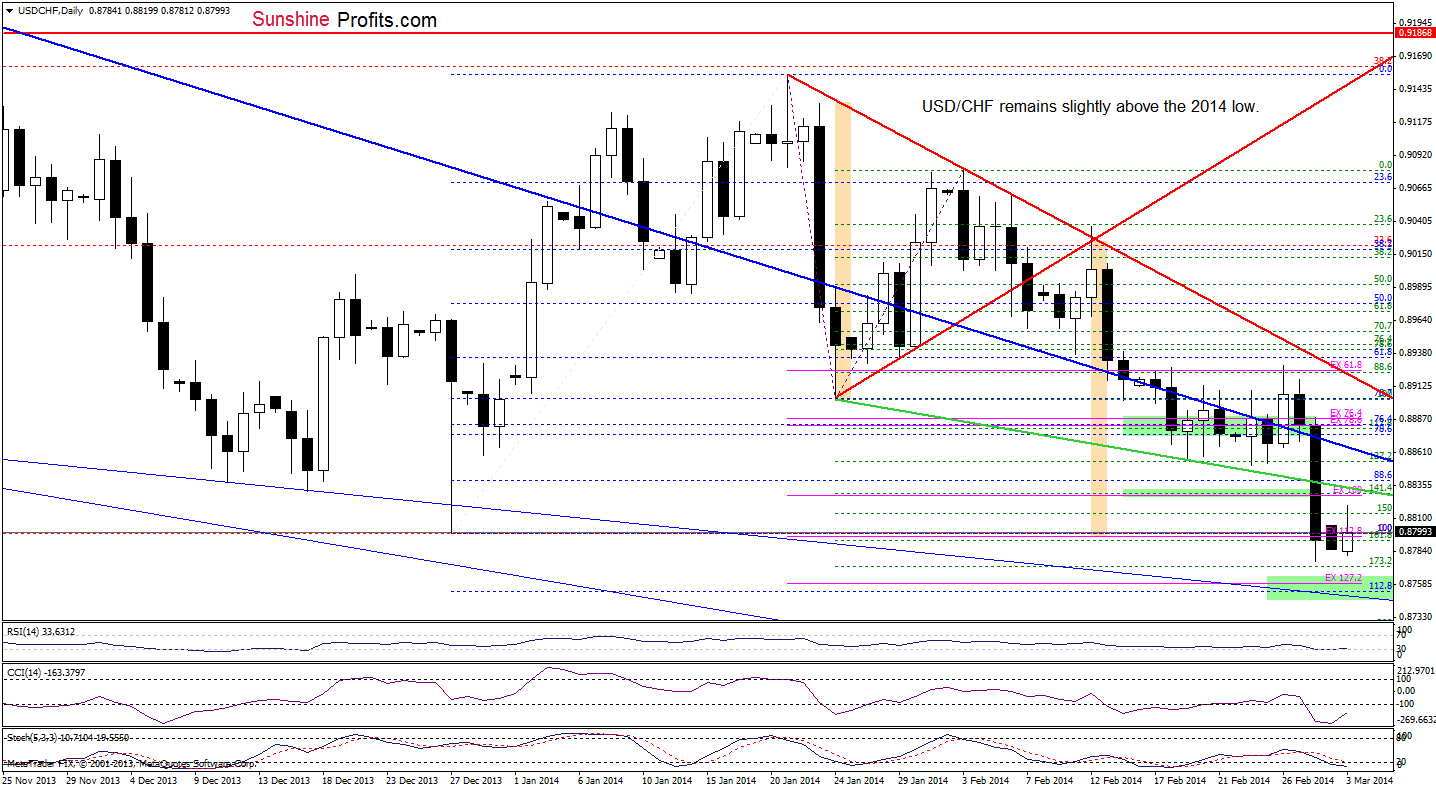
Looking at the above chart, we see that the situation hasn’t changed much as USD/CHF still remains between the 2014 low and the declining resistance line (marked in green). Therefore, what we wrote in our previous Forex Trading Alert is still up-to-date.
(…) the exchange rate reached not only the next support zone (…), but also hit a fresh 27-month low (…) the sellers realized a bearish scenario after a breakdown below the lower border of the triangle (marked with light orange). If this area encourages buyers to act, we may see a corrective upswing in the coming day (or days). However, if they do not push the pair above the declining resistance line (marked in green) in the near future, it seems that we may see further deterioration. In this case, the downside target will be around 0.8755, where the next declining support line intersects with the 112.8% Fibonacci extension level and the 127.2% Fibonacci projection.
Very short-term outlook: bearish
Short-term outlook: bearish
MT outlook: bearish
LT outlook: bearish
Trading position (short-term): In our opinion, the situation is too unclear to go long or short at the moment. We will keep you informed should anything change, or should we see a confirmation/invalidation of the above.
AUD/USD
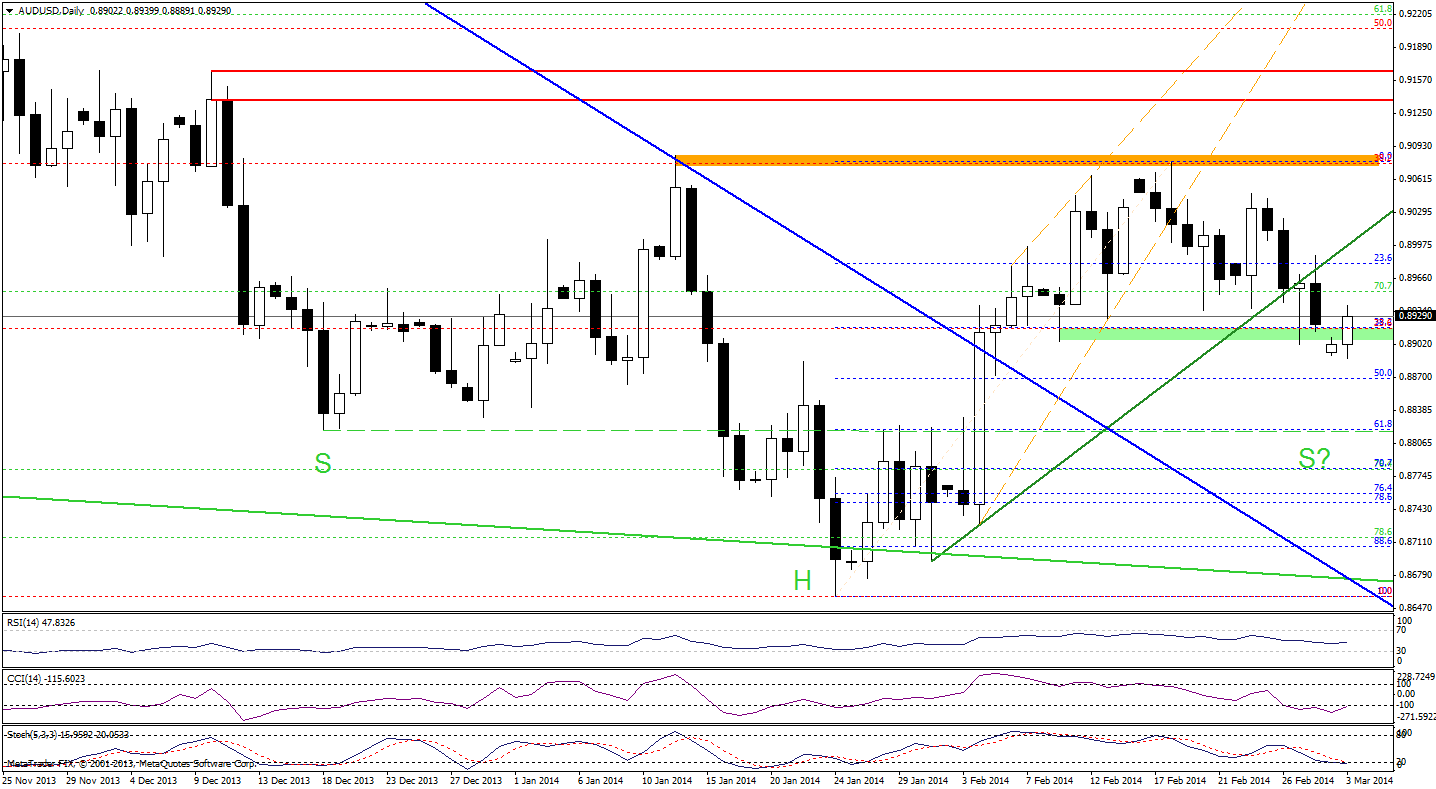
On the above chart, we see that although AUD/USD extended losses and dropped below a support zone (created by the Feb.10 low and the 38.2% Fibonacci retracement level), buyers didn’t give up and triggered a corrective upswing, which took the pair above these important levels. An invalidation of a breakout is a bullish signal, which suggests that we may further improvement (especially when we take into account the fact that the CCI and Stochastic Oscillator are very close to generating buy signals). If this is the case, we will likely see an upswing to the previously broken the very short-term rising support/resistance line (marked with green). Nevertheless, we should keep in mind that as long as the pair remains below this line, another attempt to move lower can’t be ruled out.
Very short-term outlook: mixed
Short-term outlook: mixed
MT outlook: bearish
LT outlook: bearish
Trading position (short-term): In our opinion no positions are justified from the risk/reward perspective. We will keep you informed should anything change, or should we see a confirmation/invalidation of the above.
Thank you.
Nadia Simmons
Forex & Oil Trading Strategist
Forex Trading Alerts
Oil Investment Updates
Oil Trading Alerts
