
Based on the November 29th, 2013 Premium Update. Visit our archives for more gold articles.
In our essay on precious metals from Nov. 22, we focused on the markets from the long-term perspective. As we wrote in the summary:
(…) the final bottom for the decline in gold, silver and mining stocks doesn't seem to be in just yet.
On the next trading day, after the essay was posted, gold, silver and mining stocks declined and dropped to their fresh monthly lows. Although we’ve seens some improvement in recent days, precious metals still have been trading in the narrow range.
Many times in the past, the situation in the U.S. dollar and the euro gave us important clues about future precious metals’ moves. Therefore, today we’ll examine the US Dollar Index (from many perspectives) and the Euro Index to see if there’s anything on the horizon that could drive the precious metal market higher or lower in the near future. We’ll start with the long-term USD Index chart (charts courtesy by http://stockcharts.com).

From the long-term perspective, the situation hasn’t changed much recently. The long-term breakout above the declining long-term support line has not been invalidated. Additionally, the USD Index reversed right in the middle of our target area. Therefore, from this perspective, it seems that the downward move – if it’s not already over – will be quite limited because the long-term support line will likely stop any further declines.
Now, let’s examine the weekly chart.
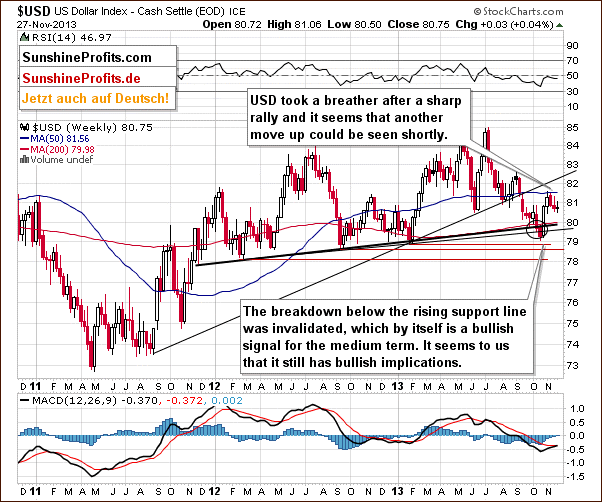
Looking at the above chart, we see that at the beginning of the month the USD Index reached the 50-day moving average, which triggered a corrective move in the following weeks. With this downward move the U.S. dollar dropped to the low that we had seen three weeks ago, therefore, we might see a post-double-bottom rally in the coming weeks.
Keep in mind that from this point of view the current correction is still shallow, which is a bullish signal for the short term. As you can see on the above chart, recent weeks have formed a consolidation, which is likely a pause before further increases.
Let’s check the short-term outlook.
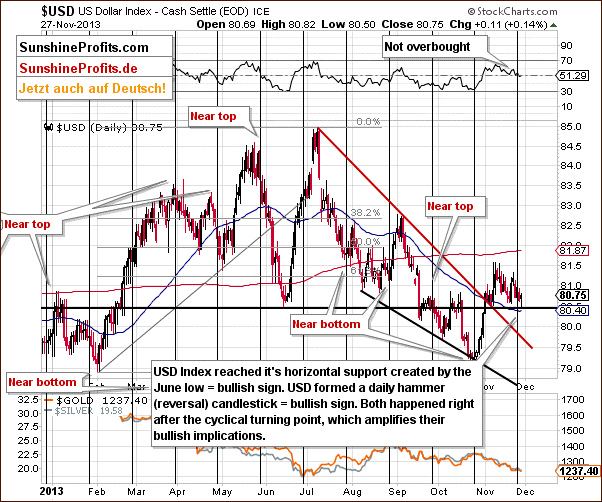
As you can see on the above chart, the USD Index extended its decline and dropped to the previously-broken support/resistance line created by the June low. Last week, the proximity to this support level (or comments from the Fed about the possibility of tapering the QE program – which we don’t believe, by the way) triggered a sharp move up, which took the dollar above the level of 81 once again. Therefore, since this level was reached once again, it seems that we might see a similar rally once again. Additionally, the greenback formed a daily hammer (reversal) candlestick, which is another bullish sign.
On top of that, both happened right after the cyclical turning point, which amplifies their bullish implications. Connecting the dots, it seems that another move up could be seen shortly.
Let’s now take a look at the medium-term Euro Index chart.
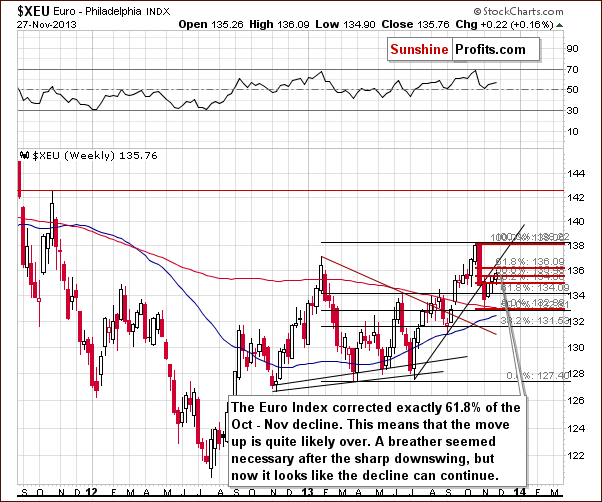
As you see on the above chart, since the beginning of the week, the euro has continued its rally. The Euro Index moved above the level of 135 once again and corrected exactly 61.8% of its October-November decline (to 136.09).
At this point, it’s worth mentioning the short-term rising support line based on the July and September lows, which is slightly above the 61.8% retracement. Looking at the above chart, we clearly see that despite the recent corrective upward move, the breakdown below this line hasn’t been invalidated.
Combining these two facts, we can conclude that the move up is quite likely over and the decline can continue. If we see a move below 131.56, the bearish implications will be even stronger.
Having discussed the current situation in the U.S. currency, let’s see how it may translate into the precious metals market. Let's take a look at the Correlation Matrix.
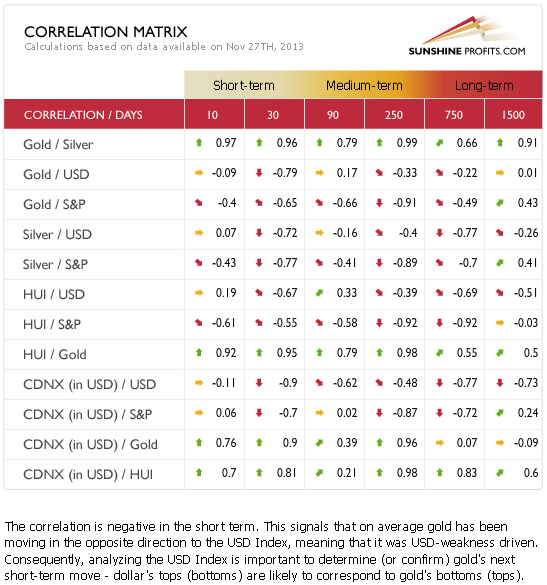
The Correlation Matrix is a tool which we developed to analyze the impact of the currency markets and the general stock market upon the precious metals sector (namely: gold correlations and silver correlations).
The correlation coefficients remain strongly negative as far as the short-term (30 trading days) link between precious metals and the USD Index is concerned. The 10-day column includes values close to 0, which simply means that gold didn’t respond to dollar’s move lower – which is a bearish sign.
Summing up, looking at the current situation in both currencies, we are likely to see weakness in the Euro Index and improvement in the USD Index on a short-term basis. As mentioned earlier, the USD Index reached its cyclical turning point and, taking this fact into account, it seems that the bottom of the current correction is already in. Additionally, the euro corrected exactly 61.8% of its October-November decline and approached the short-term rising support line without breaking it, which means that the move up is quite likely over. Therefore, currently, the implications for the precious metal market are bearish.
If you'd like to read the full version of today's analysis along with our current trading suggestions, please subscribe to the Premium Service.
Thank you.
Przemyslaw Radomski, CFA
Back