

Although the bond prices do not drive the price of gold, the spreads between prices of bonds or yields – the different sides of one coin – with different risk level may be an important factor for the gold market. Why? Credit spread is a spread between two securities that are almost identical, except for quality rating. Because Treasuries are considered practically risk-free, they constitute a benchmark to which other bonds are compared. Thus, credit spread usually shows a spread between Treasury securities and identical (except rating) non-Treasuries. In other words, credit spread indicates the risk premium for investing in one (risky) security over another (considered to have almost no risk). For example, private companies can default, so they must offer a higher return on their bonds, because their credit rating is worse than the U.S. government’s, who, allegedly, cannot go bankrupt. What is important is that when the market uncertainty rises, investors tend to flee from the risky assets and park their money in relatively safe securities, like the U.S. treasuries, so credit spread widens. Conversely, in quiet times investors are less risk-averse and more eagerly invest in more risky securities, compressing the credit spreads.
Now, the connection between credit spreads and the price of gold should be obvious. When investors become more risk-averse, they not only tend to buy more Treasuries at the expense of other bonds, but they also increase their demand for gold, the ultimate safe-haven. Let’s analyze this relationship in detail. The chart below shows the price of gold and credit spread between bonds that are below investment grade (those rated BB or below) and Treasuries.
Chart 1: The BofA Merrill Lynch US High Yield Master II Option-Adjusted Spread (green line, left scale, in percent) and the price of gold (yellow line, right scale, P.M. London Fixing)
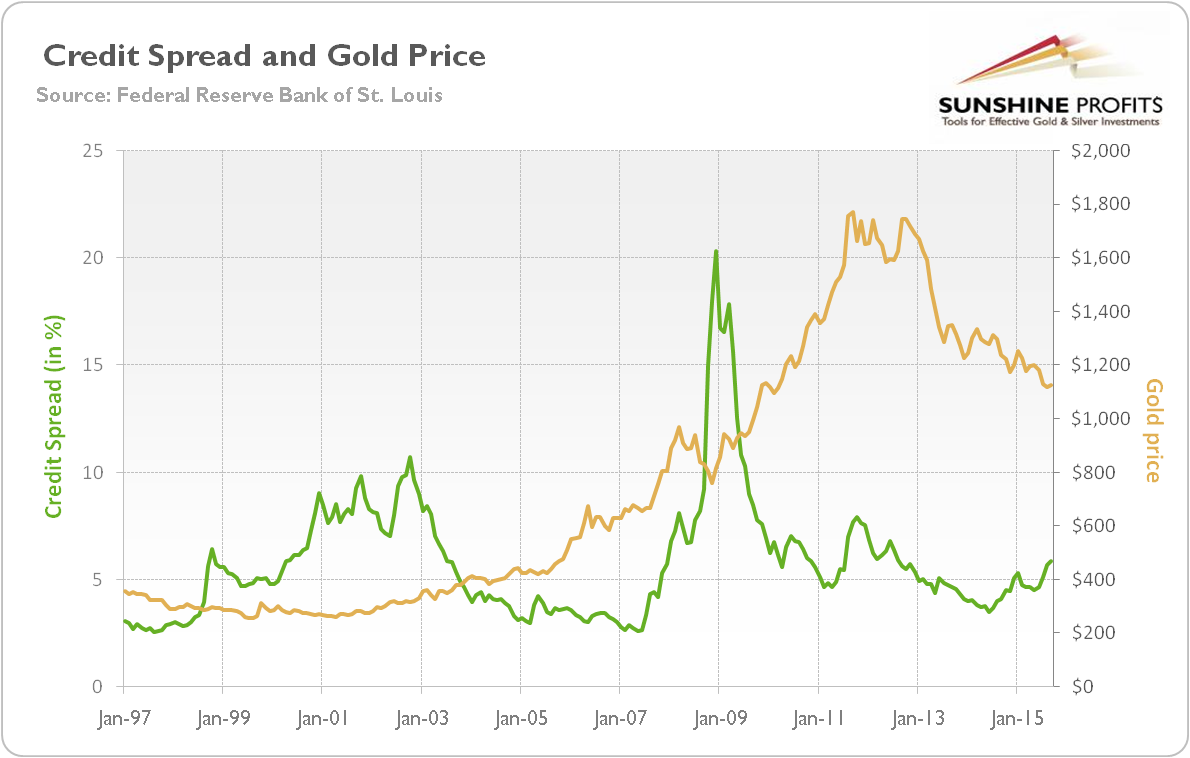
As one can see, a rise in credit spreads between 2007 and 2009 proved to be bullish for gold, while narrowing of credit spreads between 2011 and 2014 was accompanied by decline in the price of gold. However, contrary to expectations, credit spreads were tightened between 2003 and 2007, while the shiny metal enjoyed a bull market. That decline in credit spread was probably counteracted by opposite movements of other fundamental factors, such as the U.S. dollar exchange rate and real interest rates.
The next chart tells a similar story. Instead of the BofA Merrill Lynch US High Yield Master II Option-Adjusted Spread, we put the TED spread, which is the difference between three-month LIBOR (a benchmark rate that some of the world’s leading banks charge each other for short-term loans) and three-month Treasury bills. The TED spread is an indicator of perceived credit risk in the economy, since T-bills are considered risk-free, while LIBOR reflects the credit risk of lending to commercial banks. When the TED spread increases, default risk is considered to rise (and vice versa), so investors shift more capital into safe investment, like precious metals.
Chart 2: TED Spread (green line, left scale, in percent) and the price of gold (yellow line, right scale, London P.M. Gold Fixing)
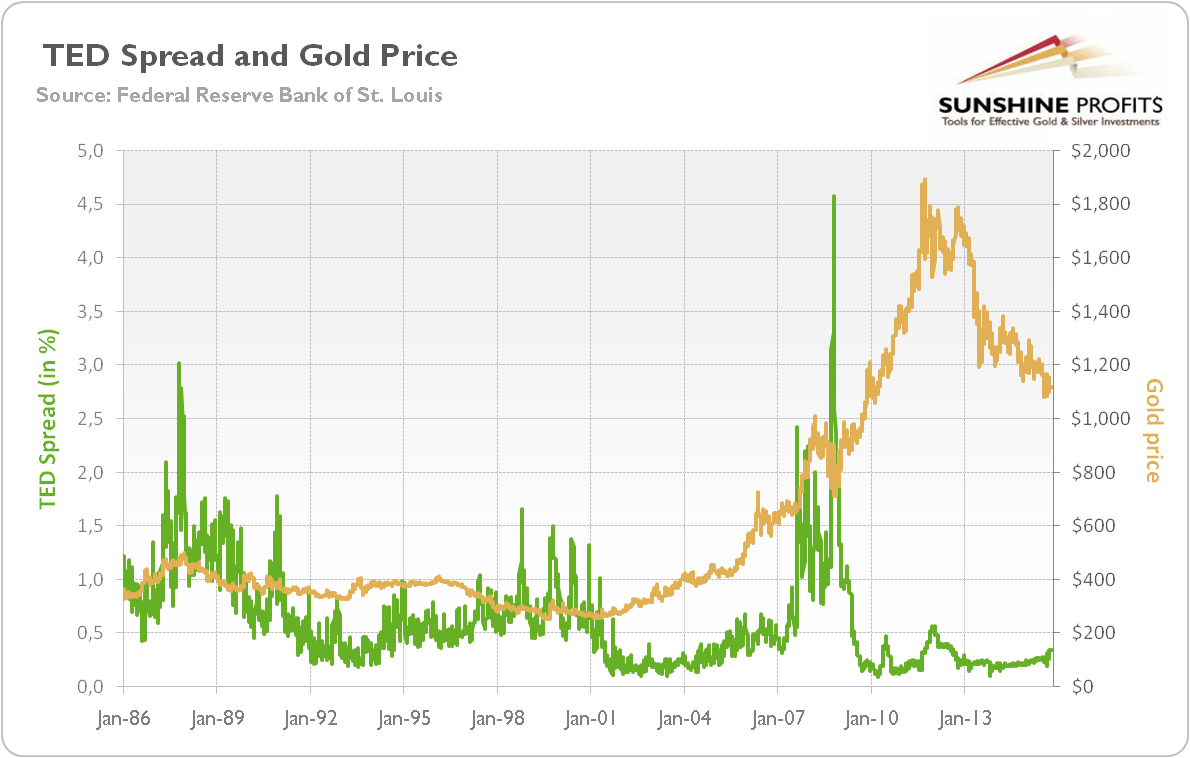
The TED spread has been rising since 2004 to 2008 (when it spiked), along with the yellow metal. Similarly to the bond spread described earlier, the TED spread was declining between bearish for gold 2012 and 2014. However, there were also periods when the positive relationship between the TED spread and the price of gold did not hold. This is why it is so important to analyze the broader economic situation and several fundamental factors. Please notice that both Merrill Lynch and the TED spread have been rising since the second half of 2014, signaling rising uncertainty in the market, which could be bullish for the gold market, if other fundamental factors would like to cooperate.
Summing up, credit spreads are indicators of economic confidence. When they widen, the situation is bullish for gold, since there is more perceived risk in the economy. Conversely, when credit spreads tighten, investors are less afraid, consequently reducing their demand for safe-havens (such as gold). The yellow metal is not driven by inflation, but by the fear of financial collapse. However, credit spreads alone, though a theoretically important factor in the gold market, cannot fully explain the dynamics of the price of gold. Investors should also pay attention to other factors, such as real interest rates and the U.S. dollar exchange rate.
If you enjoyed the above analysis and would you like to know more about the most important factors influencing the price of gold, we invite you to read the November Market Overview report. If you’re interested in the detailed price analysis and price projections with targets, we invite you to sign up for our Gold & Silver Trading Alerts. If you’re not ready to subscribe at this time, we invite you to sign up for our gold newsletter and stay up-to-date with our latest free articles. It's free and you can unsubscribe anytime.
Thank you.
Arkadiusz Sieron
Sunshine Profits‘ Gold News Monitor and Market Overview Editor
Gold News Monitor
Gold Trading Alerts
Gold Market Overview
