
Based on the October 3th, 2013 Premium Update. Visit our archives for more gold articles.
The recent week was tough for the U.S. currency. Investors avoided the dollar as uncertainty over the U.S. government shutdown and the upcoming debate on the debt ceiling weighed on sentiment. The shutdown, with its suspension of funding for government workers and some programs, could hamper U.S. growth and delay tapering. Therefore, some investors buy gold as a safe haven or alternative to the U.S. dollar on the view that it will outperform other assets during political or economic turmoil. However, looking at chart of gold, it seems that these circumstances have had a limited effect on the gold market.
"(...) Sentiment remains hesitant towards gold, which has been reflected in the market positioning. While the temporary U.S. government shutdown has not proved to be a positive driver for prices, the risk of a debt ceiling breach holds scope to spark interest, in our view, given gold's response in 2011," Barclays noted.
In our previous essay on gold price in October 2013 we wrote that the debt ceiling issue came up in 2011. Back then, an agreement was reached only in the last minute and gold hit an all-time high of $1,920 an ounce, in part because of the uncertainties surrounding the deal.
Taking the above into account, investors are focusing now on the U.S. government shutdown and its impact on the dollar, and probably wondering where the final bottom of the current corrective move will form. When we take a look at the chart, we see that the dollar dropped to its new eight-month low in the previous week. What’s interesting, at the same time we didn’t notice a sharp increase in gold. This relationship between the U.S. dollar and gold has encouraged us to examine the US Dollar Index once again (from many perspectives) and the medium-term gold chart to see if there’s anything on the horizon that could drive gold prices higher or lower shortly. We’ll start with the USD Index very long-term chart (charts courtesy by http://stockcharts.com).
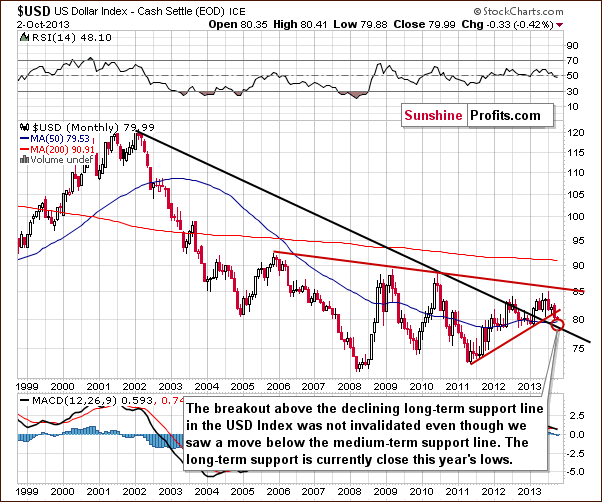
The situation in the long-term chart hasn’t changed much recently and all of what we wrote in our essay on the dollar and gold is still up-to-date.
The long-term breakout above the declining long-term support line was not invalidated. (…) However, since the medium-term breakdown (below the support line marked with red) is visible also from this perspective, we could see some short-term weakness anyway. It seems that the long-term support line will stop the decline – that is, if the USD Index gets that low. Therefore, from the long-term perspective, it seems that the downside is still quite limited.
Now, let’s examine the weekly chart.
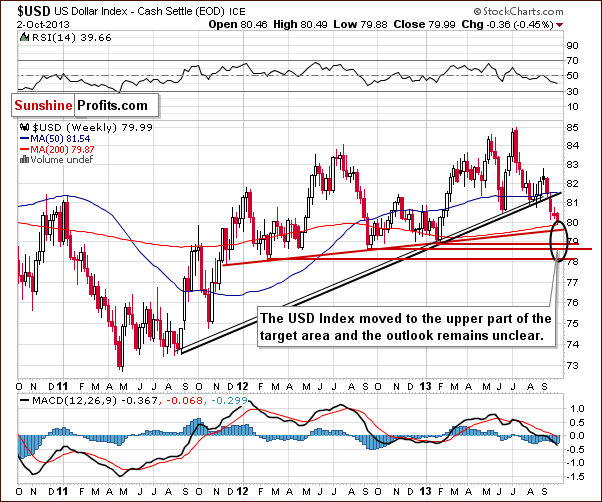
On the above chart, we see that the USD Index reached the upper edge of the target area (marked with a black ellipse), so the bottom might be in. However, the situation is unclear, because even if the dollar moves three index points lower, it still will be in the target area.
The breakdown below the rising, medium-term support line is confirmed, which makes the picture more bearish. However, as you can see on the short-term chart, it’s not that important from the precious metals investors’ point of view.
Let’s check the short-term outlook.
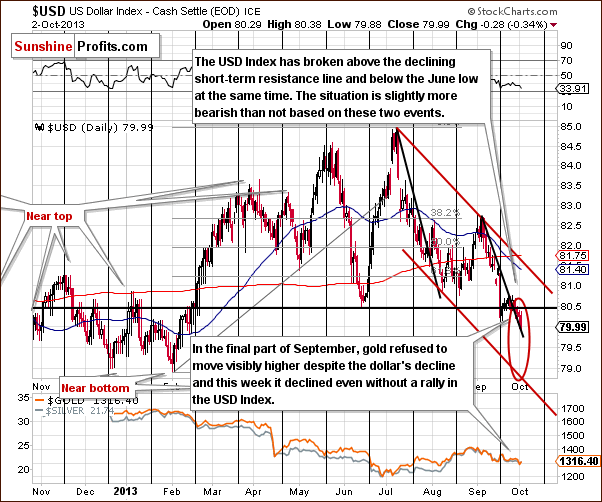
Before moving to the main point, let’s focus on a different interesting situation. At the same time, the USD Index broke above the short-term declining resistance line and below the June low. In our opinion, the breakdown below the June low is more important, because it is of a more long-term nature. When two technical factors are in conflict, the stronger – more long-term / more significant one – usually prevails.
As mentioned earlier, it is not the most important thing that we can see on the daily chart. The most important thing is gold’s clear underperformance compared to the USD Index, something that used to herald declines in the precious metal market in the past months.
If we compare the dollar’s and gold’s performance in the last few weeks, we will see that gold has been underperforming the USD Index more and more significantly. In the final part of September, gold didn’t move visibly higher even though the USD Index started to decline, and this was proved last week on Tuesday when gold plunged without any signal from the dollar.
Again, this underperformance is the key thing to keep in mind at this time because it means the lack of clarity for the USD Index is not so important. Gold can decline even without a signal (namely: without a rally) from the US Dollar Index.
Having discussed the current situation in the U.S currency, let’s now move on to the chart that shows us the yellow metal’s performance in the medium term.
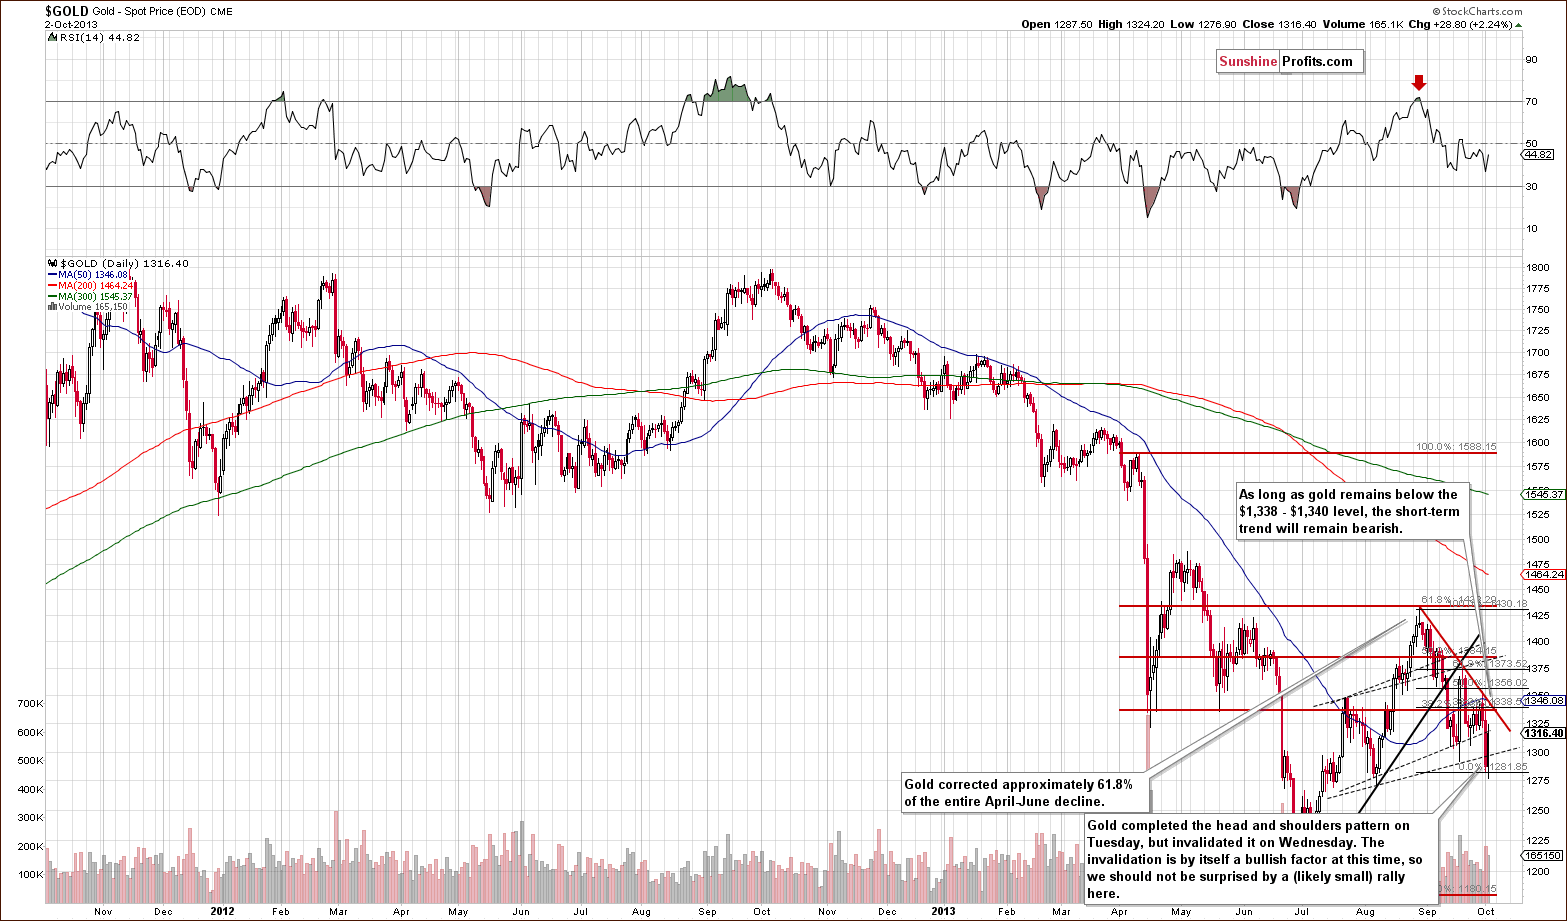
On the above chart, we see that two important things happened last week.
The first is the completion of the head and shoulders pattern and the breakdown below the neck level. The second thing is the invalidation of this breakdown. The invalidation by itself is a bullish signal, so further strength in the short term should not surprise us.
Please note that there is a short-term declining resistance line based on the August and the September 19 highs, which intersects with the 38.2% Fibonacci retracement level based on the August-October decline and serves as resistance. If this resistance is broken and we see a breakout, we could also see another significant rally, perhaps above the $1,400 level. However, please remember that this is just a possibility, because this time, the medium- and short-term trends remain down.
Summing up, although the situation in the USD Index is unclear, it is not so important, because it seems that gold can decline even without a rally in the dollar. The medium-term outlook for gold remains bearish and the downward trend is not threatened at the moment, even though we could see some strength on a short-term basis.
Whether we see a breakout in gold or not (and continuation of the downtrend) it seems that the volatility will soon increase. It seems to be a good idea to stay informed during such times - we can assist you in that through our Premium Updates and Market Alerts. Today's Market Alert covers i.a. 2 important things that happened on the precious metals market on Monday: silver's outperformance and the divergence between GLD ETF and spot gold. If you'd like to read it, please subscribe to our Premium Service.
Thank you.
Sincerely,
Przemyslaw Radomski, CFA
