
According to Reuters, on Friday light crude logged its biggest daily percentage gains in a week following unexpected strength in trade data from China. Speaking of China… China's oil imports rose to a record in July, although implied oil demand softened from a four-month high in June.
Worries that tensions in Egypt and Syria could spill over into Gulf oil-producing countries and disrupt supplies were expected to support crude prices as well.
Currently, market players are waiting for the U.S. data for some hints on when the Federal Reserve will start winding back its monetary stimulus.
The world's largest economy will issue key reports on retail sales, consumer prices, housing starts, industrial production and surveys of regional manufacturing in coming days. Any reduction in economic stimulus by the Fed will cut the flow of cheap central bank money that has boosted market liquidity and bolstered riskier markets like commodities.
Taking the above-mentioned into account, investors are probably asking the same question: what impact have these circumstances had on the light crude’s chart? Have they changed the outlook for oil? Where are the nearest support zones and resistance levels? Let's take a closer look at the charts and look for answers to these questions.
The short-term situation in light crude hasn’t changed much.
As I wrote in my previous essay on crude oil:
(…) the oil bulls almost touched the July’s four-month high. (…) closeness to this strong resistance level encouraged investors to take profits after strong growth. Taking this into account, in the following days we may see a bearish scenario. In this case the first support is the bottom of the last corrective move (the July 30 low) which, together with the upper line of the large triangle (the red bold line), forms a strong support zone.
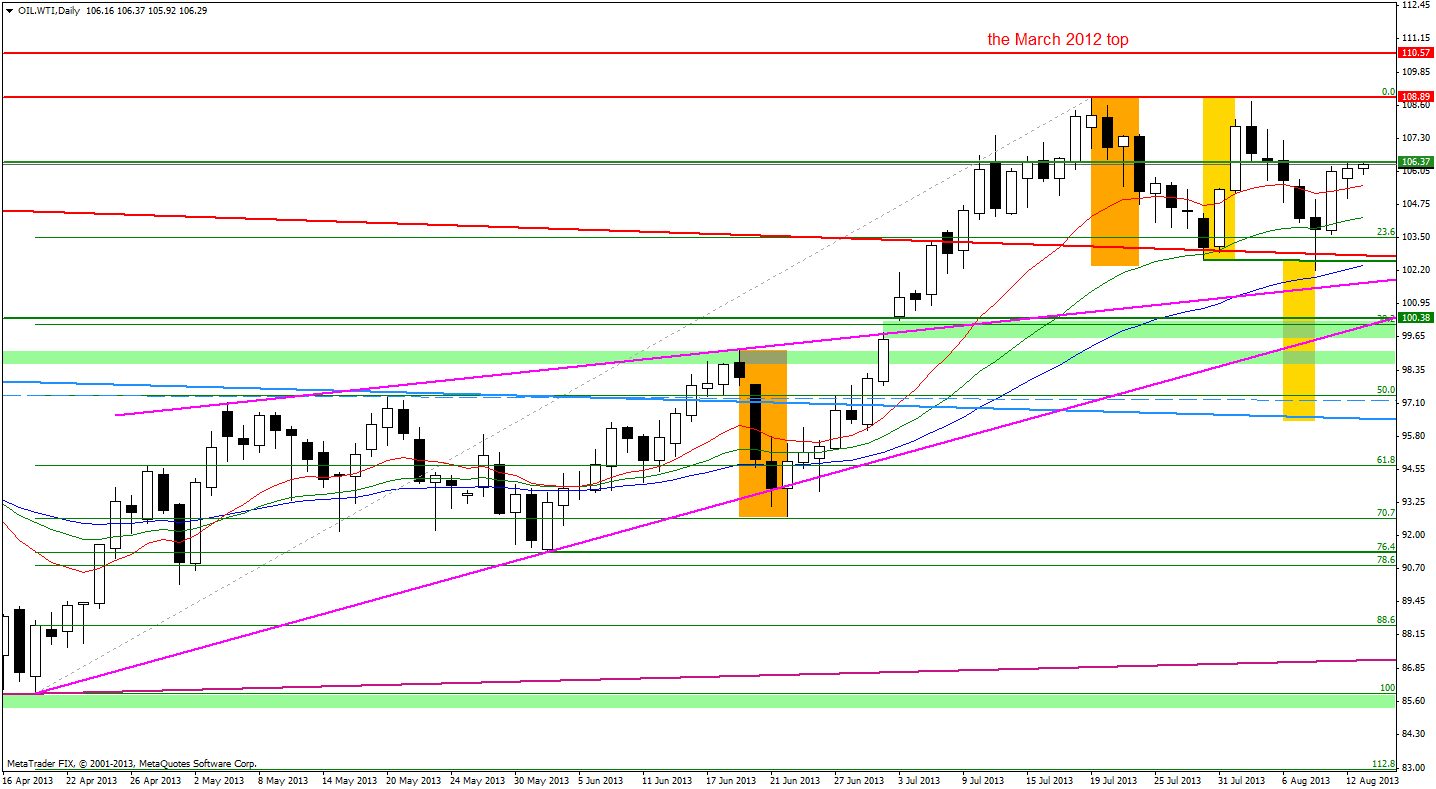
On the daily chart, we clearly see that the oil bears were able to make this scenario play out and the price of light crude dropped below the July 30 low (but only on an intraday basis). Despite this decline, the strong support zone encouraged buyers to act and light crude rebounded sharply on Friday. That increase led the price to over $106 per barrel once again.
The recent days have formed a consolidation on the chart. If the oil bulls manage to push the price higher successfully, we might see an increase to at least the August top which is slightly below the June peak. The next resistance level is slightly above $110 per barrel (the March 2012 top).
Please note that if the buyers fail and the price drops below support level (the August 8 low), we might also see a bearish scenario from my previous essay:
(…) a bearish double top pattern. According to theory, the price target for the pattern is around $96.50 per barrel. As you see on the above chart, there is a support in this area - the declining line based on the September 2012 top and the February 2013 peak (the blue bold line).
Now, let’s take a closer look at the positions of indicators.
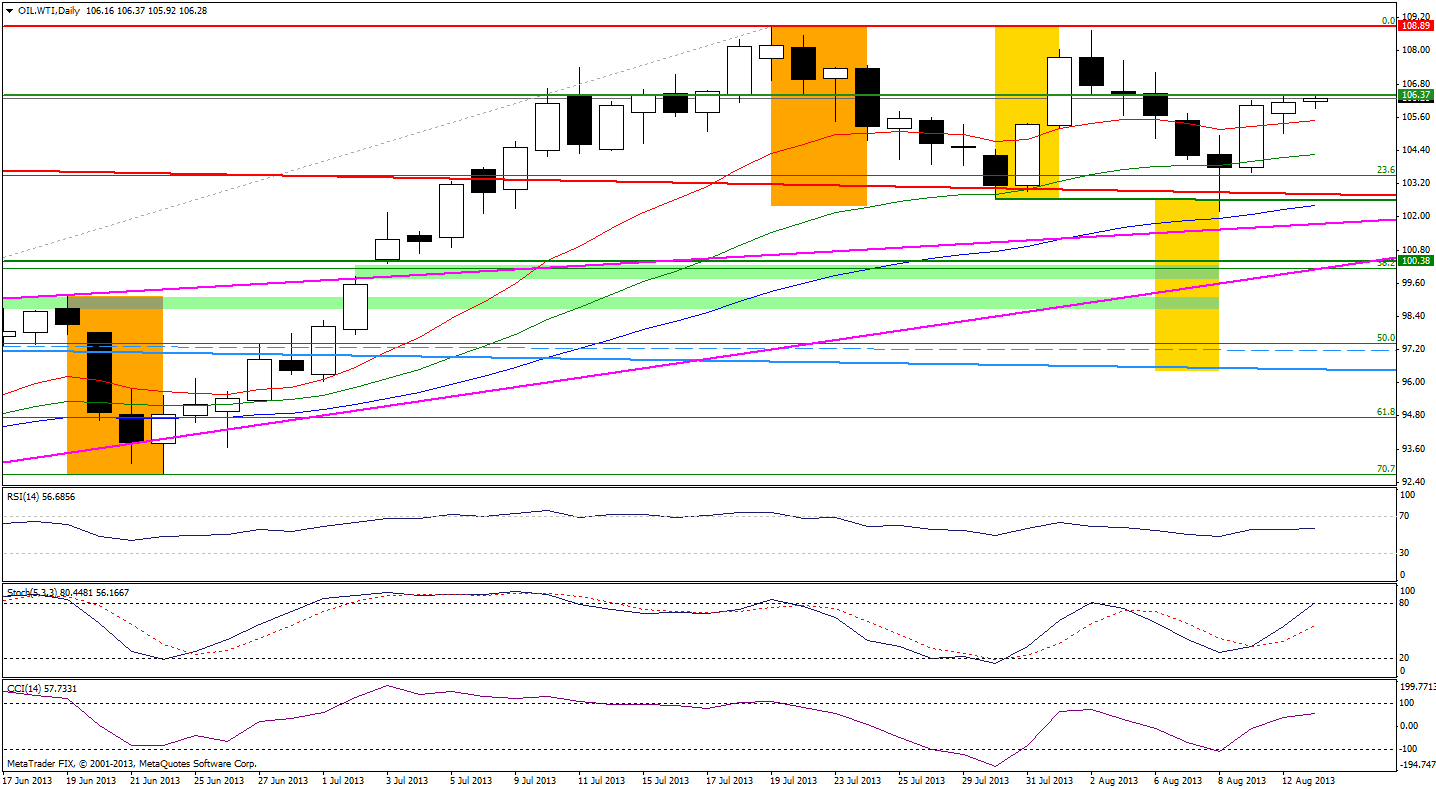
The RSI is still below the 70 level, and from this point of view, the oil market is not overbought. Buy signals generated by the Commodity Channel Index and Stochastic Oscillator remain in place and still support buyers.
Once we know the current situation in the daily chart and the positions of indicators, let’s zoom in on our picture of the oil market and see the 4-hour chart.
Last time I wrote:
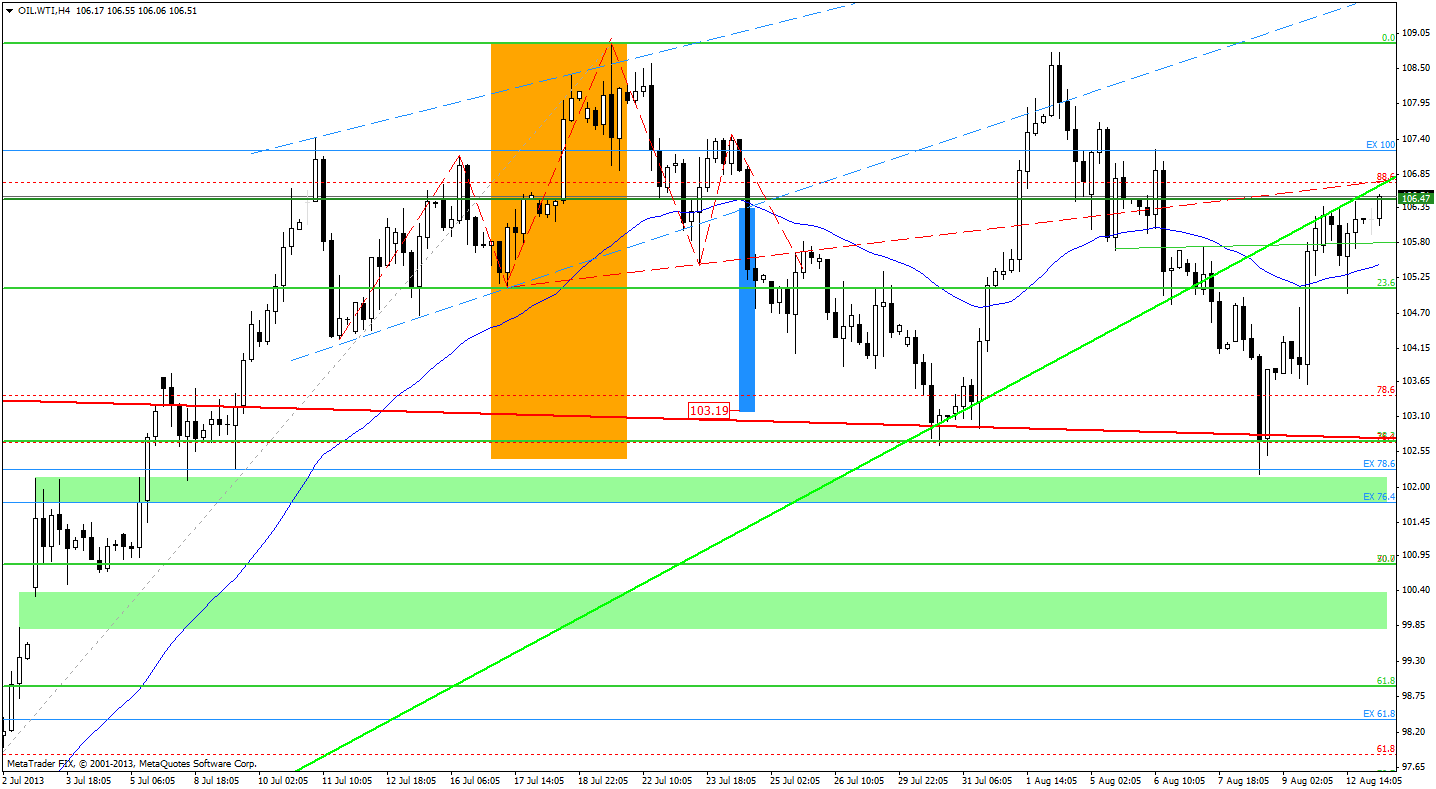
If the buyers aren’t able to defeat this strong resistance level, we should prepare for further declines which would likely take light crude to the bottom of the last corrective move. (…) before we see lower prices, the sellers will have to break below the rising uptrend line (…)
As you see on the above chart, oil bears broke below this resistance level on Wednesday and the above-mentioned scenario was realized. The following days brought a pullback and light crude returned near the previously-broken rising uptrend line.
So, what's next?
On the one hand, further growth may be slowed. In this case, the first target for sellers is around $105 per barrel. On the other hand, if the buyers manage to break above this resistance line, we might see a bullish scenario: further growth, at least to $107.24 level. The next target for the oil bulls is around $107.66 and the next one is the August top which is slightly below the June’s peak.
Before we summarize, please take a look at the chart below.
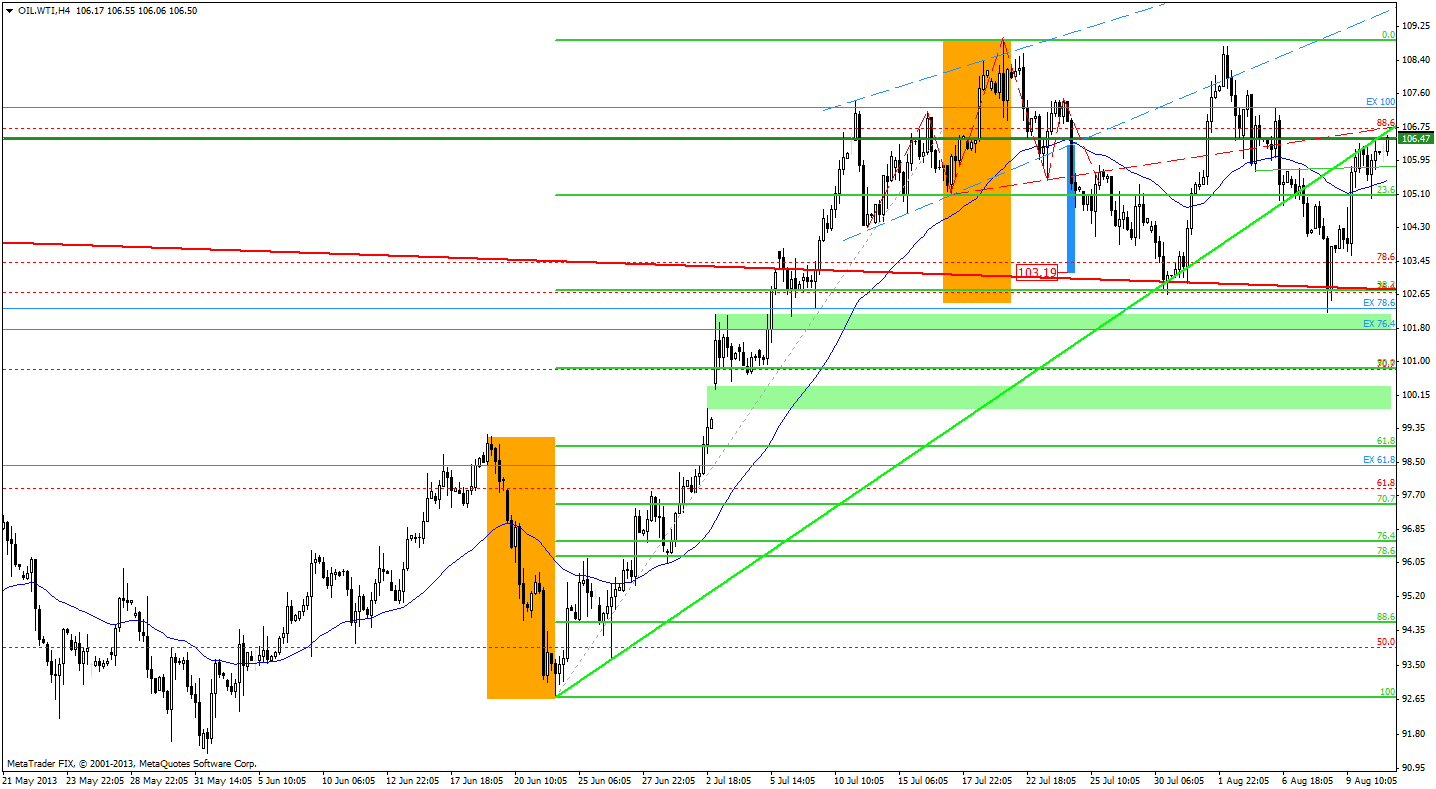
If we want to have a complete picture of the situation, we should take a look at the chart from a broader perspective. On the above chart, we see that the recent decline is very similar to the corrective move from the June 19 top to the June 24 bottom. From this point of view the short-term situation remains bullish.
When we factor in the Fibonacci price retracements, we clearly see that the correction is quite small because it only reached the 38.2% level. This is definitely a bullish factor for me.
Summing up, the price of light crude moved lower and reached the strong resistance zone based on the bottom of the last corrective move and the upper line of the large triangle. Despite this decline, oil bears didn’t manage to push the price lower and the bearish double top formation didn’t trigger a downward movement. These positive circumstances resulted in a pullback and light crude’s price returned near the previously-broken rising uptrend line. Today (at least at the moment when these words are being written), oil bulls haven’t broken below this rising uptrend line. However, if the buyers manage to break above this line, we should prepare for further growth which would likely take light crude to the August top. The short-term technical situation remains bullish and, from my point of view, the uptrend is not threatened yet.
Please remember that you should keep an eye on the today's fresh weekly inventory data from the U.S. Energy Information Administration (EIA) for more trading cues.
Thank you,
Nadia Simmons
