
During the last two days the price of light crude continued its rally and rose above $103 per barrel which is a new 14-month high. Without a doubt, the price climbed up so much higher in the past few weeks because of the Syrian civil war escalation and then the Egyptian crisis. Another supportive factor was also the U.S. jobs data report which came in better than expected on Friday signaling that growth for the world's largest oil consumer is gathering momentum.
On the other hand, this last factor can also have a negative impact on future oil prices. The rising strength of the U.S. dollar may exert downward pressure on commodities prices, including oil.
"If we get some sort of resolution to the Middle East crisis then I think (a stronger U.S. dollar) is going to have a downward impact on oil," said Ben Le Brun, an analyst at OptionsXpress in Sydney.
"Oil prices have built up to a point that, unless there are more major news about intensifying Middle East conflicts, you're likely to see some form of correction," said Vyanne Lai, an economist at National Australia Bank.
Are they right? Would this Monday’s high be the top for crude oil? Or maybe we will see new highs? Let’s take a look at the chart and try to find the answers.
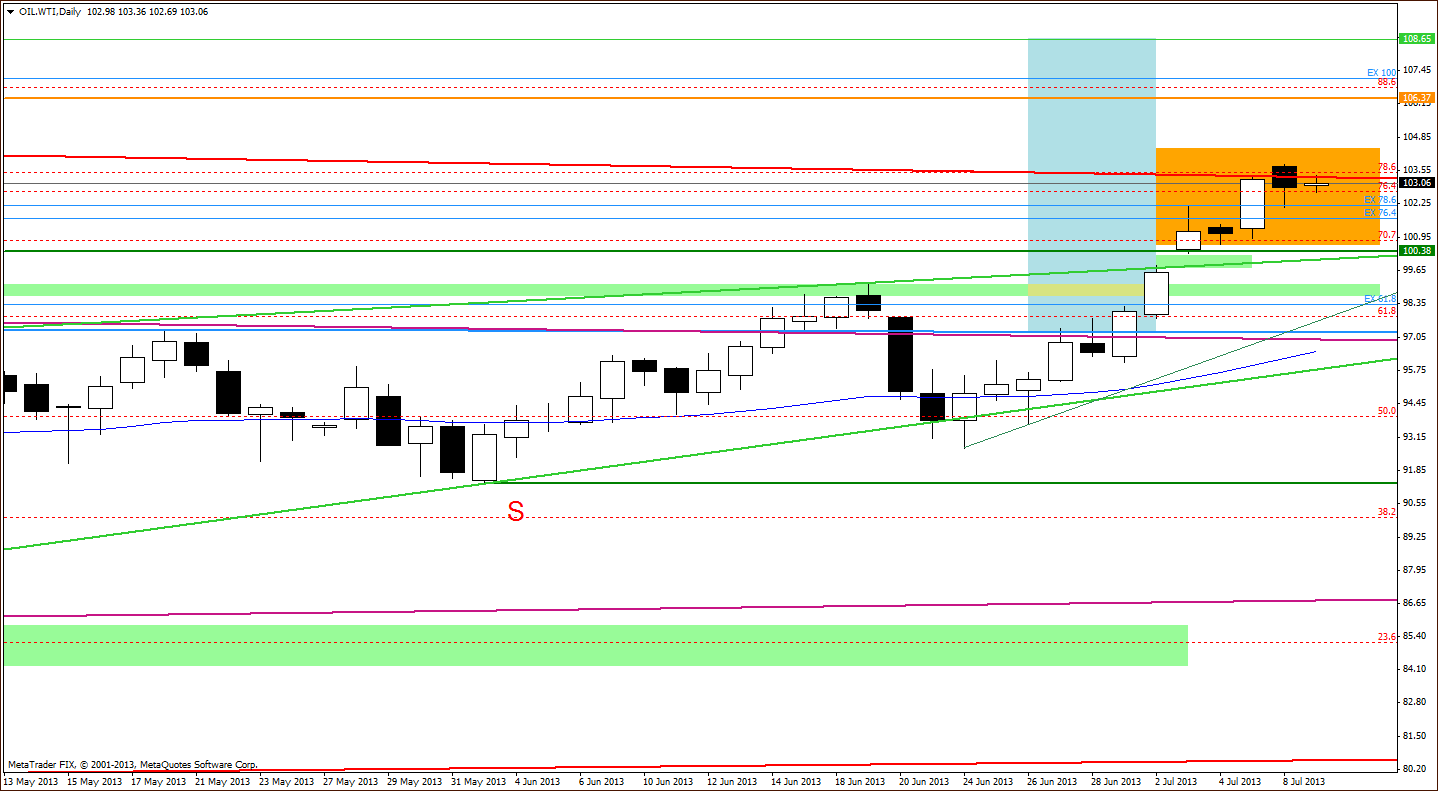
You see that recent increases have led light crude’s price to the key resistance zone based on two Fibonacci retracements – the 76.4% and 78.6% levels (the orange rectangle).
As I wrote in my last essay on crude oil:
“In this place we should also pay attention to the upper resistance line of a large triangle based on the May 2011 and March 2012 heights (the red bold line). Connecting these facts, we see the major resistance zone which might be a strong bearish factor that can slow further growth.”
Additional factors which prescribe caution are the positions of indicators. Let’s take a closer look at them.
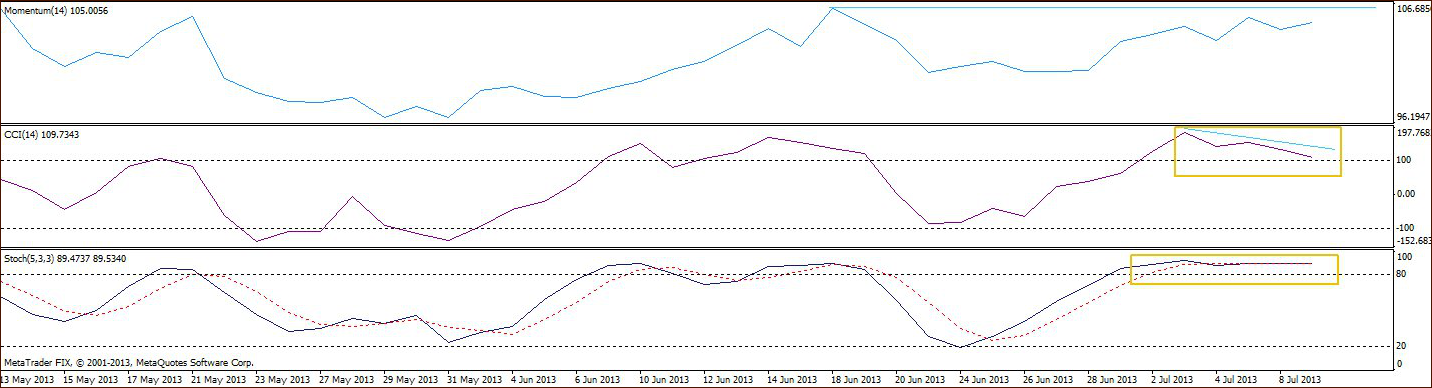
Both the Commodity Channel Index and Stochastic Oscillator are overbought. Additionally, there is a negative divergence on the CCI and the indicator is very close to generate a sell signal. We can also see the negative divergence in momentum.
Summing up, the above circumstances make the current situation a little more bearish for the next several days. From this point of view a correction is still likely. Please note that the first major support zone for potential declines is the upper line of the rising wedge with the gap between last Tuesday’s and last Wednesday’s white candles (around $99.83-$100.30).
However, if the buyers manage to break above the strong resistance zone based on two Fibonacci retracements (the 76.4% and 78.6% levels), we might see a bullish scenario: a further rally to at least $106.37, where the May 2012 height is. The next resistance level is around $107.12, where the 100 percent Fibonacci price projection is.
Investors should keep an eye on tomorrow’s very important events:
- fresh weekly information on U.S. stockpiles of crude and refined products from the American Petroleum Institute to gauge the strength of oil demand of the world’s largest oil consumer
- Federal Reserve's June meeting for further hints regarding the direction of the U.S. monetary policy.
They might have a significant impact on further movements in the oil market.
Thank you.
Nadia Simmons
