
If you want to be a good doctor you should do some tests before coming up with a diagnosis. However, very often it turns out that one test is not enough to discover the problem. So, a good doctor prescribes more tests to get a complete picture of the patient’s health.
I think that a good analyst should act similarly. Accordingly, to have a more complete picture of the current situation in the oil market I have decided to take a look at the charts from different time perspectives.
At the beginning let’s take a look at the monthly chart of light crude.
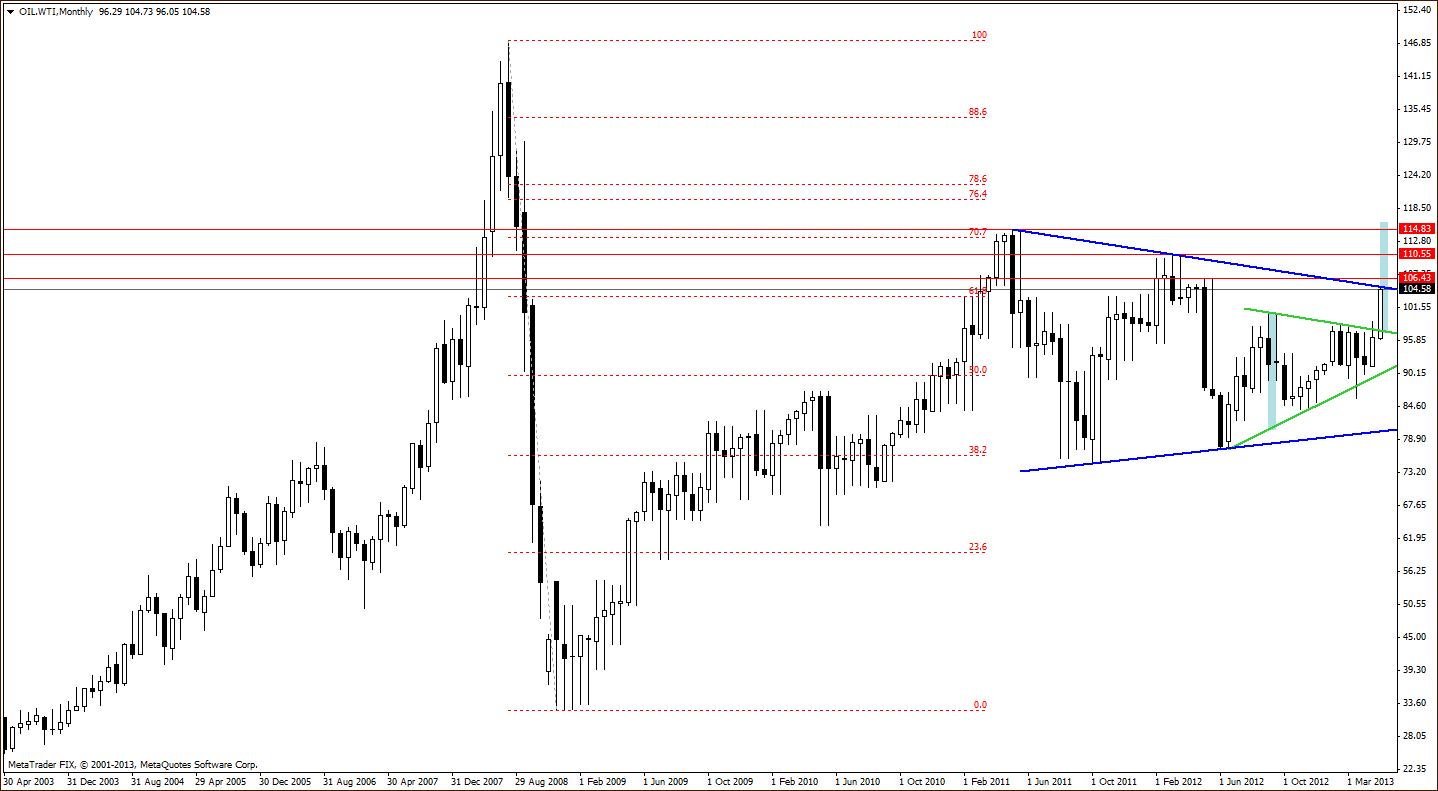
When we look at this long-term chart, we see that the price of light crude has soared above the declining resistant line based on the September 2012 and March 2013 highs (the upper green line which is also the upper line of the triangle). According to theory, the price target for this particular pattern would be slightly above the May 2011 high. From this perspective the picture is bullish and it seems that oil bears have only one argument – a blue declining line based on the May 2011 and March 2012 highs.
Now, let’s zoom in on our picture of the oil market and see the weekly chart (chart courtesy by http://stockcharts.com).
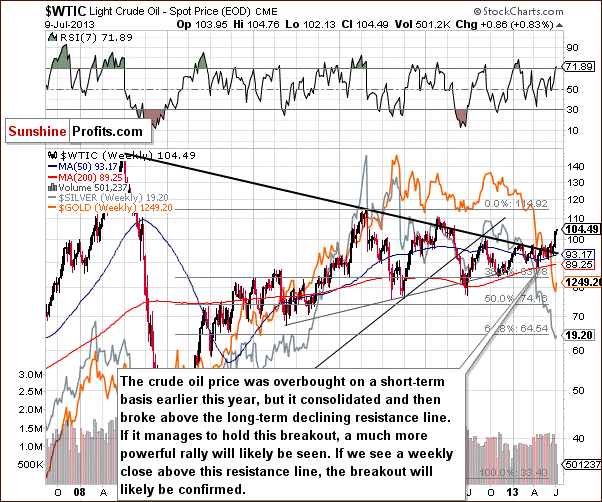
WTI extended its rally after a breakout above the long-term declining resistance line. The breakout held up and last week WTI closed above this resistance line. From this point of view the breakout is confirmed and a further rally will likely be seen.
Now, let’s check if the short-time outlook is the same.
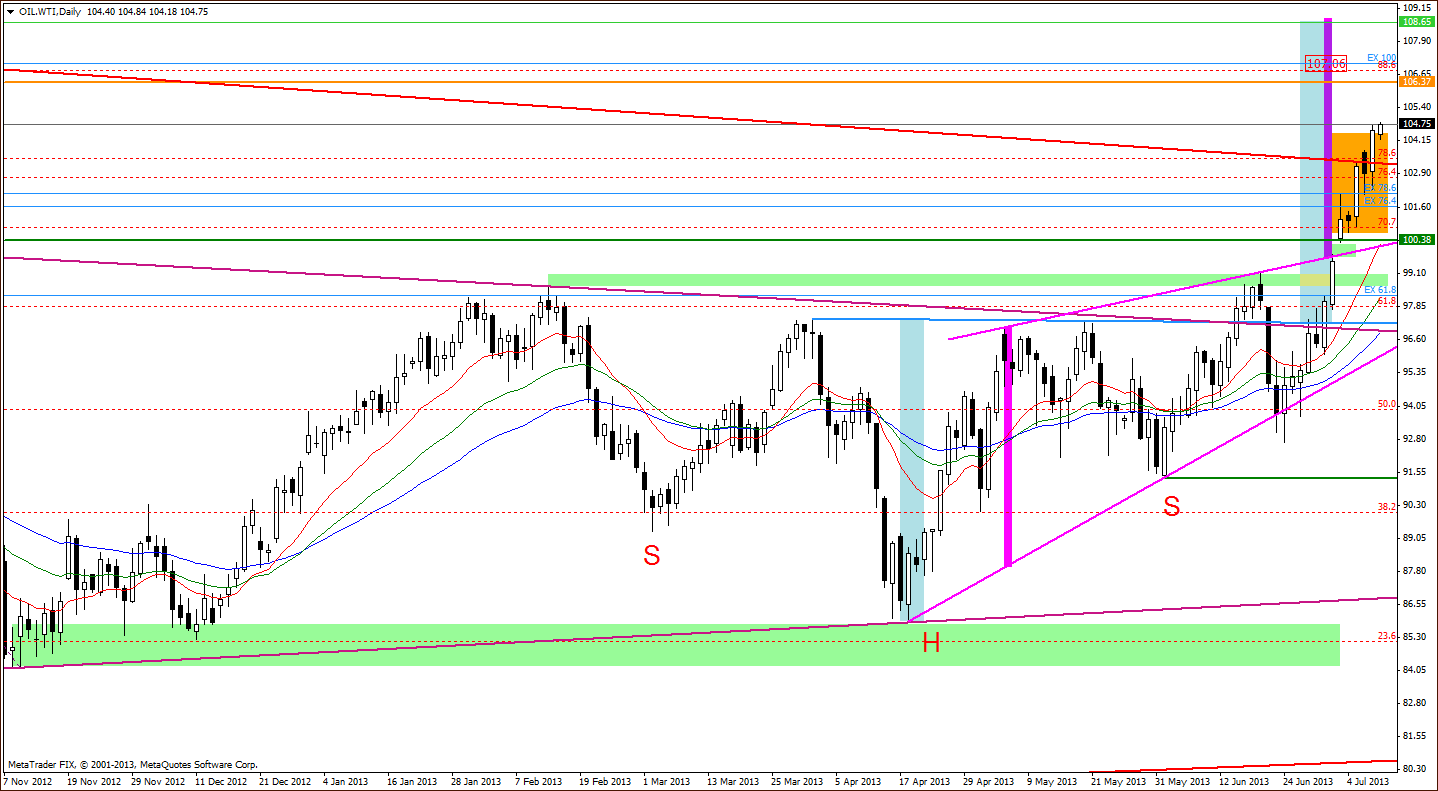
In this chart, we see that light crude continued its rally throughout Tuesday’s session and climbed up beyond the $104 level after the American Petroleum Institute’s late Tuesday announcement that crude supplies had fallen 9 million barrels for the week ended July 5. A Platts survey of analysts had previously projected a decline of 3.8 million barrels. These circumstances helped oil bulls confirm the break above the key resistance zone based on two Fibonacci retracements – the 76.4% and 78.6% levels (the orange rectangle).
Now, let’s take the same chart and zoom out a little bit.
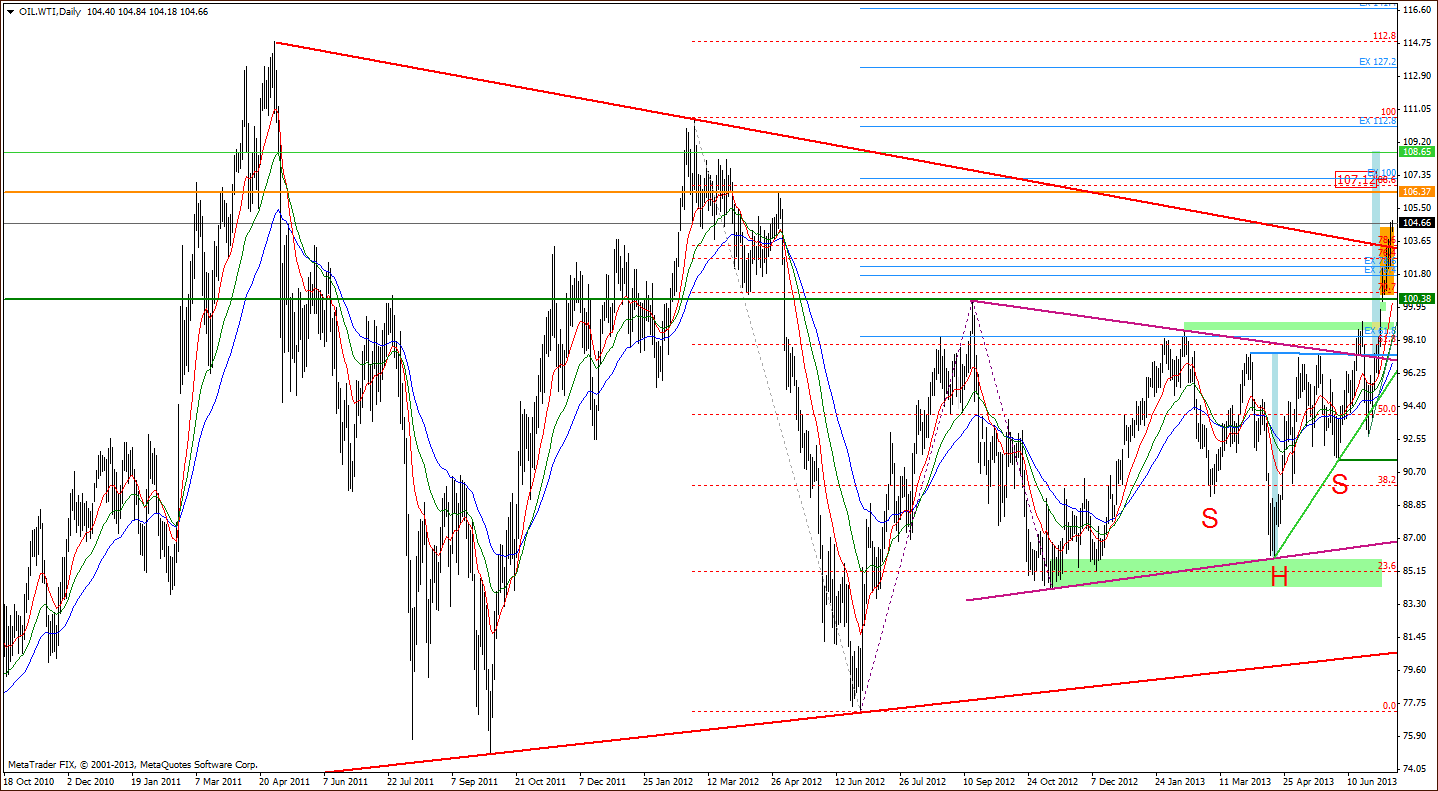
The breakout above the upper resistance line of a large triangle based on the May 2011 and March 2012 heights (the red bold line) seems to be another bullish factor. The current trends suggest a move higher to the next upside target at $106.37, where the May 2012 high is. The next resistance level is around $107, where the 100% Fibonacci price projection is.
In this way oil bears lost a very strong argument to go short and trigger a correction. The only factors which are still valid and prescribe caution are the positions of daily indicators.
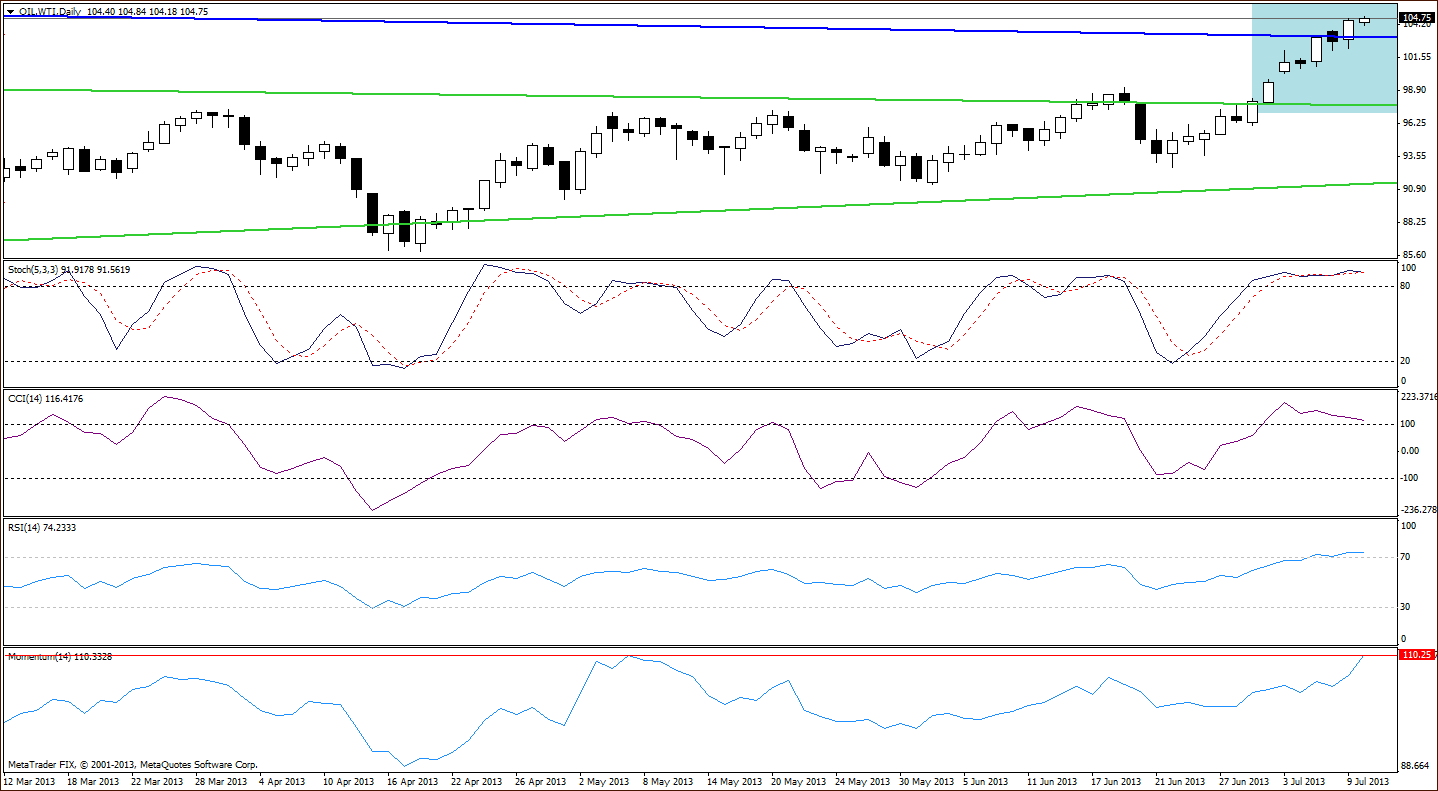
The Commodity Channel Index, the Stochastic Oscillator and the Relative Strength Index are overbought. Additionally, there is a negative divergence on the CCI and the indicator is very close to generating a sell signal. Only from this point of view a correction is still likely. Please note that the first major support zone for potential declines is the upper line of the large triangle (bold red line on the daily chart), next support zone is around $102.14-$102.29 and the last one above the June’s high is the upper line of the rising wedge with the gap between last Tuesday’s and last Wednesday’s white candles (around $99.83-$100.30).
Summing up, the technical situation has changed to bullish. The price of light crude moved higher and confirmed a short-term breakout. As I previously mentioned, the first target for buyers is at $106.37, where the May 2012 height is. The next resistance level is around $107, where the 100 percent Fibonacci price projection is. Above these levels there is a price target for the inverse head and shoulders pattern at around $108.65.
Please remember that you should keep an eye on today’s very important events:
- fresh weekly information on the U.S. stockpiles of crude and refined products from the American Petroleum Institute to gauge the strength of oil demand of the world’s largest oil consumer
- Federal Reserve's meeting for further hints regarding the direction of the U.S. monetary policy.
These might have a significant impact on further movements in the oil market.
Thank you.
Nadia Simmons
