
Since my previous essay the short-term situation in light crude has deteriorated. What circumstances have had an impact on light crude? Let’s take a look at some interesting pieces of data.
On Wednesday, according to Reuters, the EIA data showed U.S. crude inventories fell again last week, off 2.8 million barrels. Over the past four weeks, crude stocks were down nearly 30 million barrels. This is the biggest four-week decline on records dating back to 1982, but analysts said last week's draw was much smaller than massive declines earlier in the month.
"It seems like the era of big, 10 million-barrel draws has come to an end," said Bob Yawger, director of energy futures for Mizuho Securities USA Inc in New York.
Another bearish factor which harmed light crude came from China. U.S. crude prices fell after economic data showed that activity in China's manufacturing sector slowed to an 11-month low in July and its job market weakened, raising concerns of slower oil demand growth. Confirmation of a fall in U.S. oil inventories failed to support prices.
"There is no supply shortage and it will take time for the global economy to recover," said Ken Hasegawa, a commodity sales manager at Newedge Japan. “China's economic growth is going stabilize at lower levels, and it will no longer be a giant oil demand driver," he said.
What impact have these circumstances had on the light crude’s chart? Have they changed the outlook for light crude? Have these events triggered a deeper corrective move? Where are the nearest support zones and resistance levels? Let's take a closer look at the charts and find out what the current outlook for U.S. crude oil is.
As I wrote in my essay on crude oil on July 23, 2013:
(…) the price target for the inverse head and shoulders pattern was reached. In this way, the oil bulls witnessed their own pro-growth scenario. This positive event will likely encourage investors to take profits after four weeks of growth. Taking this into account, we should prepare for a correction.
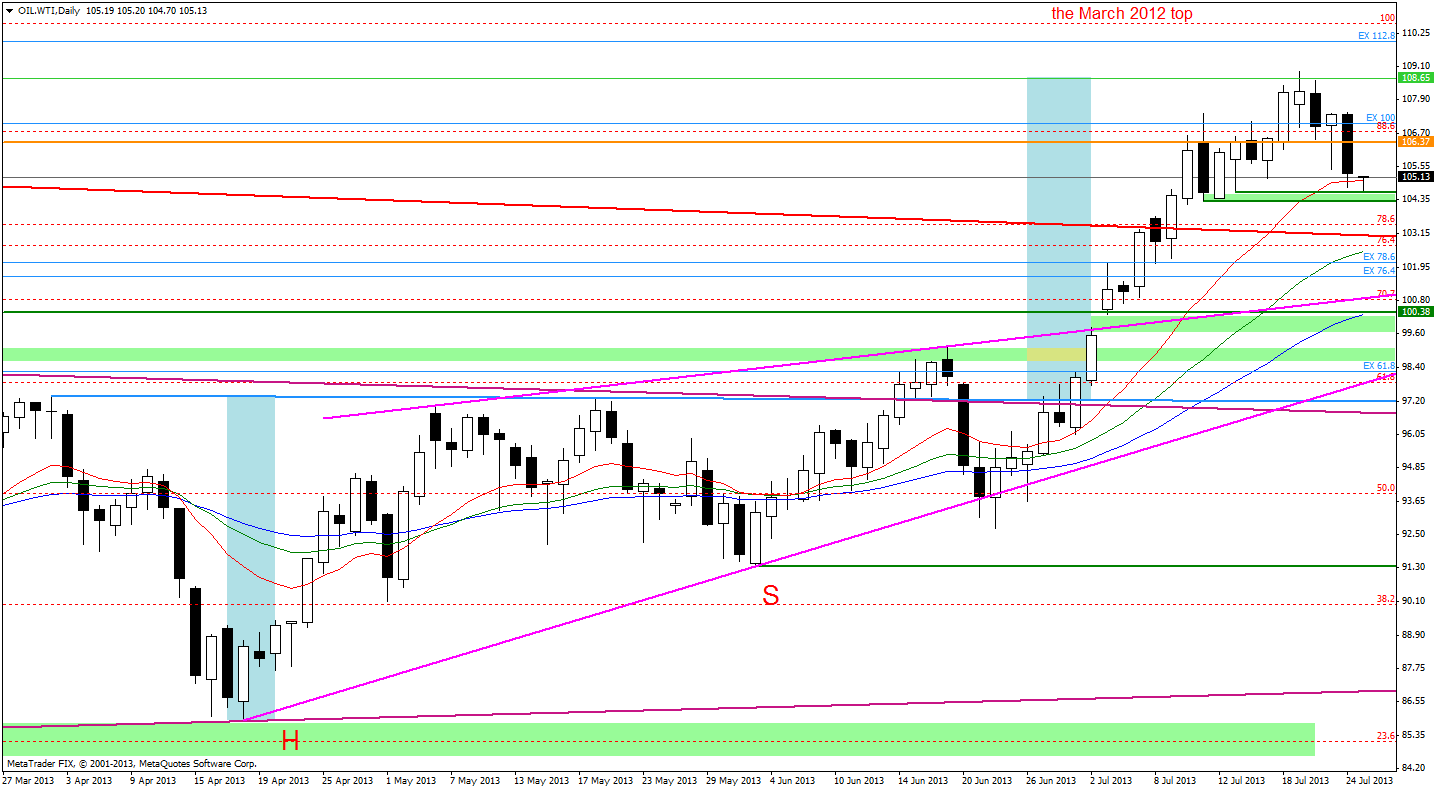
On the above chart we clearly see that the oil bears showed their claws and triggered a correction which took oil price below the first support level around the last Wednesday’s low. In this way, U.S. crude (West Texas Intermediate) dropped below $105 per barrel.
As you see on the daily chart this area is supported by the July 15 low which, together with the bottom of the last corrective move (the July 11 low), forms a strong support zone.
The next support level is based on the upper line of the large triangle based on the May 2011 and March 2012 heights (the red bold line).
At this point, it’s worth to mention the first resistance level - the orange line based on the May 2012 top which was broken yesterday. The next one is the yesterday’s high around $107.47.
Once we know the current situation from the daily chart, let’s take a closer look at the position of technical indicators.
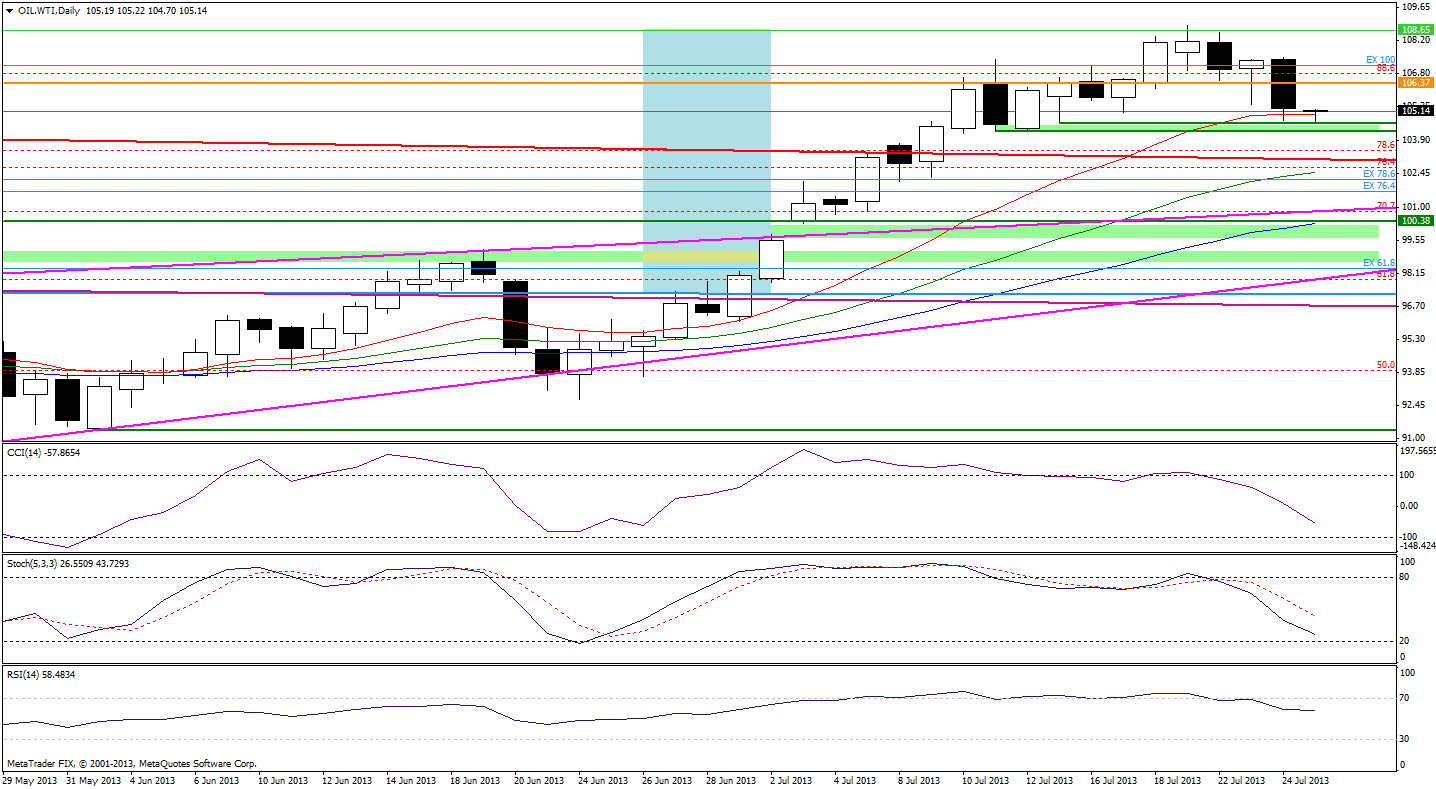
The sell signals which were generated on Monday remain in place and support the oil bears. The Relative Strength Index dropped below 60 for the first time since the beginning of the month which confirms the bearish outlook.
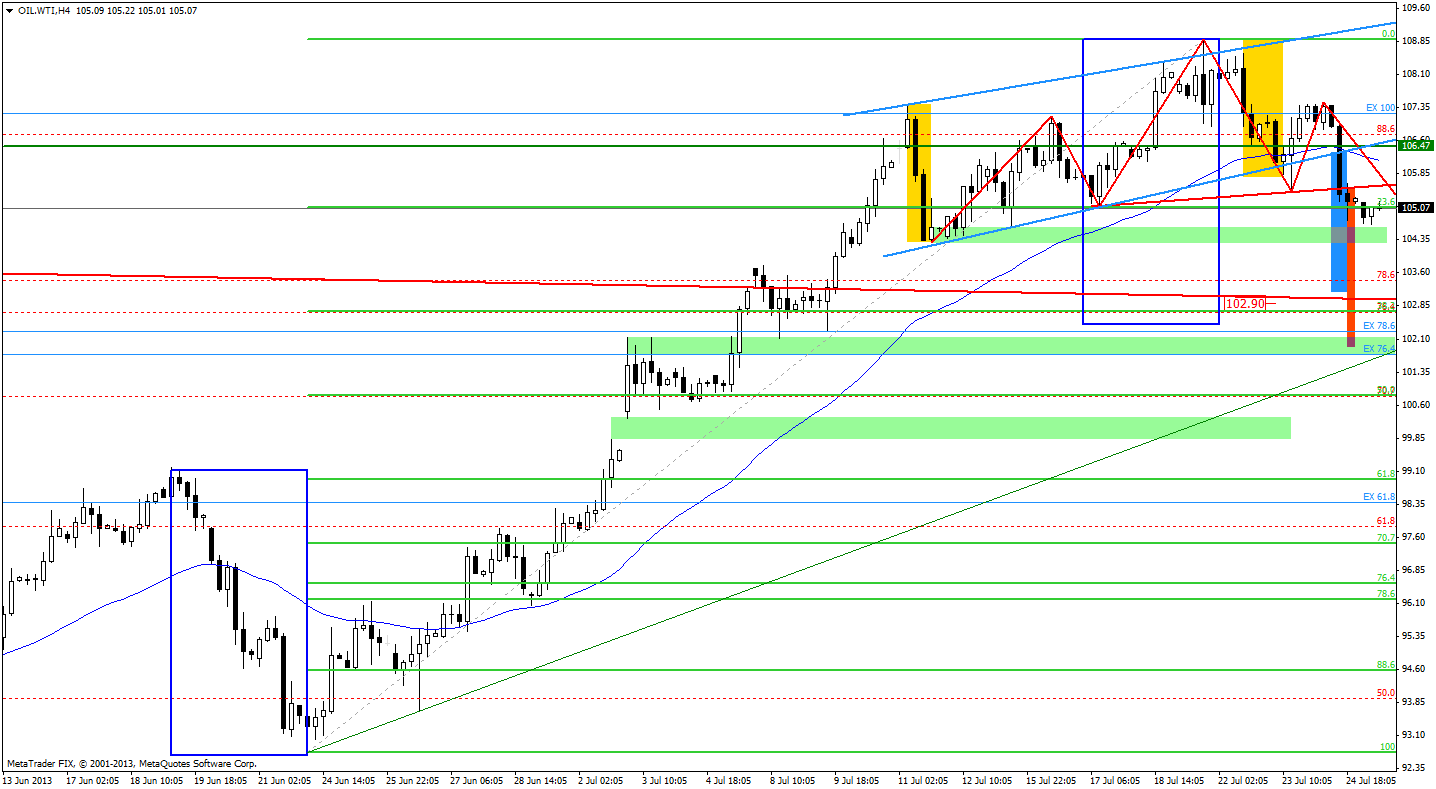
Once we know the current situation from the daily chart, let's zoom in on our picture of the oil market and see the 4-hour chart.
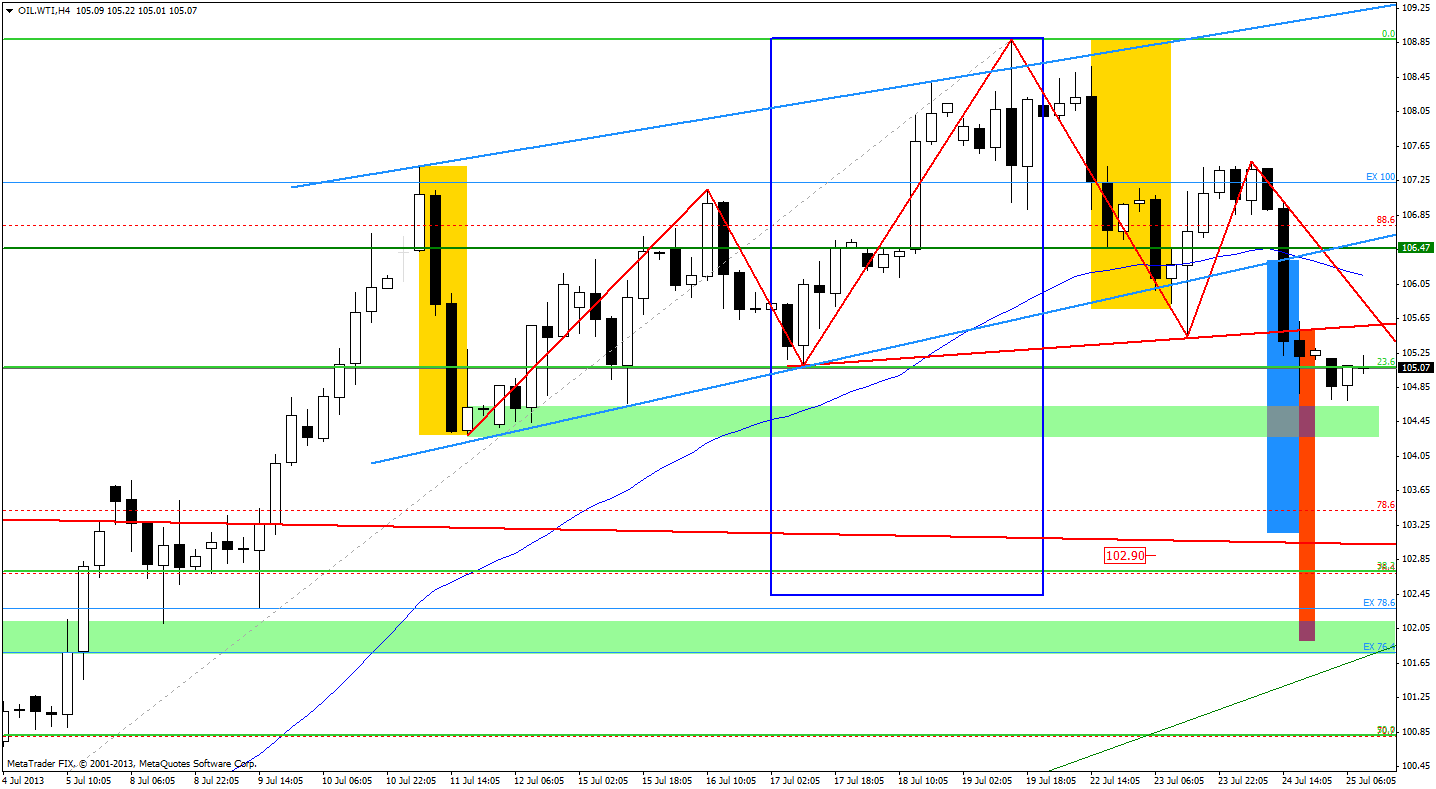
Now, let’s take the same chart and zoom in a little bit to see the current situation crystal clear.
As I wrote in my previous essay:
(…) the oil bulls (…) broke above the upper line of the blue rising channel. The breakout was invalidated very quickly and the price of light crude returned to the range of the channel.
We see that earlier this week, oil bears triggered a decline which took oil below the bottom line of the rising channel. In this case, the breakdown was also invalidated very quickly and the price of light crude returned to the range of the channel once again.
Although the buyers tried to push the price higher one more time, they failed and the price of light crude dropped below the bottom line of the rising channel. This time the breakdown wasn’t invalidated and the corrective move took oil below the 23.6% Fibonacci retracement level.
Please note that, the 45-day moving average was also broken yesterday and now it serves as a resistance.
Last time I wrote that if the price dropped below the bottom line of the rising channel (and the breakdown was confirmed) we could see further declines. The price target for the pattern would be around $103 per barrel (the blue rectangle on the chart).
When we take a closer look at the chart, we clearly see that there is one more strong bearish factor – the head and shoulders pattern. According to theory, the price target for the formation is around $101.92 (the orange rectangle). It’s worth to mention that there is a support zone in this area. It is based on the upper line of the consolidation that we saw at the beginning of the month.
When we factor in the Fibonacci price retracements, we see that there is still much room for further declines because the 38.2% retracement level is much lower than where the price is today. This retracement level coincides with the upper line of the large triangle.
Below these levels there is a strong support – the rising uptrend line based on the June 24 bottom and the June 26 low (currently close to $101.69).
Summing up, the price of light crude moved lower and dropped to the support zone based on the July 15 low and the bottom of the last corrective move (the July 11 low). Today (at least at the moment when these words are being written), oil bears didn’t break below this support zone. However, when we take into account the breakdown below the bottom line of the rising channel and the head and shoulders pattern, we may see a bearish scenario: further declines. In this case, the first target for the sellers is around $103 per barrel and the next one is the 38.2% retracement level which coincides with the upper line of the large triangle. Please note that the current corrective move is bigger than the previous one, which is one more bearish factor.
Thank you,
Nadia Simmons
