

As it is quite often said (but just as often forgotten when things get volatile), no market can move up or down in a straight line. There have to be corrections along the way as some traders cash in their profits, others get scared out of their positions etc. The question is – where (at what price) is such a reversal likely to take place. Focusing on news and fundamental analysis alone will not provide you with an answer here, simply because the markets are not logical in the short term, but emotional (it is also the case in the medium term, but to a smaller extent). Consequently, we need to apply technical tools to determine what is the most likely level at which the price will reverse. One of the most useful tools in doing that are the Fibonacci retracements. Out of those retracements, there are 3 classic ones that are very useful for precious metals, currencies and other markets: 38.2%, 50%, and 61.8%. The reason we are writing about the above is that the important 61.8% retracement was just reached in many important markets and the implications are also important. Let’s take a look at the charts for more details (charts courtesy of http://stockcharts.com).
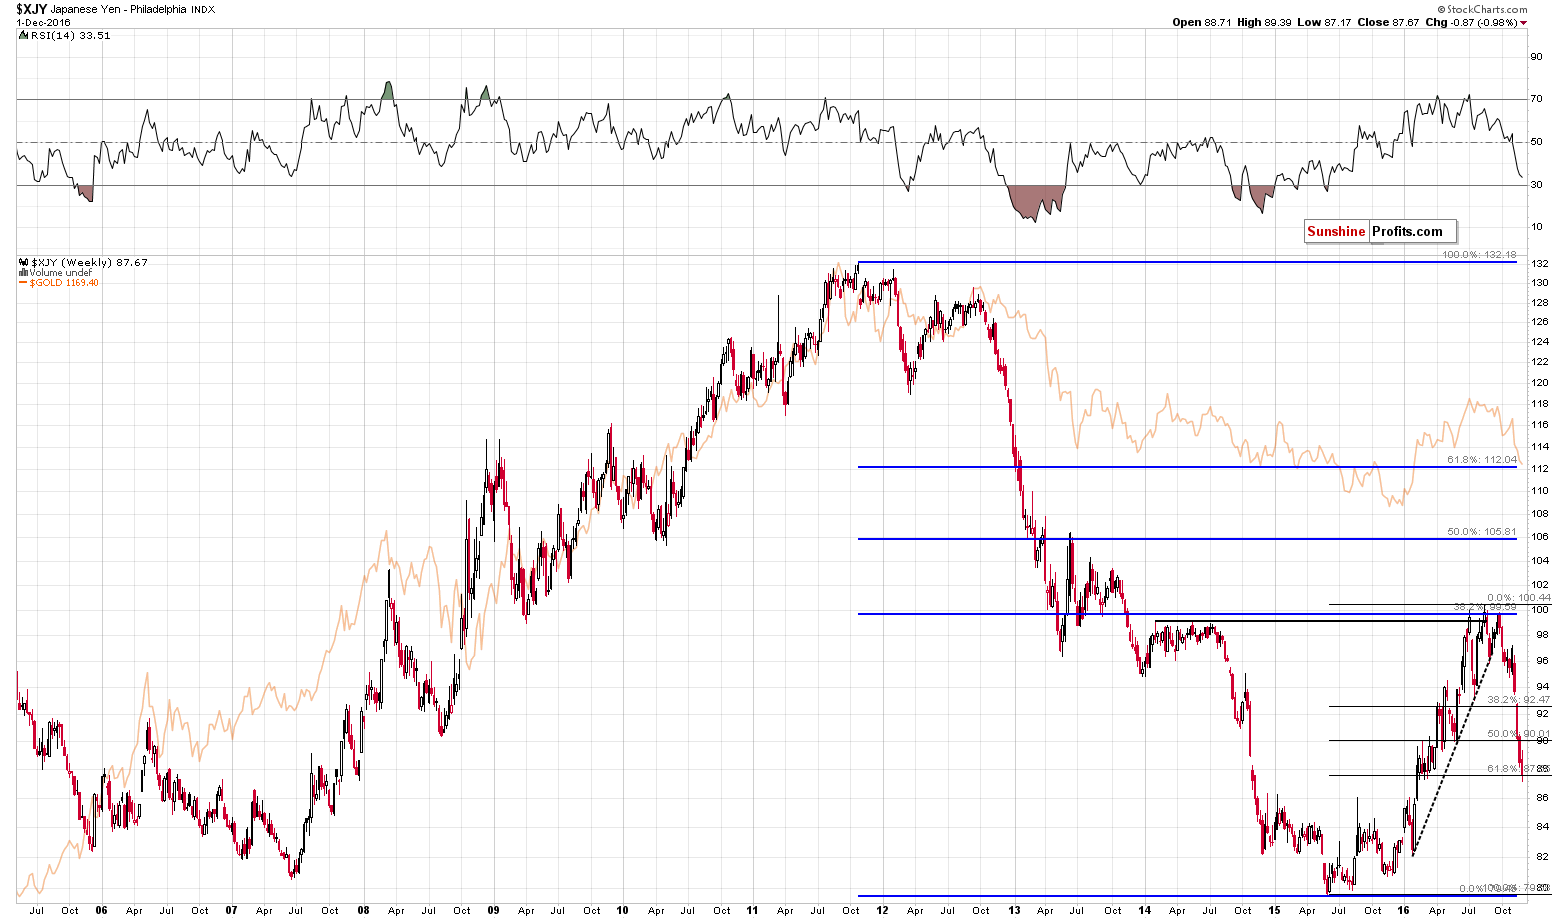
The above chart shows the Japanese yen, which has been moving in tune with gold, especially this year. The decline in yen started when it reached the 38.2% Fibonacci retracement based on the long-term decline (thus confirming the usefulness of the Fibonacci retracements on this market) and it now reached a 61.8% retracement, without a bigger correction since the decline started. This makes a temporary upswing here very likely. Since yen and gold moved in tune, the above also has bullish implications for gold in the short run.
While we’re discussing the Japanese currency, let’s also look at the Japanese stock market, which has been moving in the opposite way to gold.
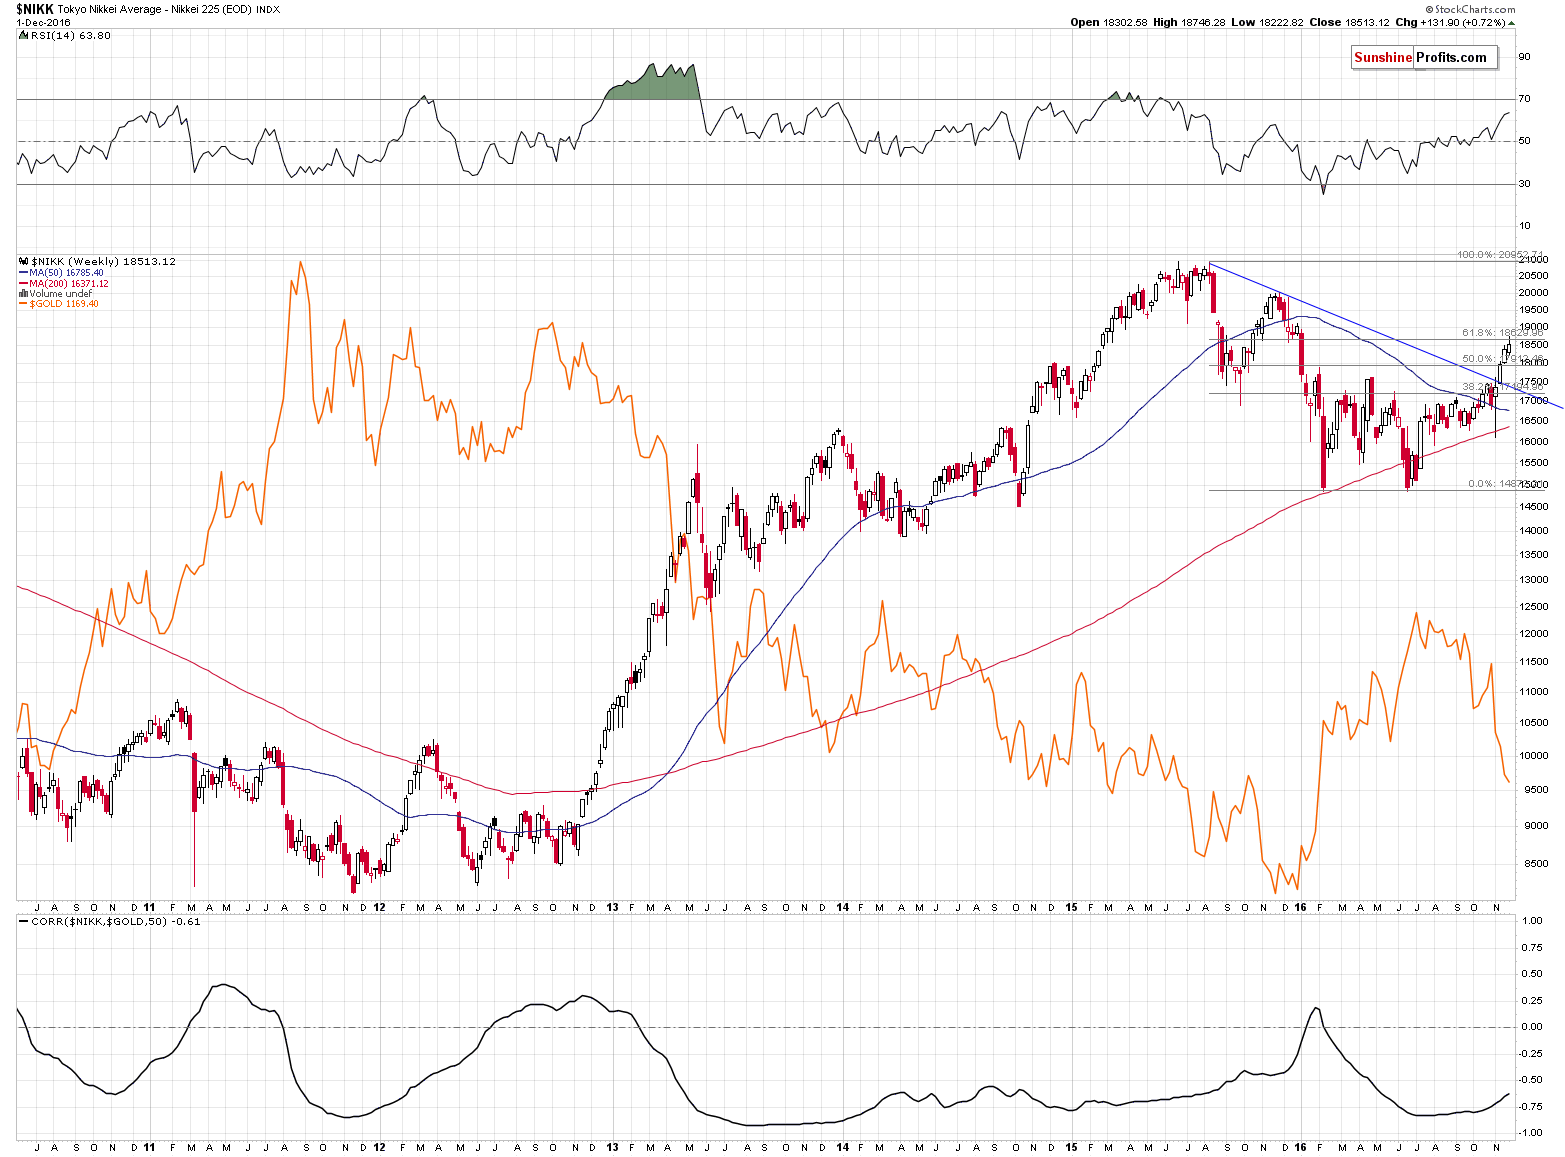
We saw a breakout in the value of Nikkei 225, but it never moved back to the previously broken declining line and we haven’t seen a bigger correction since the rally started in June. With the 61.8% retracement being reached, it’s quite likely that the Nikkei will correct, and thus a short-term rally in gold seems rather likely.
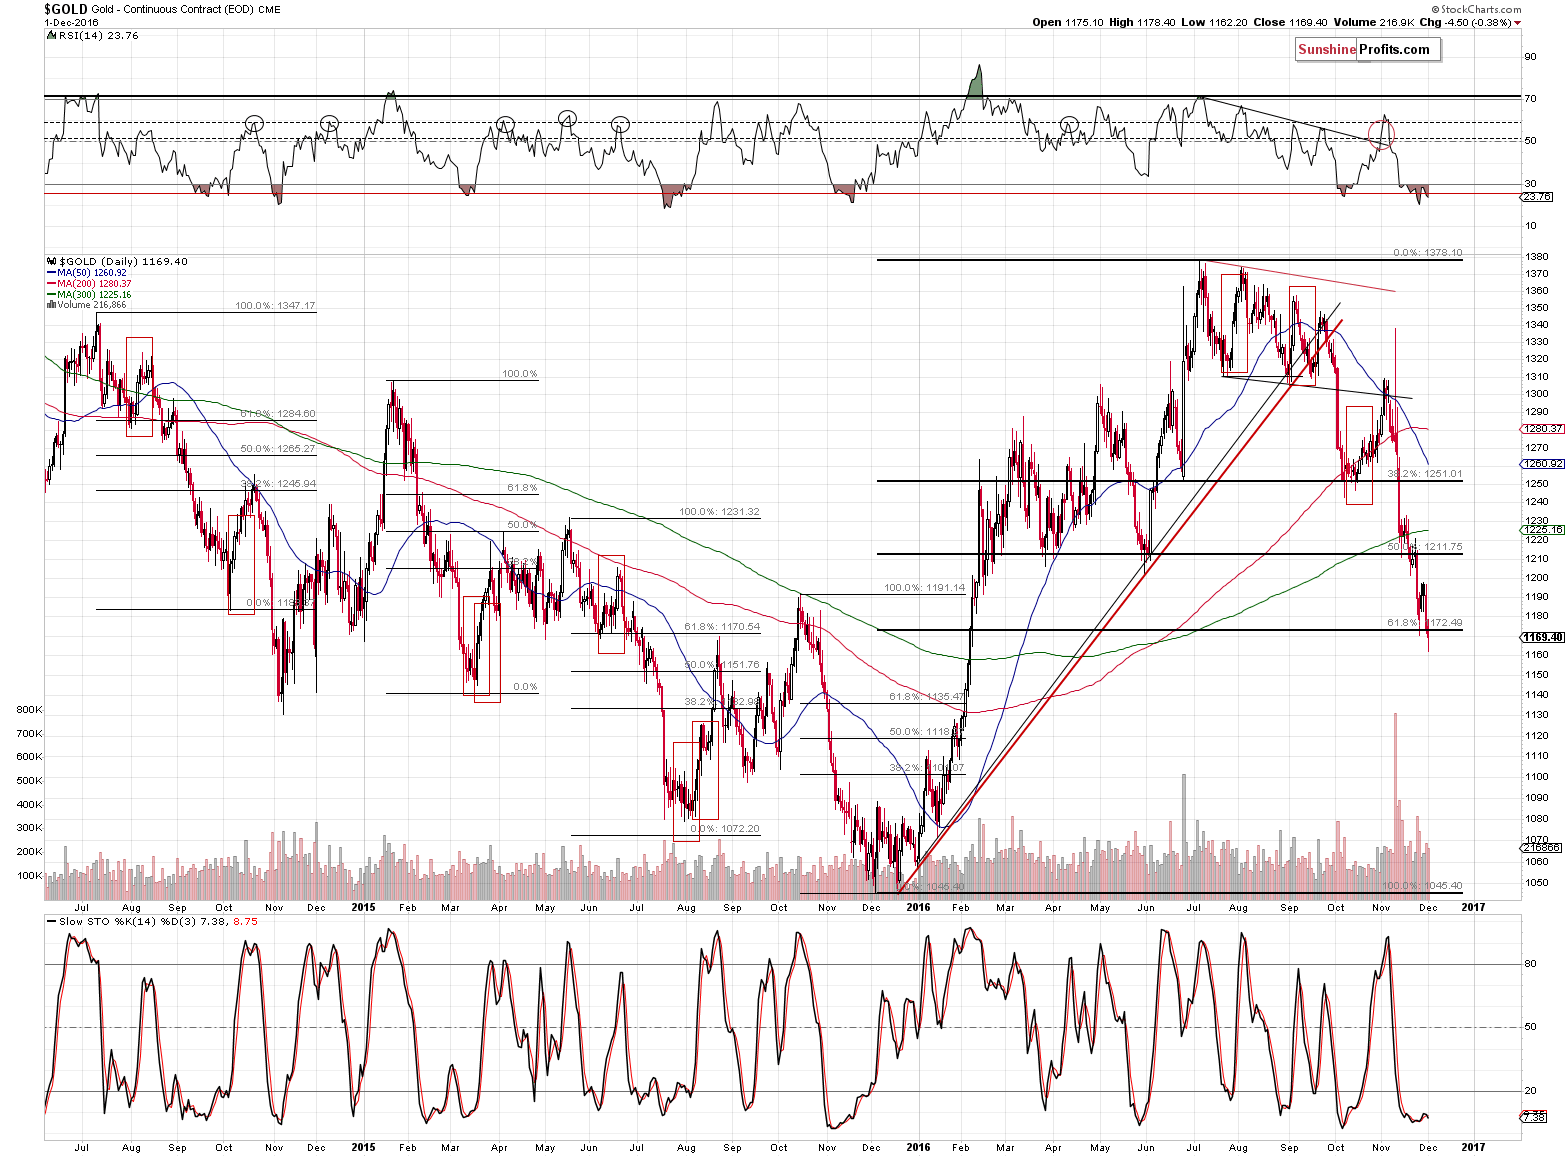
Gold moved to its 61.8% Fibonacci retracement ($1,172) as well and it even attempted to break below it on Thursday. The breakdown was not successful as, at the moment of writing these words, gold is already back above $1,175. Invalidations of breakdowns are bullish phenomena and this one doesn’t appear to be much different.
Besides, mining stocks once again refused to move below previous lows.
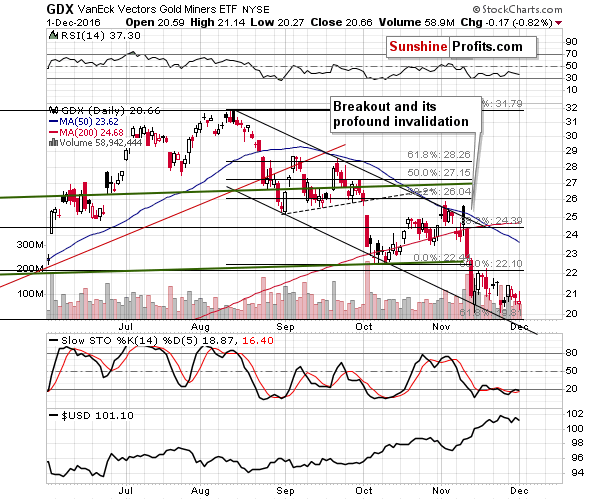
Gold stocks and silver stocks remain below their previous lows and also within the trading channel – there was no breakout, despite a move lower in gold. The strength of the miners is also a bullish sign for the short term (and only for the short term).
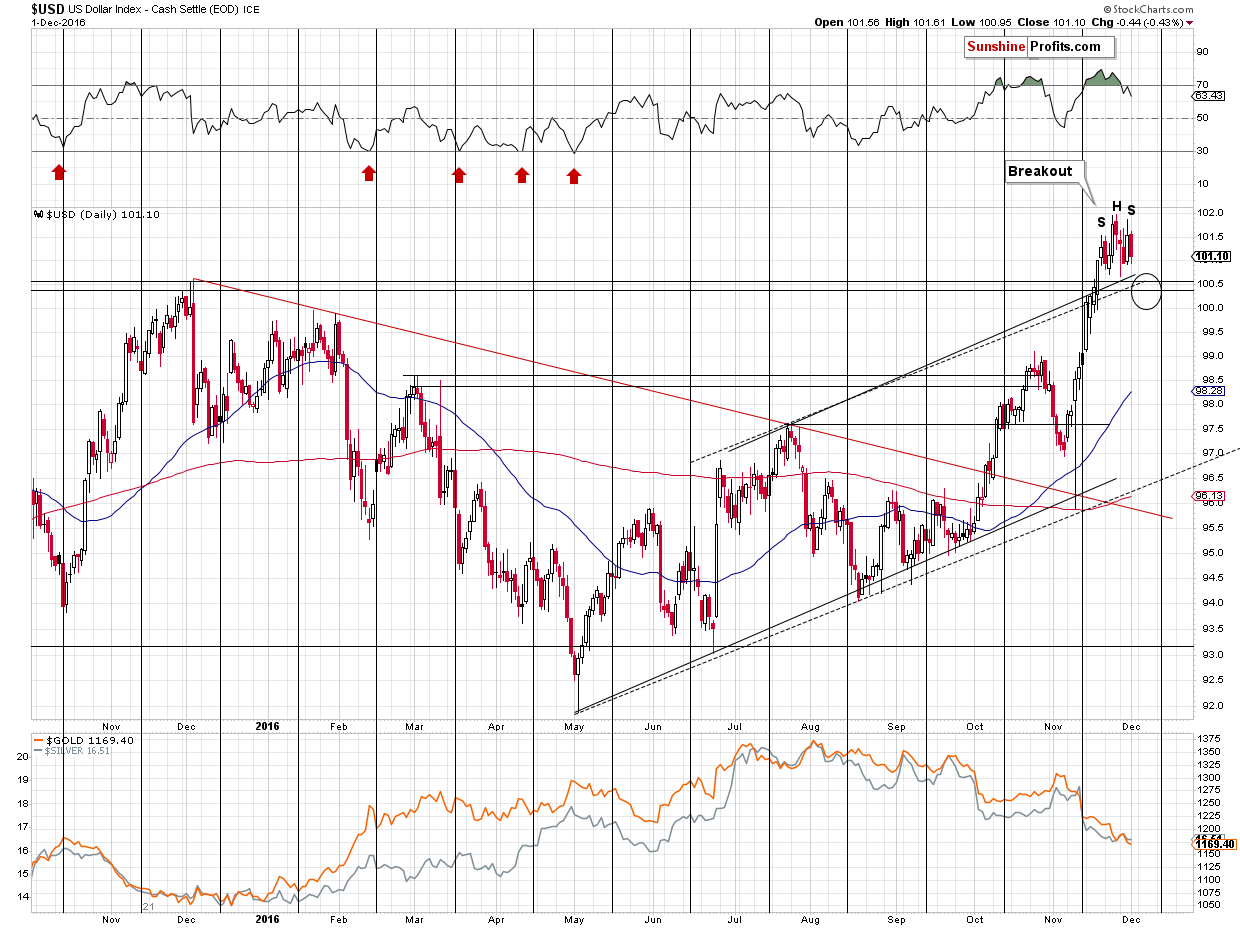
Moreover, the USD Index could still correct in the short term and what we wrote about it yesterday, remains up-to-date:
The USD Index moved higher, but the daily rally didn’t change anything. The correction that we’ve seen recently is still quite small and it doesn’t appear to be enough to cool down the traders’ emotions. Please note that the rally that we saw in October was smaller than the November one and it was followed by a much more significant corrective downswing than what we’ve seen so far. Consequently, it would be natural to expect the corrective downswing to be equal or bigger than what we saw in late October and early November.
Moreover, the last several trading days formed a bearish head-and-shoulders pattern in the USD Index. The implications are bearish and the target – based on the size of the head – is at about 99.50. Still the other support levels suggest that the bottom will be formed higher, so we are not viewing 99.50 as our official prediction, even though it also could stop the decline once it is seen.
Summing up, even though the medium-term trend in the precious metals market remains down (as multiple bearish indications for the medium term remain in place), it appears that a combination of bullish factors (support levels were reached in gold once again, silver and mining stocks showed strength; a long-term resistance level was almost reached in the USD; the 61.8% Fibonacci retracements were reached in the Japanese yen and Nikkei) makes the short-term outlook bullish. It appears that we will see an upswing in the precious metals sector within a week or so.
The above estimations are based on the information that we have available today (Dec. 2, 2016). We will be monitoring the market for opportunities and report to our subscribers accordingly. If you'd like to join them, please use this link to subscribe now.
Thank you.
Sincerely,
Przemyslaw Radomski, CFA
Founder, Editor-in-chief, Gold & Silver Fund Manager
Gold & Silver Trading Alerts
Forex Trading Alerts
Oil Investment Updates
Oil Trading Alerts
