
Based on the November 9th, 2012 Premium Update. Visit our archives for more gold & silver articles.
October could be aptly named the month of corrections, as these seem to have been prevalent – at least in the precious metals sector. They are usually perceived as something bad and unwanted, yet people often forget that they create excellent buying opportunities in the bull market. And we – precious metals investors – do not doubt that this is a secular bull market and that precious metals prices will inevitably move up in the future, due to many fundamental factors that we already discussed in the past – unfavorable economic situation in the U.S. and in Europe, open-ended QE program, and many more.
Now that the correction seems to be over we can truly appreciate the opportunities it created. Let us move to the technical part of today’s essay to make sure that the situation is indeed favorable. We’ll start with gold (charts courtesy by http://stockcharts.com.)
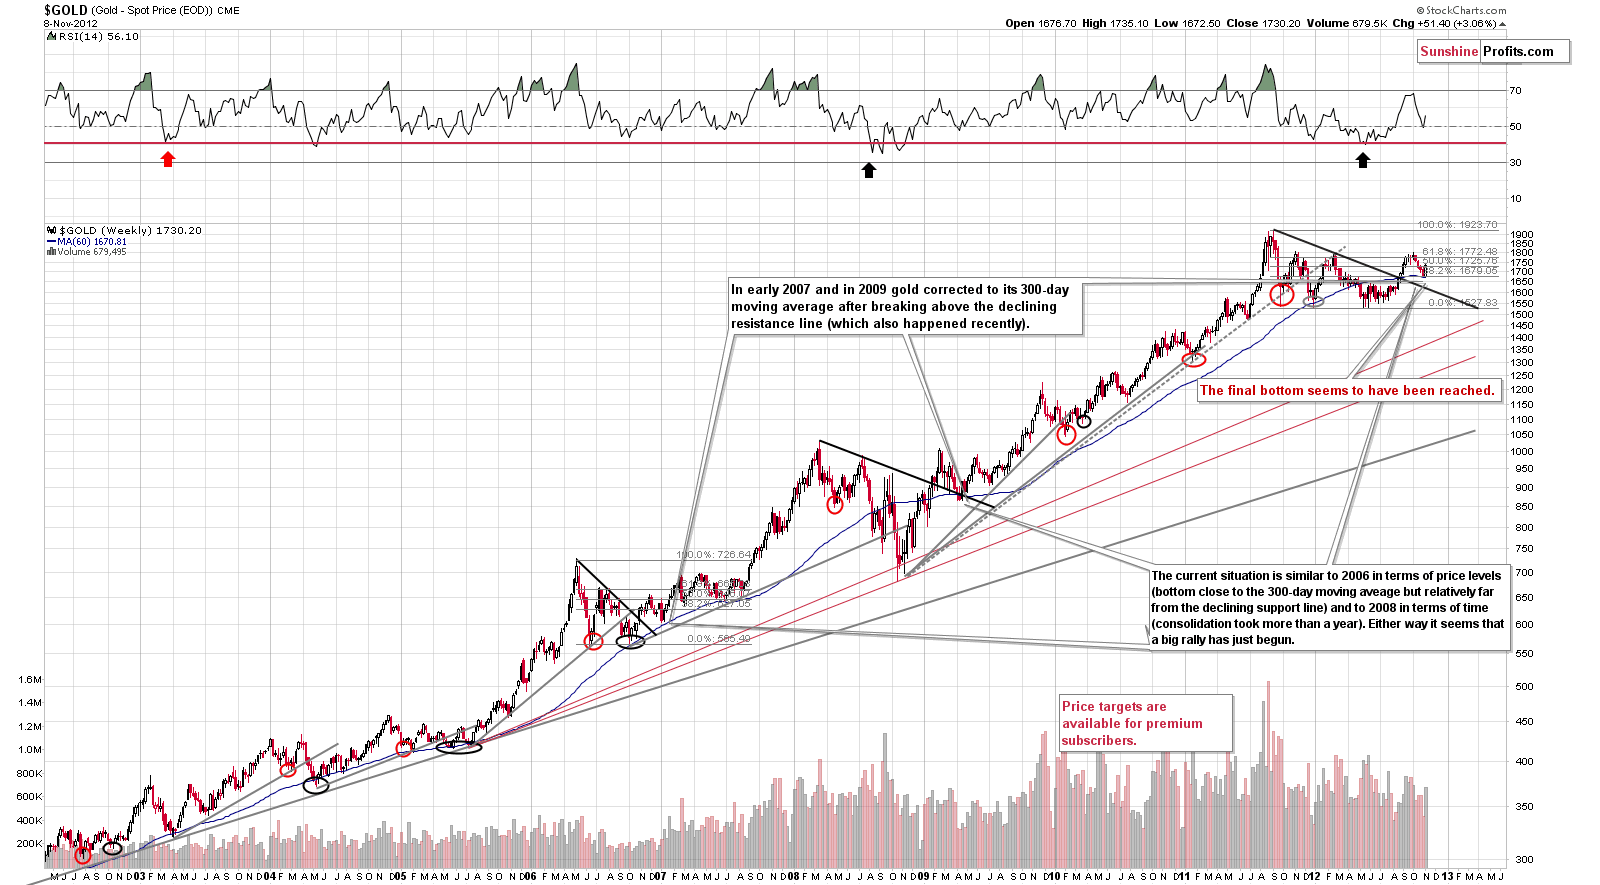
In gold’s very long-term chart, we see that a bottom formed right at the 300-day moving average. This has been seen a number of times in the past, and history has clearly repeated here. Many unusual factors have been in play recently, most notably the open ended Quantitative Easing and European debt crisis and the US elections. This is something that is noteworthy especially if you have begun to doubt technical analysis’ usefulness in the current macro-economic environment. Still, history has repeated itself, and technical analysis principles are present. It continues to pay off to follow them.
RSI levels are now moving higher and this – combined with their non-extreme readings – suggests higher gold prices in the following weeks. The yellow metal is not making headlines as it was in early October and this is good news for investors waiting to open positions and those who – like us – are already long. There appears to be clear upside potential given that we have been through a period of consolidation greater than one year and have charts which appear to be very bullish right now. Prices appear ready to move higher, consolidate when reaching the early October highs, again rally to previous 2011 highs, and consolidate once again. We then expect to see further strength.
Let us now turn to palladium, as its bearish implications for the precious metals sector that we discussed a week and a half ago seem to have just been invalidated.
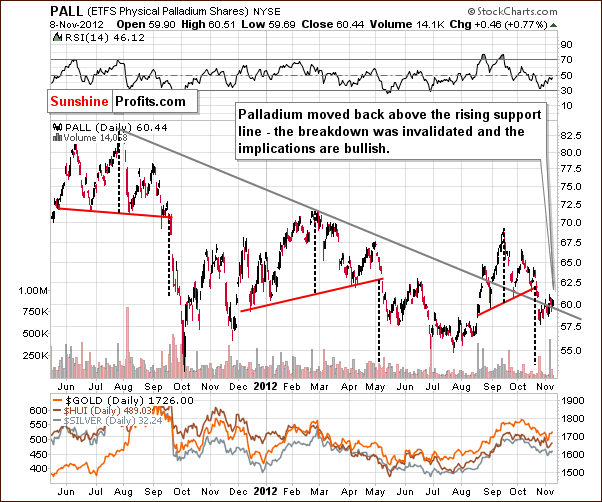
In the chart we see an invalidation of a breakdown below the declining support line, and the picture is once again bullish here. The bearish implications of this chart for the precious metals are no longer present.
Finally, we’d like to draw your attention to precious metals mining stocks, as one important chart that we’ll discuss below indicates that they may prove to be an exceptional investment.
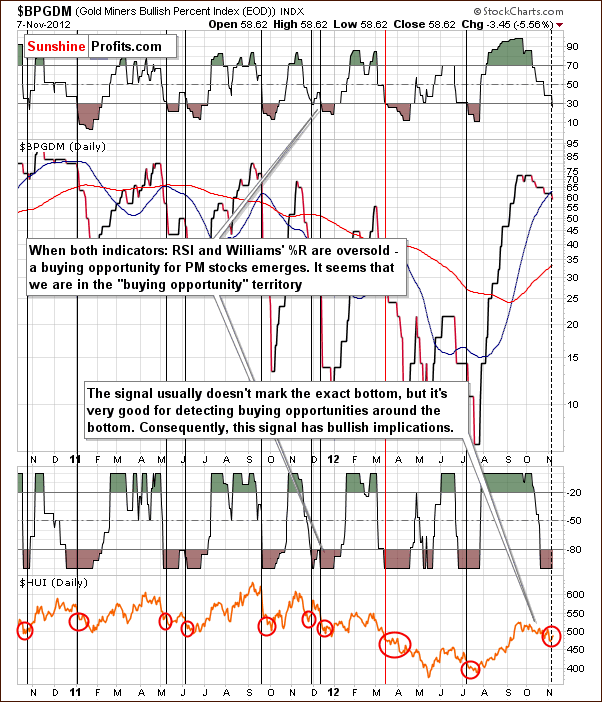
Today we include a chart, which has not been used for some time, the Gold Miners Bullish Percent Index chart. We have been monitoring this on an ongoing basis and it has just flashed a buy signal. This happens when the RSI and William’s %R go into overbought territory. Even though the exact bottom has not been reached, it will likely be reached soon, and this is yet another bullish confirmation.
As a reminder:
The Gold Miners Bullish Percent Index is a market breadth/momentum indicator and is calculated by dividing two numbers: the amount of gold stocks on the buy signal (according to the point and figure chart, which emphasizes strong moves while ignoring small ones) and the amount of all gold stocks in the sector. If every gold stock is rising, then the value of the index will be at 100%, which raises a red flag as everyone interested in the market is already in, and the top will soon emerge. If we're looking at sentiment, substantial momentum usually corresponds to investors eager to jump in at quickly rising prices because they believe prices will continue much higher and are afraid of being left behind. Since the value of the index does not need to be at the oversold levels for a local bottom to form (still it is helpful in timing the major bottoms), we might need to look for additional tools to help us.
If you look closely you will notice two such additional tools in the above chart. The RSI (Relative Strength Index) is a technical momentum indicator that compares the magnitude of recent gains to recent losses in an attempt to determine overbought and oversold conditions.
The RSI also ranges from 0 to 100 with an asset deemed to be overbought once the RSI approaches the 70 level, meaning that it may be getting overvalued and is a good candidate for a pullback. Likewise, if the RSI approaches 30, it is an indication that the asset may be getting oversold and likely to become undervalued. If you look at the RSI indicator in the above chart, you can clearly see that it in fact just moved below the 30 mark.
Another indicator on this chart is the Williams %R, also a momentum indicator that is especially popular for measuring overbought and oversold levels during horizontal trends. Bullish percent indexes take values from 0% to 100% and obviously cannot rise above that level, so it can be viewed as a horizontal trend. Named for its developer, Larry Williams, the scale ranges from 0 to -100 with readings from 0 to -20 considered overbought, and readings from -80 to -100 considered oversold. What I find particularly interesting here, is that the %R indicator has signaled a "temporary oversold" territory only three times in 2009 - and that corresponded to the long-term buying points, and powerful rallies. The last time the %R indicator for Gold miners Bullish Percent index hit the -100 level was during the September bottom - a sizable rally followed. The same signal has just appeared in the recent days, which suggests that we will see PMs higher in the not too distant future.
Currently both: RSI and William's %R indicators suggest that a bottom is in or very close.
Summing up, the situation overall for gold is bullish from the short, medium and long-term perspectives. Long investment and speculative positions in gold appear to be well justified at this time. Also, the Gold Miners Bullish Percent Index combined with the overall situation in the precious metals market make mining stocks a great investment opportunity.
In case you missed several previous updates and messages from us, please note that we recently released several new sections, which you can access free of charge using the following links:
- (make sure that you invest in gold and trade it using appropriate instruments)
- SP Indicators – Details and Performance
- SP Indicators – Stop Loss Details
Please keep in mind that the situation on the precious metals market may change quickly and what you read above may become outdated before you read our next free essay. That's why our premium subscribers receive Market Alerts as soon as anything important takes place - they remain covered at all times. Moreover, our subscribers read full versions of our articles that we callPremium Updates - they are much more in-depth and thorough than free commentaries posted in this section, so by reading them you are better and earlier prepared when major changes regarding gold and silver occur. Premium Updates include price targets and trading suggestions as well. Our subscribers also enjoy up-to-date and tailor-made (!) gold stocks ranking, silver stock ranking and more. Traders particularly value the ability to track the accurate SP Indicators dedicated to the precious metals market without the weekly lag. We encourage you to join our subscribers and also enjoy all of the above-mentioned benefits.
Thank you for reading. Have a great weekend and profitable week!
Przemyslaw Radomski, CFA
Back