
Last week the price of silver climbed to $23.45 after U.S. Federal Reserve Chairman said its huge stimulus program would stay in place. In our previous 2 essays we focused on two important links: the one between gold and oil, and the one between gold and the USD Index. In the latter we wrote the following about gold:
As you see on the above chart, gold verified the breakdown below the long-term resistance line created by the July 2005 and the October 2008 bottoms (taking intraday bottoms into account). At this point, it’s worth noting that there was an invalidation of the breakout above the 38.2% Fibonacci retracement level based on the September 2012 - June 2013 decline earlier this month. This was a bearish sign.
From this point of view, it seems that even if gold increases once again in the coming days and reaches the above-mentioned levels once again, the medium-term outlook will continue to be bearish.
Please note that in 2008, when gold moved higher before plunging for the final time, there were several intra-week attempts to move higher after which gold finally declined. Therefore, a double top pattern should not surprise us here. The same goes for a triple top.
Gold has declined since the above was posted, so the medium-term downtrend definitely remains in place. In today’s free commentary we will focus on other parts of the precious metals sector: silver and palladium. After all, it is usually the case that the most important price moves are seen simultaneously in all precious metals, so by comparing different metals‘ performance we could spot some confirmations or invalidations of the above.
Let’s take a look at the charts and find out what the current outlook for silver and palladium is. Today we will start with the analysis of silver from the long-term perspective (charts courtesy by http://stockcharts.com).
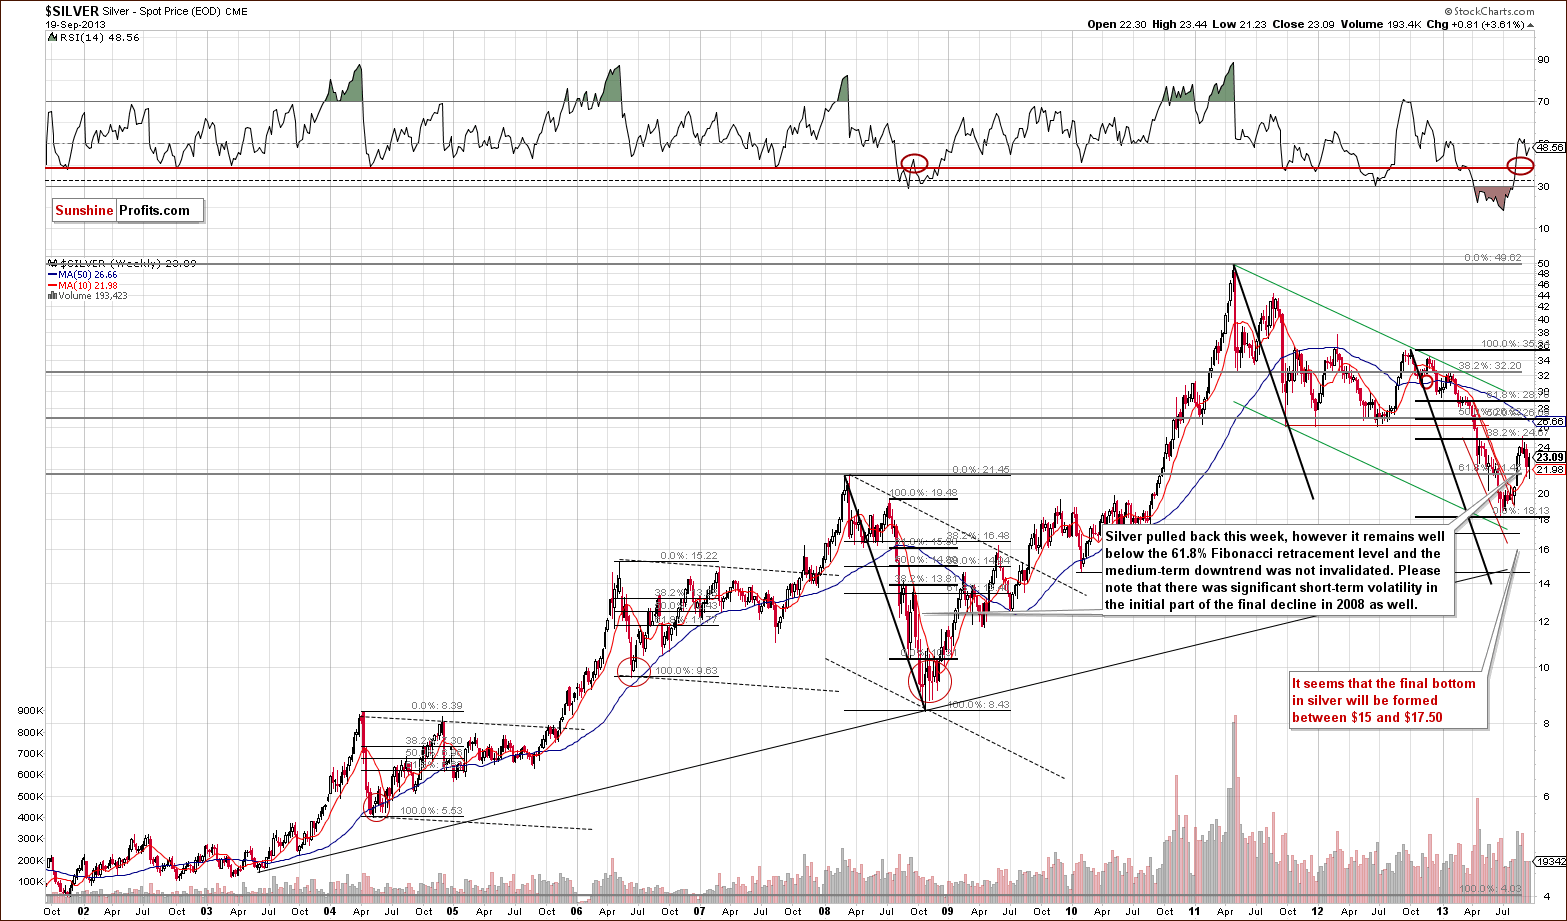
When we take a look at the above chart, we see that silver pulled back last week, but in spite of this upward move, it still remains visibly below the 32.8% Fibonacci retracement level based on the entire September 2012 – June 2013 decline.
Taking this into account, the medium-term downtrend was not invalidated. In fact, from the long-term perspective, the pullback was barely visible – the most recent move that we can see on the above chart is this month’s decline.
To see more details, let’s move to the short-term chart now.
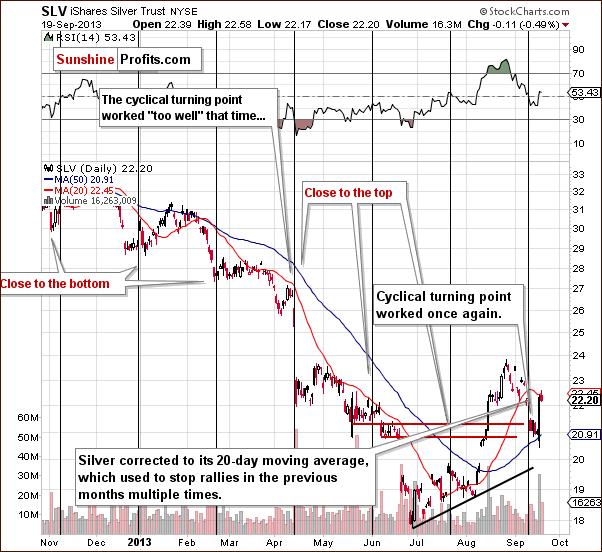
On the above chart, we see that silver pulled back after the cyclical turning point and reached the 20-day moving average last Wednesday. As you see on the daily chart, this moving average was seen to stop rallies multiple times in previous months.
In the recent days, history repeated itself and we saw a downward move. With this correction silver erased almost all last week’s gains and dropped below $21, which is not a positive sign for silver bulls.
In spite of last Wednesday‘s rally, the situation hasn’t changed much. From today’s point of view we see that silver moved up right after the cyclical turning point (after comments from the Fed, which were an important indicator, but perhaps the proximity of the turning point was what made this upswing so significant) and it seems that what was likely to happen based on it has already happened. Consequently, it seems that the medium-term trend in silver is still down.
Once we know the current situation in silver, let's find out what has recently happened with palladium and where it is right now.
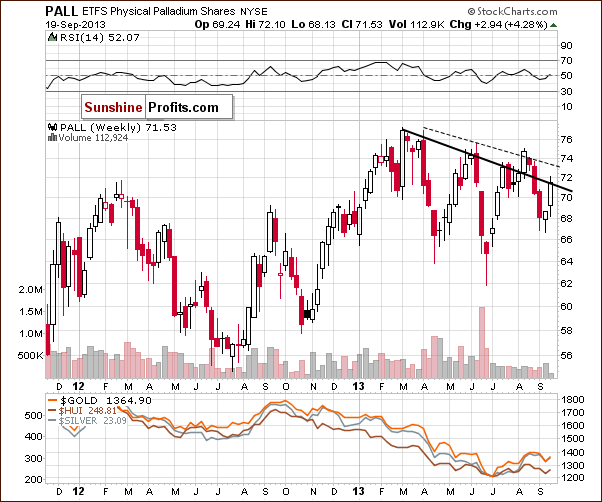
On the above chart, we see that palladium declined slightly below the 68 level; however, the metal has pulled back and we’ve seen a rally over the past several weeks, which took it to the previously-broken declining resistance line based on the 2013 top and the May peak (in terms of weekly closing prices).
There was no upward move above this line in the previous week; therefore the breakdown that we saw at the end of August was not invalidated. Additionally, the price of palladium decreased on Friday and closed the week well below the declining resistance line. On Monday, we saw further deterioration and the price dropped below the 70 level. In spite of yesterday’s small pullback, the breakdown was still not invalidated.
Summing up, the recent upward move in both metals was not as bullish as it seemed at first sight and the breakdown in palladium was not invalidated. The implications are still bearish and the bearish case for gold that we made in our previous essay seems to be confirmed by what we see in the silver and palladium markets. At the same time please keep in mind that the analogy to the 2008 decline is still in place and a small move higher should not surprise us (such as the one that we are seeing today). Please note that we mean only the medium term as far as the bearish outlook is concerned – we are still bullish on the entire precious metals sector over the very long term due to the positive fundamental situation.
=====
In other news, yesterday we wrote about our two new products: Oil Investment Updates and Oil Trading Alerts (and subscribers to the latter have already receive the above-mentioned alert several minutes ago). Today we have another major announcement. We are starting a preview of another premium product: Stock Trading Alerts. Stock Trading Alerts are a new type of service dedicated to day-traders, as there will be at least 4 alerts posted on each trading day. Until the end of the week, this service will be in the preview mode - you will have access to it, however, since it's a lot of messages (at least 4 additional messages per day), we will not send you notifications automatically (we don't want to send so many messages that you might not be interested in). Consequently, you can go to the Stock Trading Alerts section on our website every few hours (the first alert will be posted before the markets open, two during the session and the final soon after the markets close). You can also tell us to send you our Stock Trading Alerts via email - and we will. This way you will have a more real-time trial of the service. Stock Trading Alerts section
Thank you.
Przemyslaw Radomski, CFA
Back