

Bitcoin Trading Alert originally sent to subscribers on August 1, 2016, 11:14 AM.
In short: short speculative positions; stop-loss at $657; initial target at $527.
Does Bitcoin correlate to gold? This is the kind of question Bitcoin enthusiasts pose to themselves. As it turns out, the question might be surprising to a lot of people who claim that the two are very similar. In an article on CoinDesk, we read:
An analysis of historical market data conducted by ARK Invest's Chris Burniske failed to illustrate a strong relationship between the two.
Burniske's analysis revealed that when examined on a weekly basis, the one-year rolling correlation of bitcoin and gold's returns was positive for nearly the entire period between 30th December, 2011, and 20th June, 2014.
However, this correlation averaged 0.14 during the period, pointing to a rather weak relationship.
While a correlation coefficient of 1 would indicate their returns followed each other perfectly, a correlation of zero would indicate there was no relationship at all. Since the figure of 0.14 is rather close to zero, it points to a very flimsy relationship between the returns of gold and bitcoin.
On 27th June, 2014, the rolling one-year correlation between bitcoin and gold became negative, staying that way for almost the entire period between then and 24th June, 2016.
The correlation averaged -0.20 during this time, once again failing to illustrate a strong relationship between the two.
The results are generally not changed by switching to weekly or monthly data, in the sense that the correlation between the two was not significant, no matter which kind of data you choose. Also, the sign of the correlation changes depending on what time window we look at or what kind of data we use. This means that the relationship between gold and Bitcoin can change from one where gold and Bitcoin tend to move in the same direction to one where they move in opposite directions. This, in turn, suggests that the relationship between the yellow metal and the digital asset is not necessarily a stable one.
The article mentions that the correlation tends to go up in times of crisis, however, this doesn’t seem to be particularly useful as the correlations between asset classes in general tend to spike in such times. The trend doesn’t have to do anything with Bitcoin or gold – it might be a reflection of panic in the market and traders selling out of their positions and moving to cash or instruments perceived as cash.
For now, let’s focus on the charts.
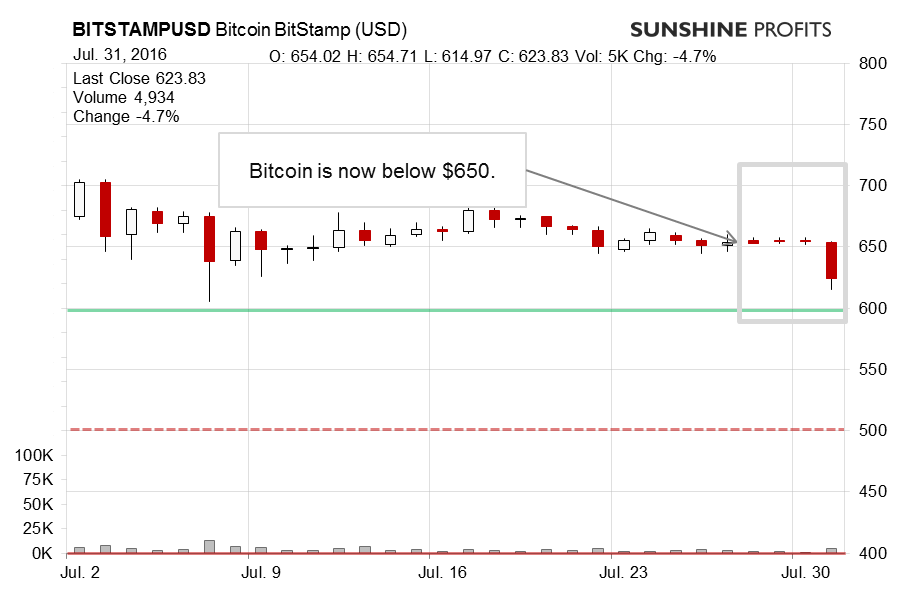
On BitStamp, we finally saw a day of decisive action yesterday. Bitcoin moved visibly below $650. Is this the move we’ve been waiting for? Recall our recent comments:
The general idea hasn’t changed much. Bitcoin is still at $650, which might be an important level (...). One possibly significant bullish hint is that Bitcoin didn’t decline following the announcement of the halving of mining rewards. This might be a show of strength. The recent volume, however, has on the downside, which suggests that Bitcoin is yet to move a significant move in either direction from $650.
The delicate move down made the situation slightly more bearish, nullifying some of the previous upswing. The general picture remains. Bitcoin is in a bearish position but not quite bearish enough to go short just now. A breakdown below the 61.8% Fibonacci retracement level could be a trigger here.
Bitcoin is now above $650 but not much has changed. We still have room for declines but there is no indication that the move has already started. This might change in a matter of days, as even one day of strong action below the Fibonacci retracement might serve as a bearish confirmation.
We see that this is still unfolding and that the downside potential is still there. The fact that Bitcoin hasn’t moved yet might have to do with the fact that the currency is still above $650. If we see a move below that level, and it holds, this might be the trigger we’re waiting for.
And we actually saw a move below $650. Not only that, but also the currency might be moving below its recent trend based on the May-June rally and the late post-rally local bottom. As far as the move below $650 is concerned, we have only seen one daily close below this level (possibly two if we count today) but based on the magnitude of the move, we might view the slip down as confirmed.
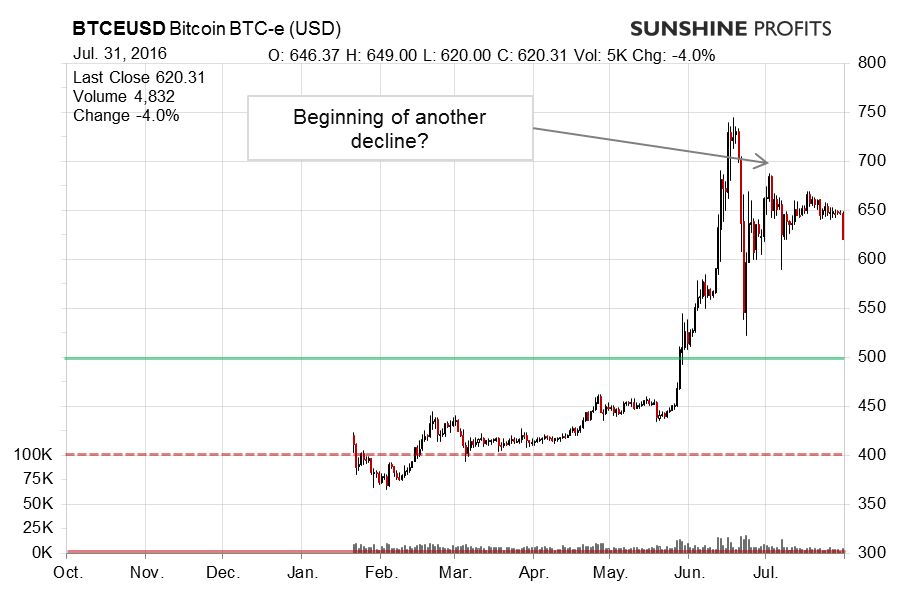
On the long-term BTC-e chart, the beginning of the next move down might actually be visible. Bitcoin is below $650 and might be moving below the recent uptrend. Our previous comments:
The 38.2% Fibonacci retracement level is still very much in play. We haven’t seen a move below this level just yet. At the same time, we haven’t seen a move above the $700 level which might be the next important level on the upside. As such, the situation still has a bearish tilt in our opinion, but it’s not enough to go short just now.
The last couple of days actually look like a possible local top. We might see a sort of triple top with each consecutive top being lower than the previous one. This would be a bearish indication. The level at which the move might accelerate is still around $650. A move below this level might be an indication that a stronger decline would follow. This is not the case yet.
(...) The current reading of the RSI is at around 50 which indicates that there still is room for declines going forward. The level to observe is still $650 as it coincides with the Fibonacci retracement and it might be a point at which the decline accelerates, in our opinion. We haven’t seen this just now.
The situation changed yesterday with the depreciation. Not only did Bitcoin go below $650 but it also closed visibly below the 38.2% Fibonacci retracement level. The situation now is a lot more bearish than it was only a couple of days before. At the same time, we still have some room for declines based on the RSI. If we don’t see a strong move above the broken 38.2% level, the situation might remain bearish.
Summing up, in our opinion short speculative positions might be favorable at the moment.
Trading position (short-term, our opinion): short positions; stop-loss at $657; initial target at $527.
Thank you.
Regards,
Mike McAra
Bitcoin Trading Strategist
Bitcoin Trading Alerts
