

Bitcoin Trading Alert originally sent to subscribers on May 23, 2016, 12:58 AM.
In short: short speculative positions, target at $153, stop-loss at $515.
Bitcoin has enjoyed a spell of decreased volatility which has led some commentators to draw parallels between the currency and other asset classes, gold being an example. On the Wall Street Journal website, we read:
In April, volatility in bitcoin’s price fell below that of gold for 28 consecutive days, the longest period in its history. Bitcoin volatility also briefly dropped below that of another flight-to-safety trade, the Japanese yen, according to data from FactSet and CoinDesk.
Bitcoin has become popular for fast, anonymous transactions. The number of bitcoin wallets, or electronic accounts used for paying with the cryptocurrency, doubled in 2015 to more than 12 million, according to data provider CoinDesk.
The cryptocurrency has also attracted traders looking to profit from its sometimes volatile price movements. The New York Stock Exchange tracks bitcoin’s price, and the derivatives marketplace CME Group said this month it is developing a bitcoin spot-price index.
Bitcoin is certainly gone through a phase where its volatility pales in comparison with the wild moves we saw in the past. But does this mean that the digital currency is really a tame animal? We do not think so.
Without a doubt, Bitcoin has progressed from its early days and as its market cap is growing, the currency seems less prone to the types of swings we are now seeing in Ether. On the other hand, it is still very far from being an established asset in financial markets, just as digital currencies as far from being an established asset class. We still are of the mind that the Bitcoin market is driven by emotions to a greater extent that traditional financial assets.
This might mean that the low volatility we are seeing now is not necessarily what we will see in the future. Looking at a very isolated period in the whole history of Bitcoin is not an indicator of how it might do in the future. Not so long ago, in the period from December to January, Bitcoin went from $450 to $350 (a more than 20% slump). So, it’s better to be on the safe side when thinking about Bitcoin volatility.
For now, let’s focus on the charts.
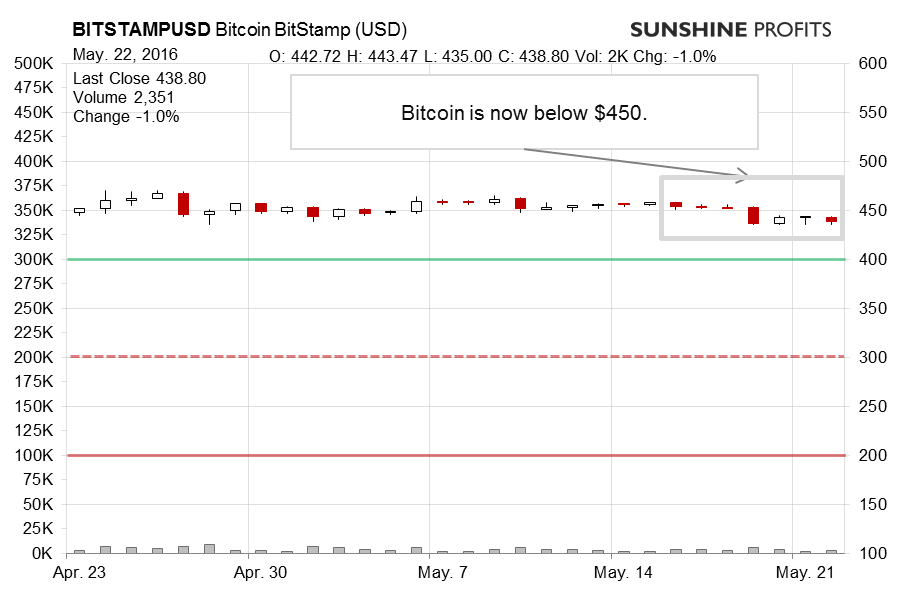
On BitStamp, we saw a move below $450 on Thursday and both the magnitude and the volume of the move were significant in comparison to what we had seen before. Recall what we wrote in our previous alerts:
The most important bullish indication is that Bitcoin is now above a possible long-term declining resistance line. This itself makes us reconsider the current position. However, a look at past situations shows that the implications are not as clear. Not all moves above a long-term resistance line resulted in appreciation in the past. Actually, a recent case when Bitcoin moved above the line was in February and the move was followed by declines. There were other cases like this, for instance in May-June 2014.
The move yesterday is a confirmation that the recent appreciation might not be anything more than part of a correction within a long-term downtrend. Today, we have seen relatively volatile action – the volume is already almost as high as it was at the close yesterday (…). We haven’t really seen a decisive move down but the volatility of the move and the lack of a move up suggest that we might be on the cusp of a move down.
The situation is now similar to what we saw yesterday, possibly slightly more bearish as Bitcoin closed below $450. While this is far from sure, it might be sign that Bitcoin is on the verge of moving more significantly.
We are still of a mind that a move below $450 might be the trigger of another move to the downside. This is even more the case as the weak appreciation of the last couple of days has taken place on low volume.
Now that the breakdown below $450 is confirmed, the situation became more bearish. There’s more to this move Bitcoin seems to have broken not only below the $450 level but also below a possible rising support line based on the August 2015 low and the early March bottom. Couple that with the fact that we’re particularly close to oversold territory and the situation is now the most bearish it has been in a couple of weeks.
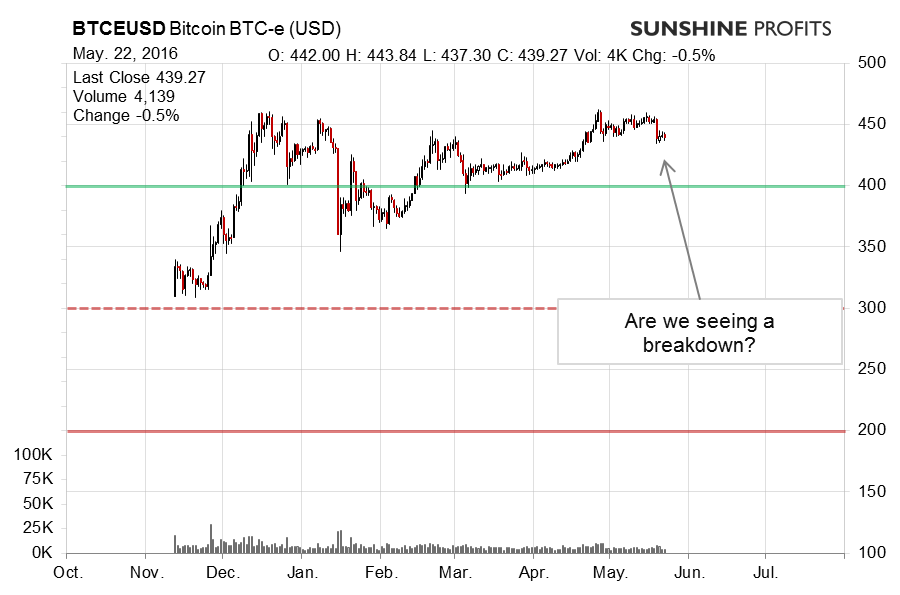
On the long-term BTC-e chart, we see a possible breakdown below $450. This might be the beginning of the next big move. It’s not certain, of course, nothing in the markets is but it seems that a more sizeable decline might follow. Recall our recent comments:
The currency is now above $450 but this doesn’t mean that the situation is bullish. Actually, Bitcoin is still at a possible declining long-term resistance line which is around $460. So, even though we saw a move back to $450, the move might be stopped by the resistance line. This suggests that any appreciation now might be limited and that the situation is still very much bearish.
Bitcoin is not oversold. Actually it’s out of the overbought territory and it very much looks like the currency is after a local top and possibly on the cusp of yet another move lower. The level of $450 also coincides with a possible rising resistance line based on the August low and the March local bottom. This suggests that any break below $450 might result in increased volatility. Another thing is that the next possible resistance level is around $400 and not a very strong one. This means that the next move down might not only be volatile but also possibly steep.
This is very much up to date. The very weak move up we have seen in the last couple of days is not a bullish confirmation in our opinion. Another bearish hint is that we are right at the December-January highs which might be an additional push against future appreciation.
We are now seeing a move below $450 which might be a sign that Bitcoin is headed lower. The next possible resistance levels are $400, $380 and $350 and Bitcoin could pause anywhere between $400 and $350. Our take, however is that the levels to observe are $350 and $300 as they are both based on more significant local bottoms.
Summing up, in our opinion speculative short positions might be the way to go now.
Trading position (short-term, our opinion): short speculative positions, target at $153, stop-loss at $515.
Thank you.
Regards,
Mike McAra
Bitcoin Trading Strategist
Bitcoin Trading Alerts
