

Bitcoin Trading Alert originally sent to subscribers on April 18, 2016, 8:08 AM.
In short: short speculative positions, target at $153, stop-loss at $515.
Remember how Ethereum was touted as the system which could replace Bitcoin and its price skyrocketed? Now, the system is back down after Ether (the currency of the system) lost more than 50% of its value, we read on CoinDesk:
While bitcoin has seen range-bound prices, ether plunged more than 56% during the week ending 15th April at 12:00 UTC, according to Poloniex figures.
George Samman, blockchain advisor and consultant, described the development as one that had been foreshadowed by changes in market fundamentals.
"Ether has fallen back to earth for sure," Samman told CoinDesk. "Its technicals were deteriorating for a while and finally price fell with them."
Christopher Burniske, analyst and blockchain products lead at investment management firm ARK Invest, spoke to the currency’s selloff, noting that exchange data signaled a shift was forthcoming as well.
"The sell order book on [digital currency exchange] Poloniex has consistently been 30-50% deeper than the buy order book," he told CoinDesk.
But while ether has been suffering sharp price volatility, it has also been experiencing robust transaction activity.
The currency’s daily trades neared 35,000 on 14th April and remained above 30,000 during the several days prior. Since mid-March, these daily transactions have almost always stayed above 30,000.
Does this mean that “Ether is done?” By no means. A plunge of such magnitude is nothing unusual after the kind of appreciation Ether had seen before. Remember how Bitcoin went on to above $1,100 and then plummeted to below $400 in a matter of weeks. This didn’t mark the end of the currency, so the same might be the case with Ether and we would definitely not proclaim it “finished.”
All this shows that in the world of digital currencies volatility is still very high and violent swings are nothing out of the ordinary. As such, digital currencies might command relatively high risk premia. This is still the case, even with Bitcoin, in spite of the fact that the currency has remained within a relatively narrow channel. Make no mistake, the fact that Bitcon hasn’t moved much recently is no indication that this will continue into the future.
For now, let’s focus on the charts.
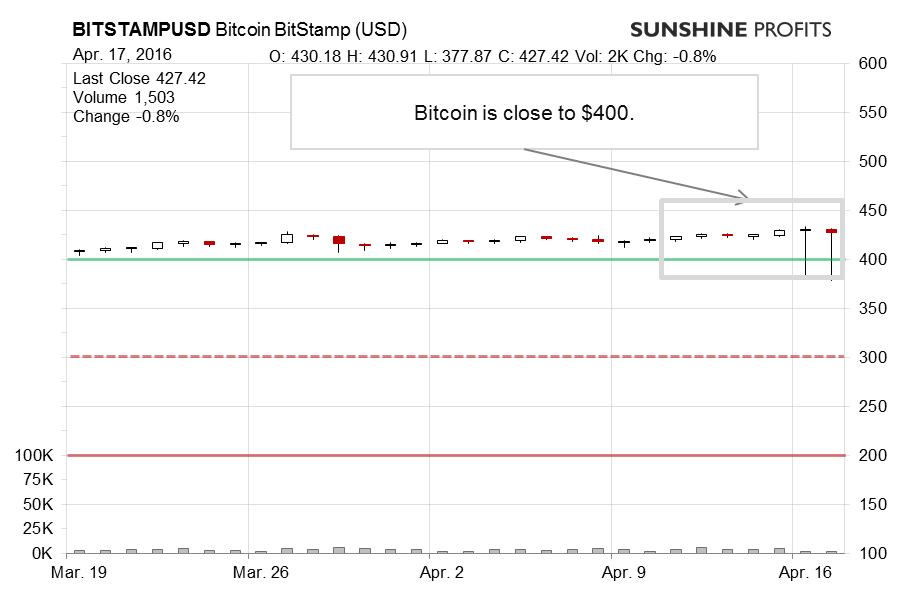
On BitStamp, we saw a curious pattern yesterday and on the day before. Bitcoin supposedly traded in a wide range, even briefly going below $380, but on low volume. We write “supposedly” as this pattern depends on the data provider. Data from one venue suggests that there was indeed a slip below $400. Data from another doesn’t show such a slip. Since this is rather anomalous, we would suggest additional caution while trading on BitStamp. At the moment, it seems that the supposed move below $400 is a quirk as the depreciation was brief and quickly reversed (if we were to believe that the slip was real). This action doesn’t suggest that a decline is already underway as we can’t really treat it seriously. What is serious is the suggestion to remain cautious with BitStamp, and possibly wait out the current period to see if the prices stabilize and become unified among different data sources.
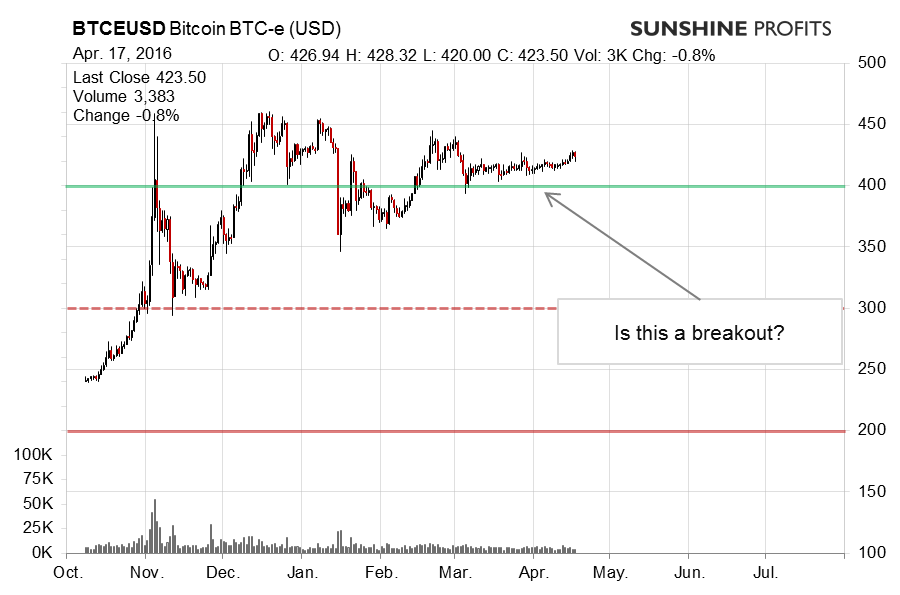
Given that we didn’t see an analogous slump on BTC-e, we are inclined to assess that the situation remains largely unchanged and the decline in the Bitcoin market hasn’t started yet. Actually, Bitcoin is now above a possible declining long-term resistance line. Is this a bullish hint? Not necessarily. We have seen such a move invalidated in the recent past. The volume doesn’t support a move up, so our best bet at the moment is a decline back in line with the general trend. As such, the situation remains largely unchanged compared with what we wrote in our previous alert, if slightly less bearish:
(…) Bitcoin is now visibly above the 50-day moving average. Is this a bullish indication? Not really. It only shows that Bitcoin is not moving below this average at this time, so it slightly weakens the bearish outlook for the very short term but it might not have any implications for the medium term. Bitcoin is still at a possible declining long-term resistance line without a visible breakout above this line. At the same time, the RSI is still in the middle of the range. The one indication that is becoming increasingly bearish is the low volume which suggests that the recent weak appreciation is not really a “trend” move but rather part of the countertrend correction.
The situation also got a bit tenser in the sense that we see Bitcoin moving up slightly on low volume and above a possible declining trend line. This is actually a bearish indication.
Summing up, in our opinion speculative short positions might be the way to go now.
Trading position (short-term, our opinion): short speculative positions, target at $153, stop-loss at $515.
Thank you.
Regards,
Mike McAra
Bitcoin Trading Strategist
Bitcoin Trading Alerts
