
Based on the December 13th, 2013 Premium Update. Visit our archives for more gold articles.
This week was full of action for precious metals investors and traders. Gold, mining stocks, and (especially) silver rallied in the first days of the week only to disappoint on Wednesday and Thursday. No wonder; the rally didn’t have “strong legs” as gold’s strength was meager compared to that seen in the euro – another USD alternative.
In today’s essay we will provide you with 3 gold-related charts (courtesy of http://stockcharts.com), each will tell a different story about gold’s performance, but ultimately, they will all point in the same direction – the direction of another move lower in the price of gold.
Let’s start off by taking a look at the chart featuring gold priced in the British pound.
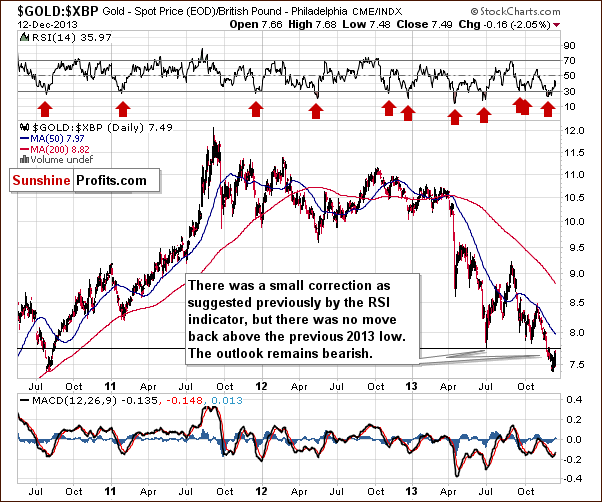
As far as gold priced in the British pound is concerned, we saw a verification of the breakdown below the previous 2013 low, nothing more. The outlook remains bearish.
Even though we saw rally in USD terms, and it looked quite bullish at the first sight, keeping an eye out on gold priced in other currencies warned that not everything about that rally was so bullish. It was not a true rally, but a verification of a breakdown.
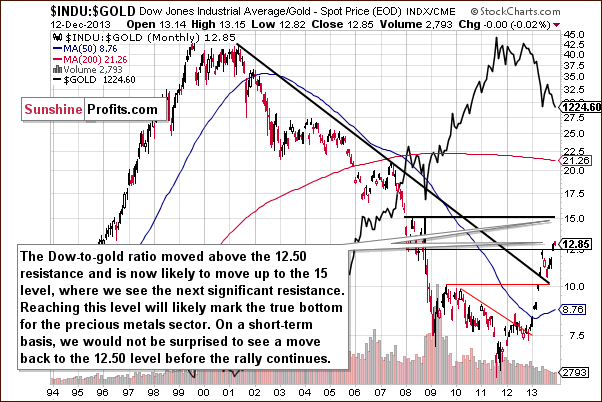
We can say an analogous thing about the Dow to gold ratio. In this case, we had previously seen a breakout and this week we simply saw verification thereof.
Last week we wrote the following:
That’s one of the most important and useful ratios there are as far as long- and medium-term trends are concerned. In particular, the big price moves can be detected before they happen (note the breakout in the first months of the year that heralded declines in gold).
We saw a breakout above the 12.5 level 2 weeks ago and shortly thereafter we wrote that with the ratio even higher today, we have a good possibility that the breakout will be confirmed and that we will see a big drop in the price of gold in the coming weeks or months.
The ratio moved even higher last week and this and it’s already at 13.03. However given the sharpness of the most recent move up, we wouldn’t be surprised to see a correction to the previously broken 12.50 level before the upswing continues.
The Dow to gold ratio moved slightly lower earlier this week, which didn’t change anything as it remained above the previously broken 12.50 level. The bearish implications remain in place.
The True Seasonal patterns have given us a hint that this week’s rally was likely a temporary move before another significant decline. In the second Market Alert that we posted on Dec 10 we wrote the following:
Additionally, the True Seasonal patterns suggest a final move higher between Dec 8 and Dec 11 after which gold usually declines well below the previous December low.
Here’s why we wrote it:
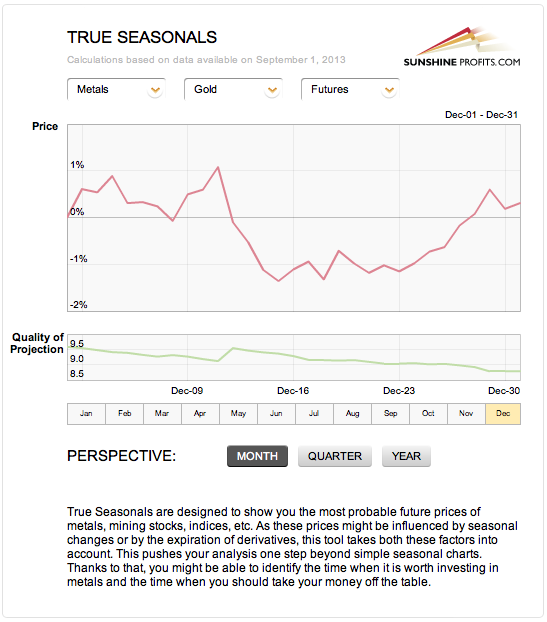
Please note that while the average price that we are to expect after Dec 11 decreases, the quality of projection increases. This means that while the shape of the preceding rally is less clear, it’s more certain that there will be a decline of some sort. This may also mean that the decline could be much greater than indicated by the pattern.
Summing up, the medium-term outlook for gold remains bearish and it seems that we might see another sizable downswing shortly. This week’s initial “strength” was quickly invalidated.
We would like to emphasize that we continue to think that gold is likely to move much higher in the coming years. Gold is a system hedge and with practically all monetary authorities trying to print and inflate their way out of their problems, the systemic risk will continue to increase.
However, markets are logical only in the very long run. In the medium and short term, they are emotional and vulnerable to multiple psychological traits that humans (that ultimately create markets) exhibit. Consequently, every bull market will also have temporary downturns without any good logical reason – and it seems that this is where we are right now. The good news about them is that they allow informed investors to take advantage of these emotional price swings and increase their profits. This means that instead of hating these corrections one might be better off by taking advantage of them.
Thank you for reading. Have a great weekend and profitable week!
Sincerely,
Przemyslaw Radomski, CFA
