

Earlier today, the USD Index extended gains and came back above the level of 101 on hopes that the minutes of the February FOMC meeting would give more clues about possible rate hikes. How did this increase affect the technical picture of our six currency pairs?
In our opinion the following forex trading positions are justified - summary:
- EUR/USD: short (a stop-loss order at 1.0735; the initial downside target at 1.0388)
- GBP/USD: none
- USD/JPY: long (a stop-loss order at 111; the initial upside target at 115.43)
- USD/CAD: long (a stop-loss order at 1.2949; the initial upside target at 1.3302)
- USD/CHF: long (a stop-loss order at 0.9891; the initial upside target at 1.0180)
- AUD/USD: none
EUR/USD
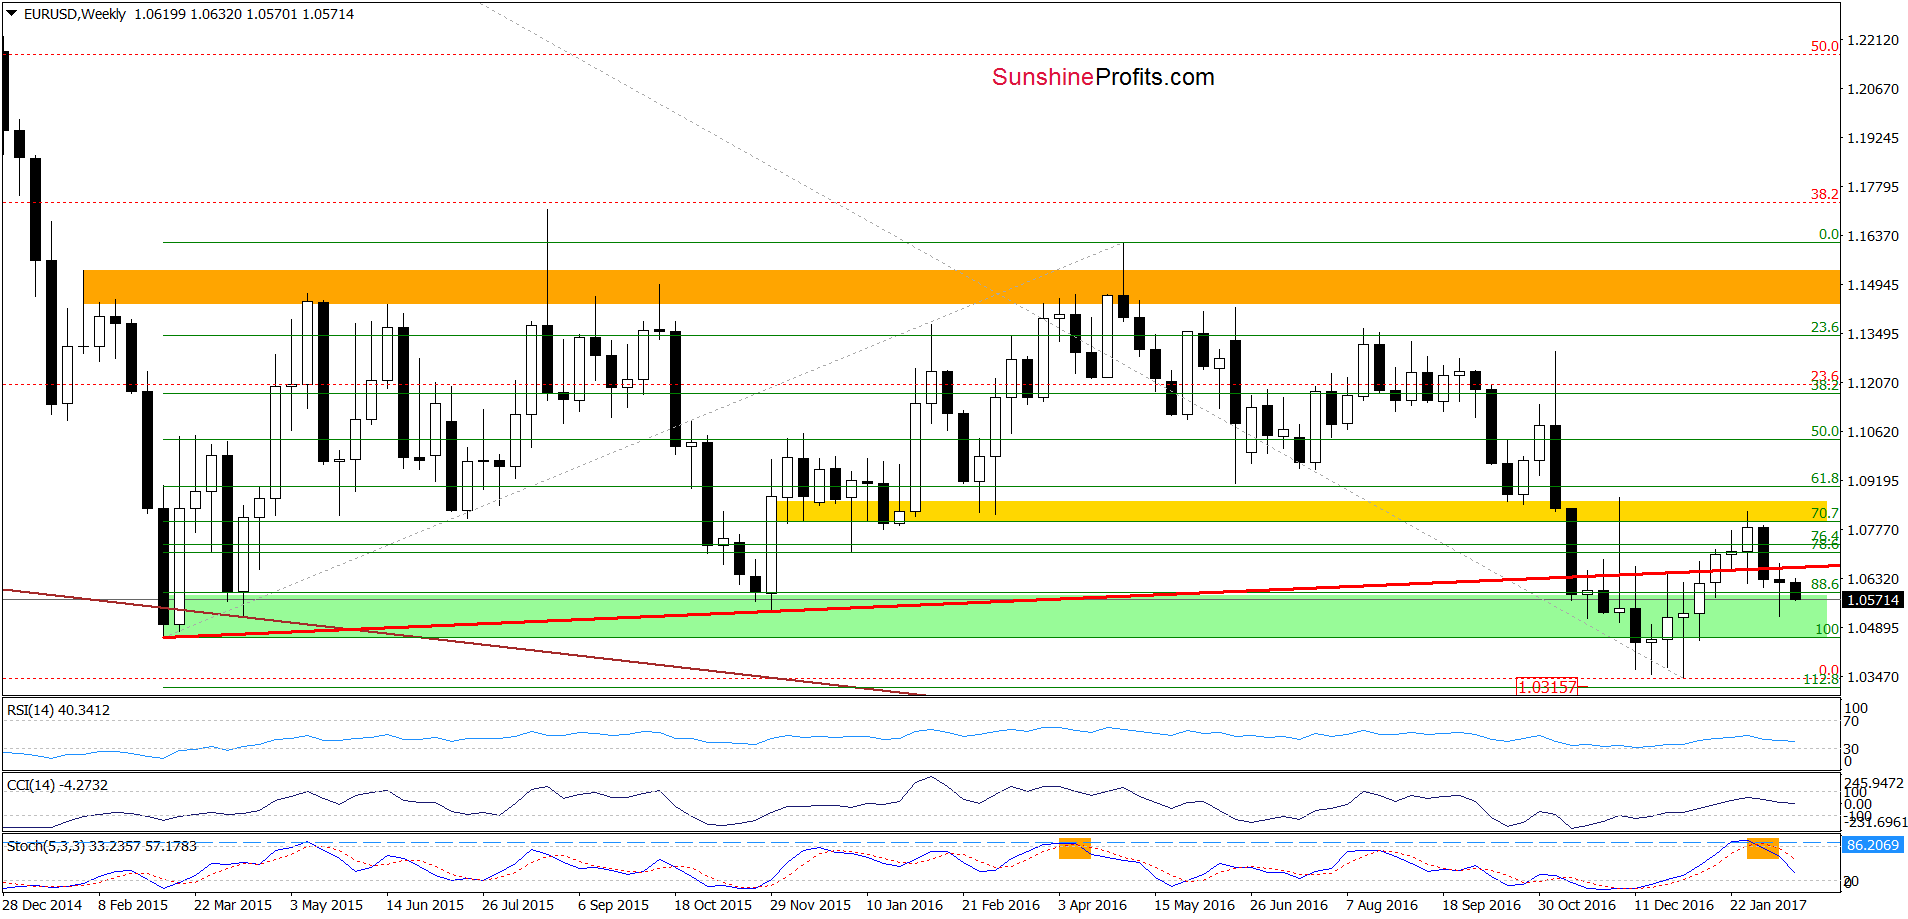
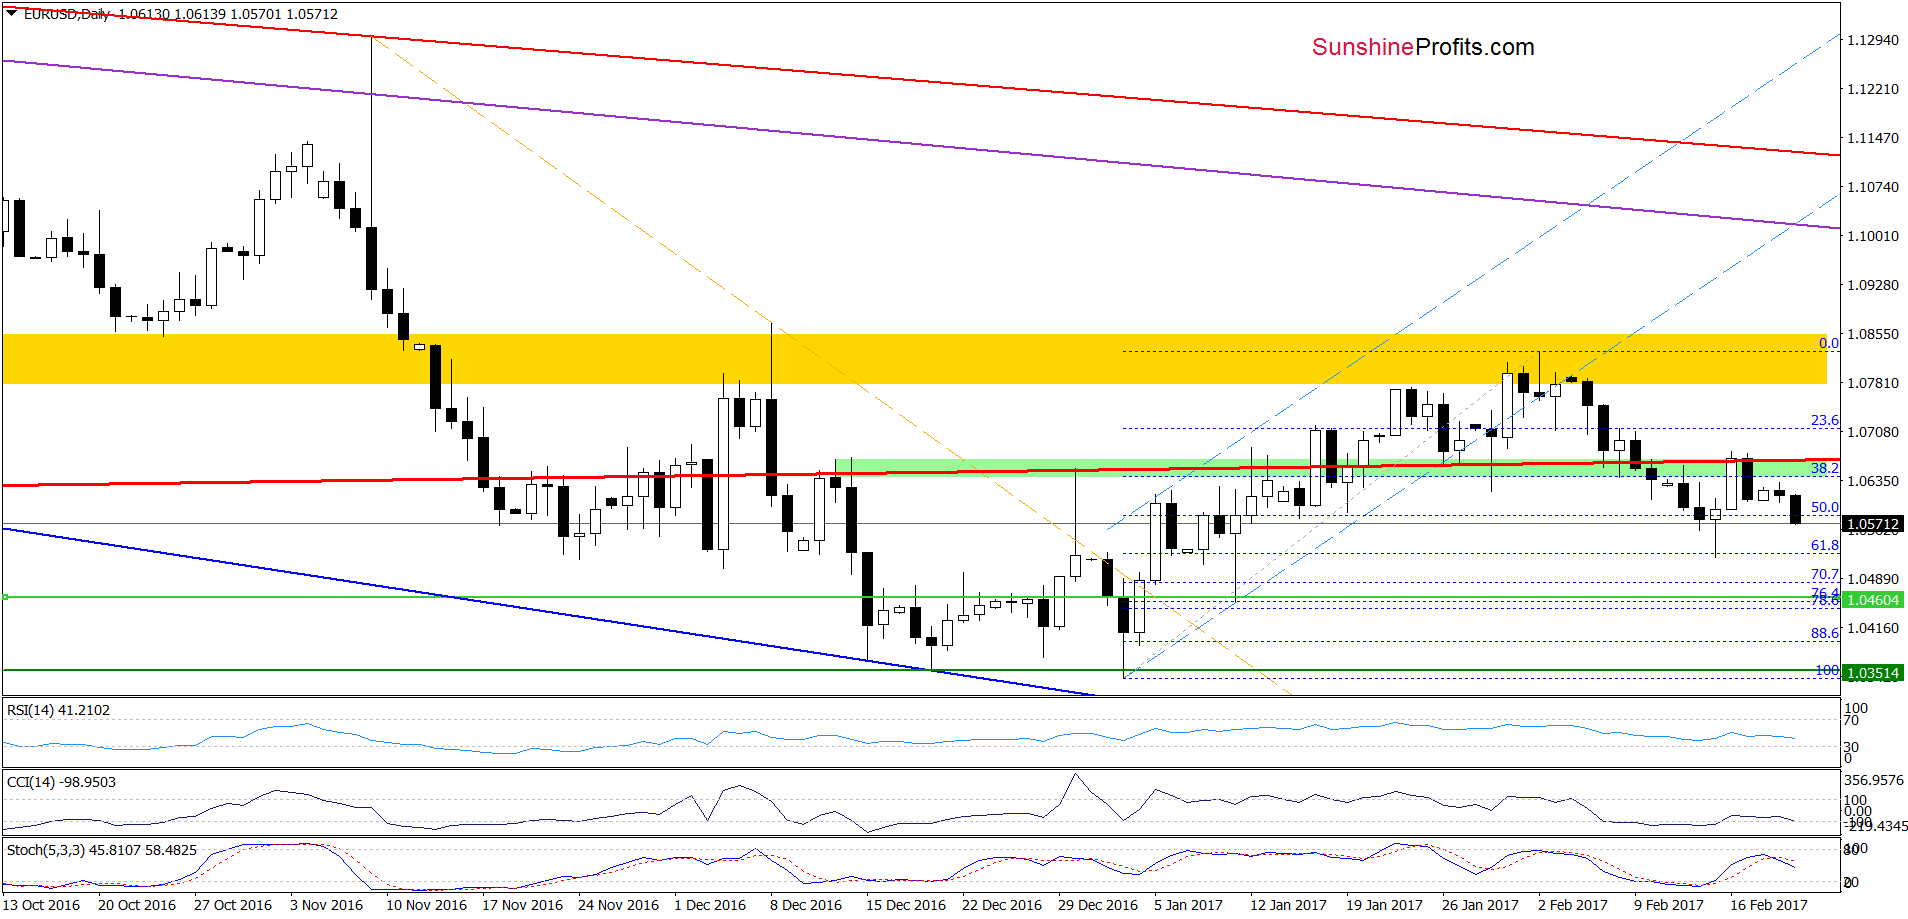
Looking at the charts, we see that EUR/USD climbed slightly above the green zone and the long-term red line, but then reversed and closed Friday’s session under these levels. This verification of the breakdown triggered further deterioration earlier today, which suggests that we’ll see a drop to (at least) 1.0460, where the 76.4% and 78.6% Fibonacci retracements are. If this area is broken, the next target for currency bears will be the January low of 1.0339. Taking all the above into account, we think that re-opening short positions is justified from the risk/reward perspective.
Very short-term outlook: bearish
Short-term outlook: mixed with bearish bias
MT outlook: mixed
LT outlook: mixed
Trading position (short-term; our opinion): Short positions (with a stop-loss order at 1.0735 and the initial downside target at 1.0388) are justified from the risk/reward perspective. We will keep you informed should anything change, or should we see a confirmation/invalidation of the above.
GBP/USD
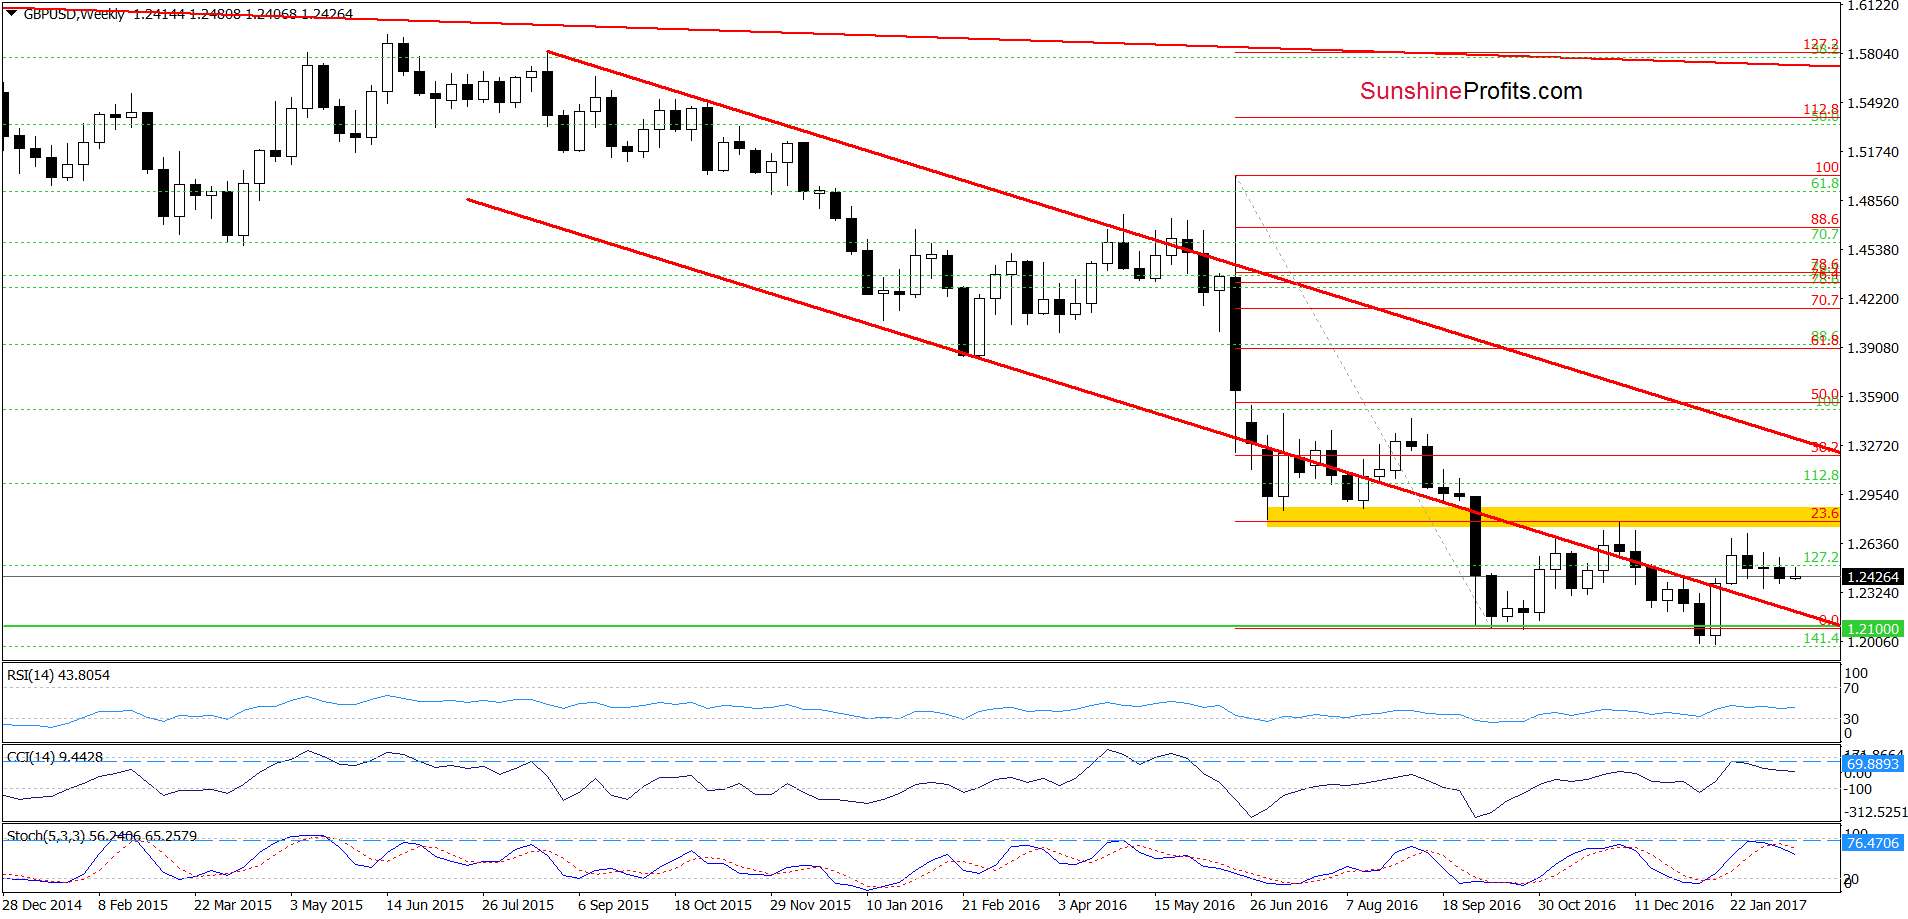
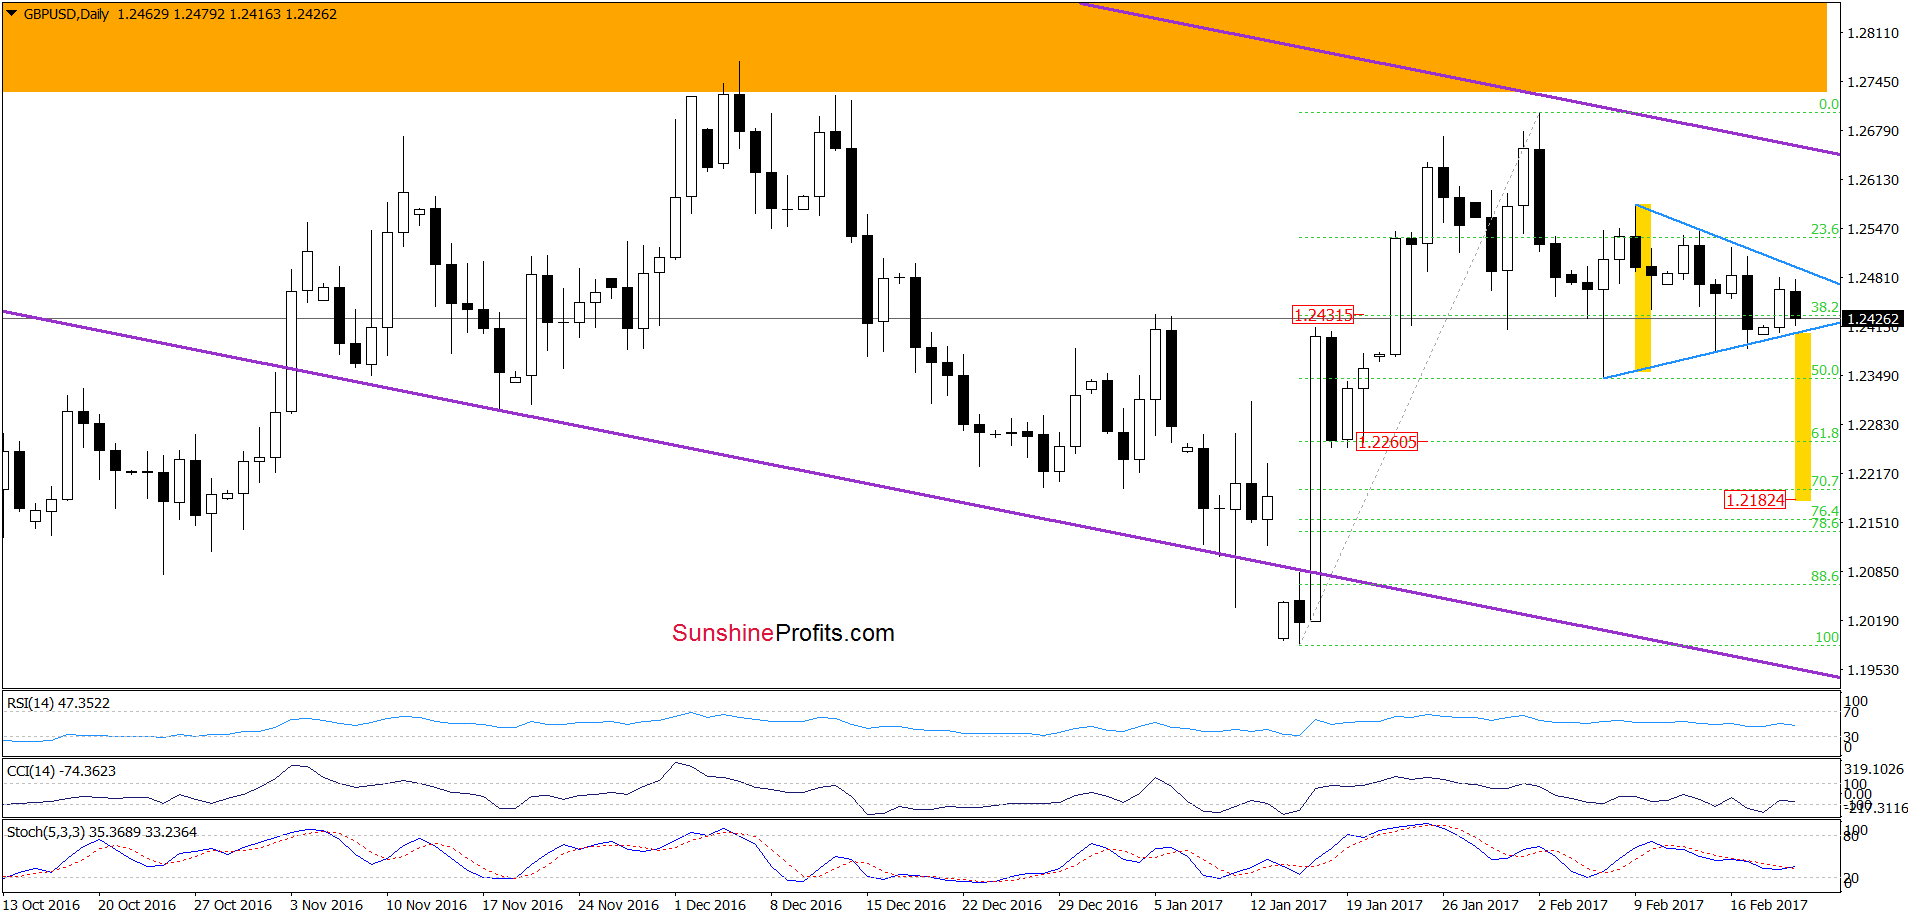
On the daily chart, we see that GBP/USD is currently trading in a triangle, which makes the very short-term a bit unclear. Nevertheless, the sell signals generated by the weekly indicators suggest another downswing. Therefore, if GBP/USD declines under the lower border of the formation, we’ll see a drop to around 1.2182, where the size of the downward move will correspond to the height of the formation. Taking all the above into account, if GBP/USD drops below the blue support line, we’ll likely open short positions.
Very short-term outlook: mixed with bearish bias
Short-term outlook: mixed
MT outlook: mixed
LT outlook: mixed
Trading position (short-term; our opinion): No positions are justified from the risk/reward perspective. We will keep you informed should anything change, or should we see a confirmation/invalidation of the above.
USD/JPY
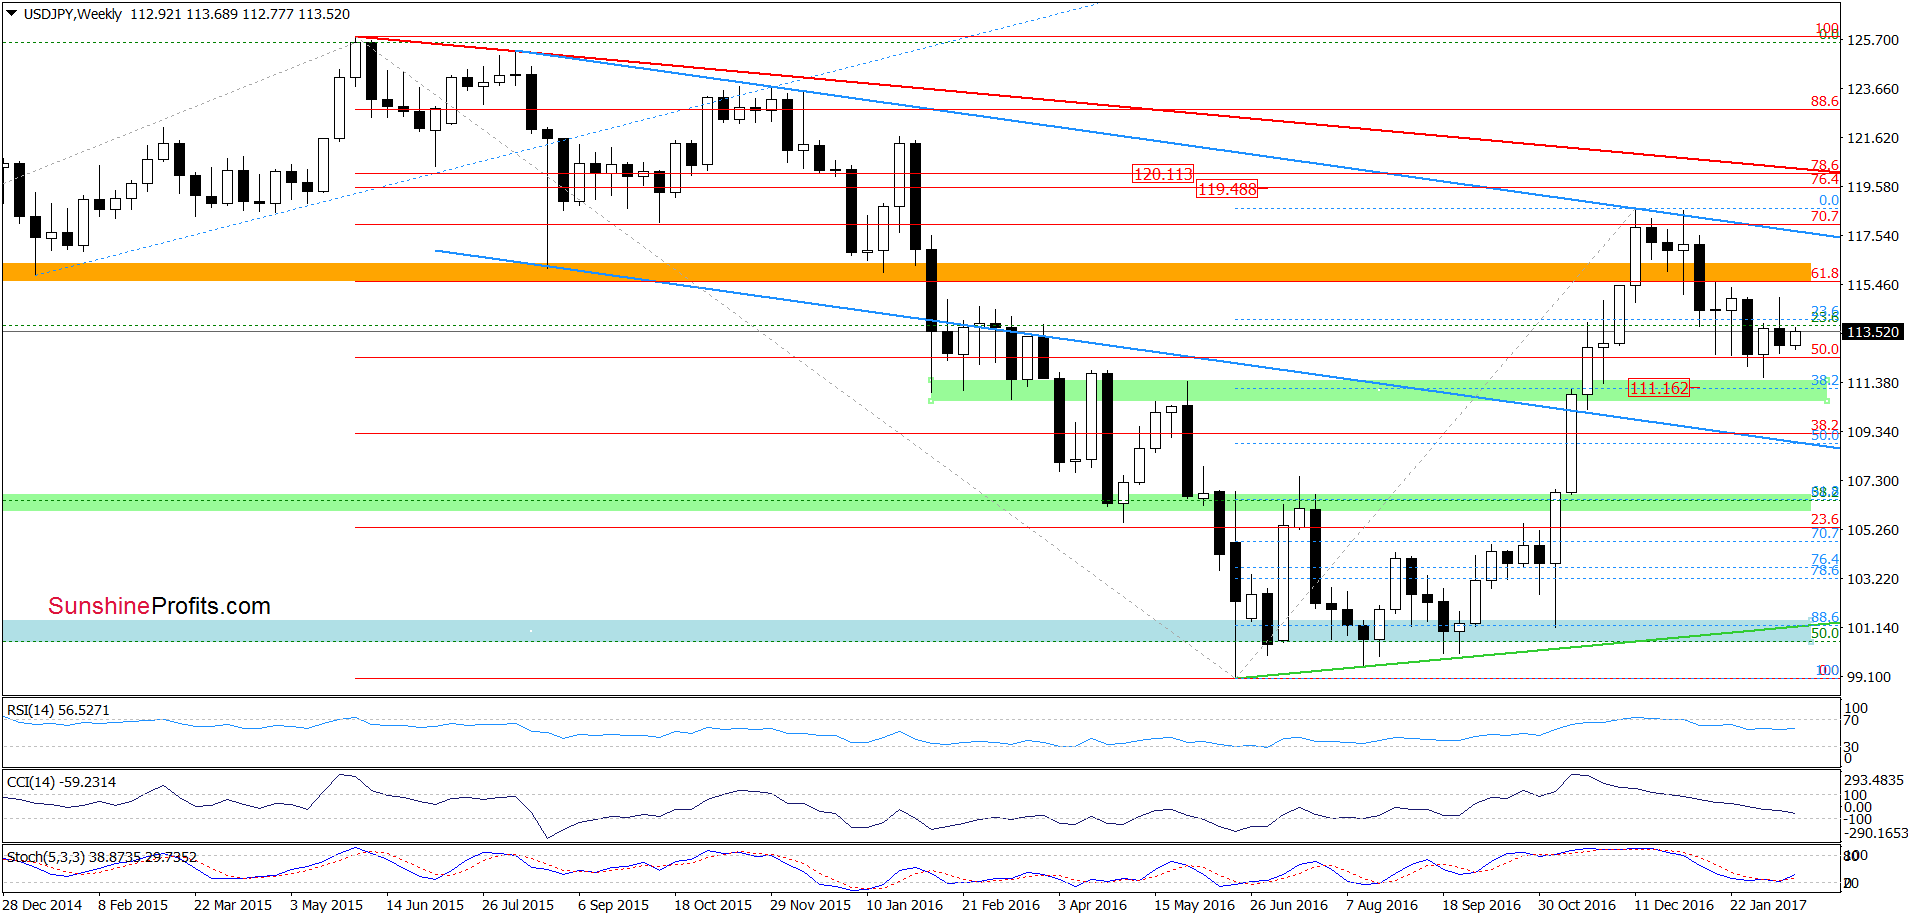
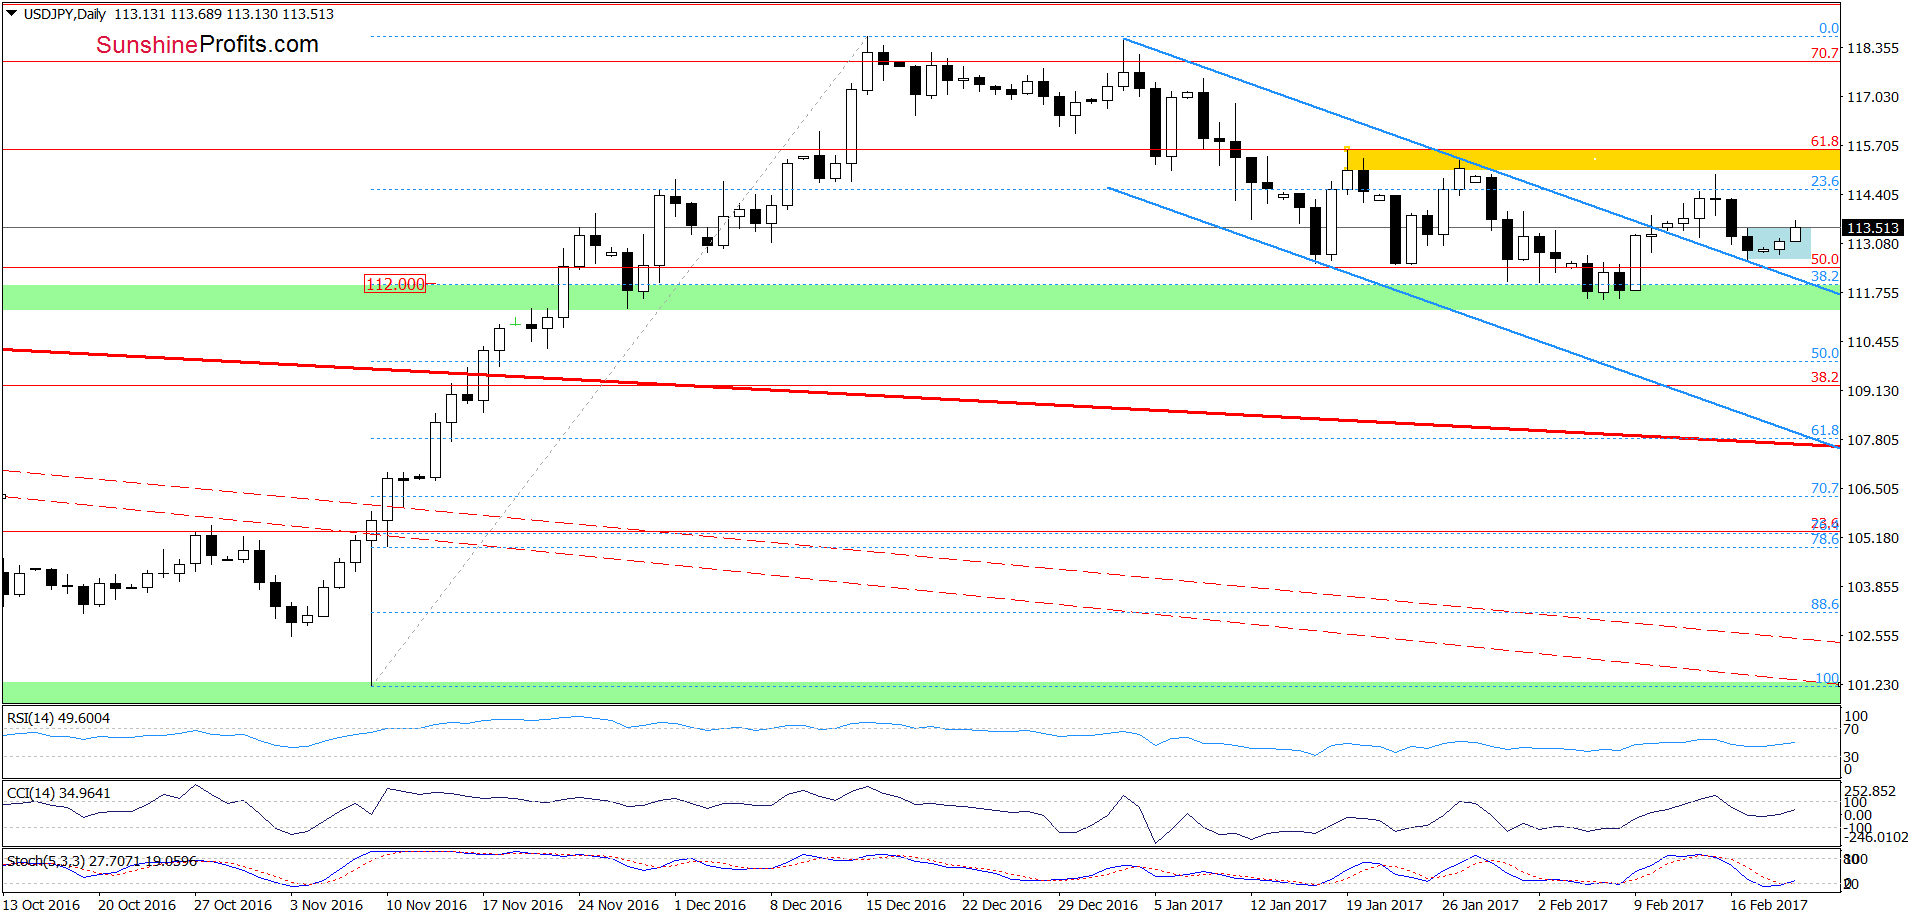
On the daily chart, we see that USD/JPY verified the earlier breakout above the upper border of the blue declining trend channel and rebounded. Additionally, earlier today, the pair climbed above the upper line of the blue consolidation, which together with the buy signal generated by the Stochastic Oscillator suggest further improvement and (at least) a test of the yellow resistance zone in the coming days. Therefore, opening long positions seems justified from the risk/reward perspective.
Very short-term outlook: bullish
Short-term outlook: mixed with bullish bias
MT outlook: mixed
LT outlook: mixed
Trading position (short-term; our opinion): Long positions (with a stop-loss order at 111 and the initial upside target at 115.43) are justified from the risk/reward perspective. We will keep you informed should anything change, or should we see a confirmation/invalidation of the above.
USD/CAD
On Friday, we wrote the following:
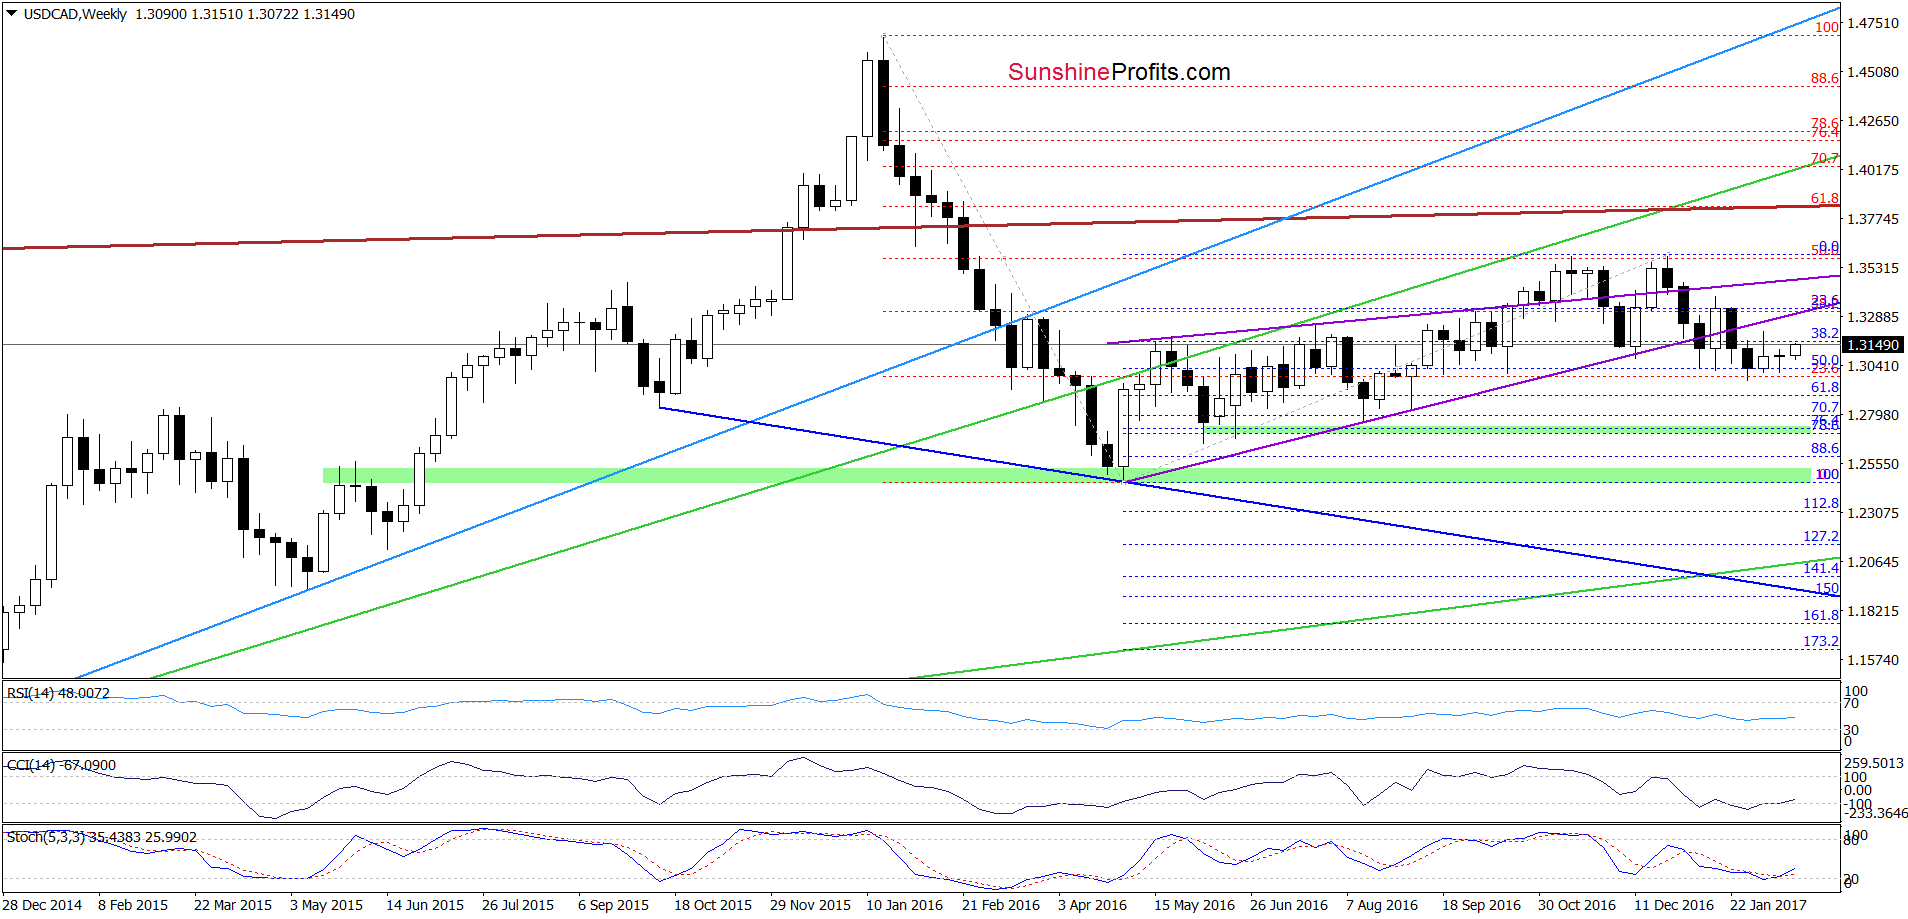
(…) the current position of the indicators (the CCI and the Stochastic Oscillator were around these levels in April 2016) suggests that another bigger move to the upside is just around the corner.
On the weekly chart, we see that currency bulls pushed the pair higher as we had expected. What impact did this increase have on the very short-term picture? Let’s check.
Quoting our Friday’s alert:
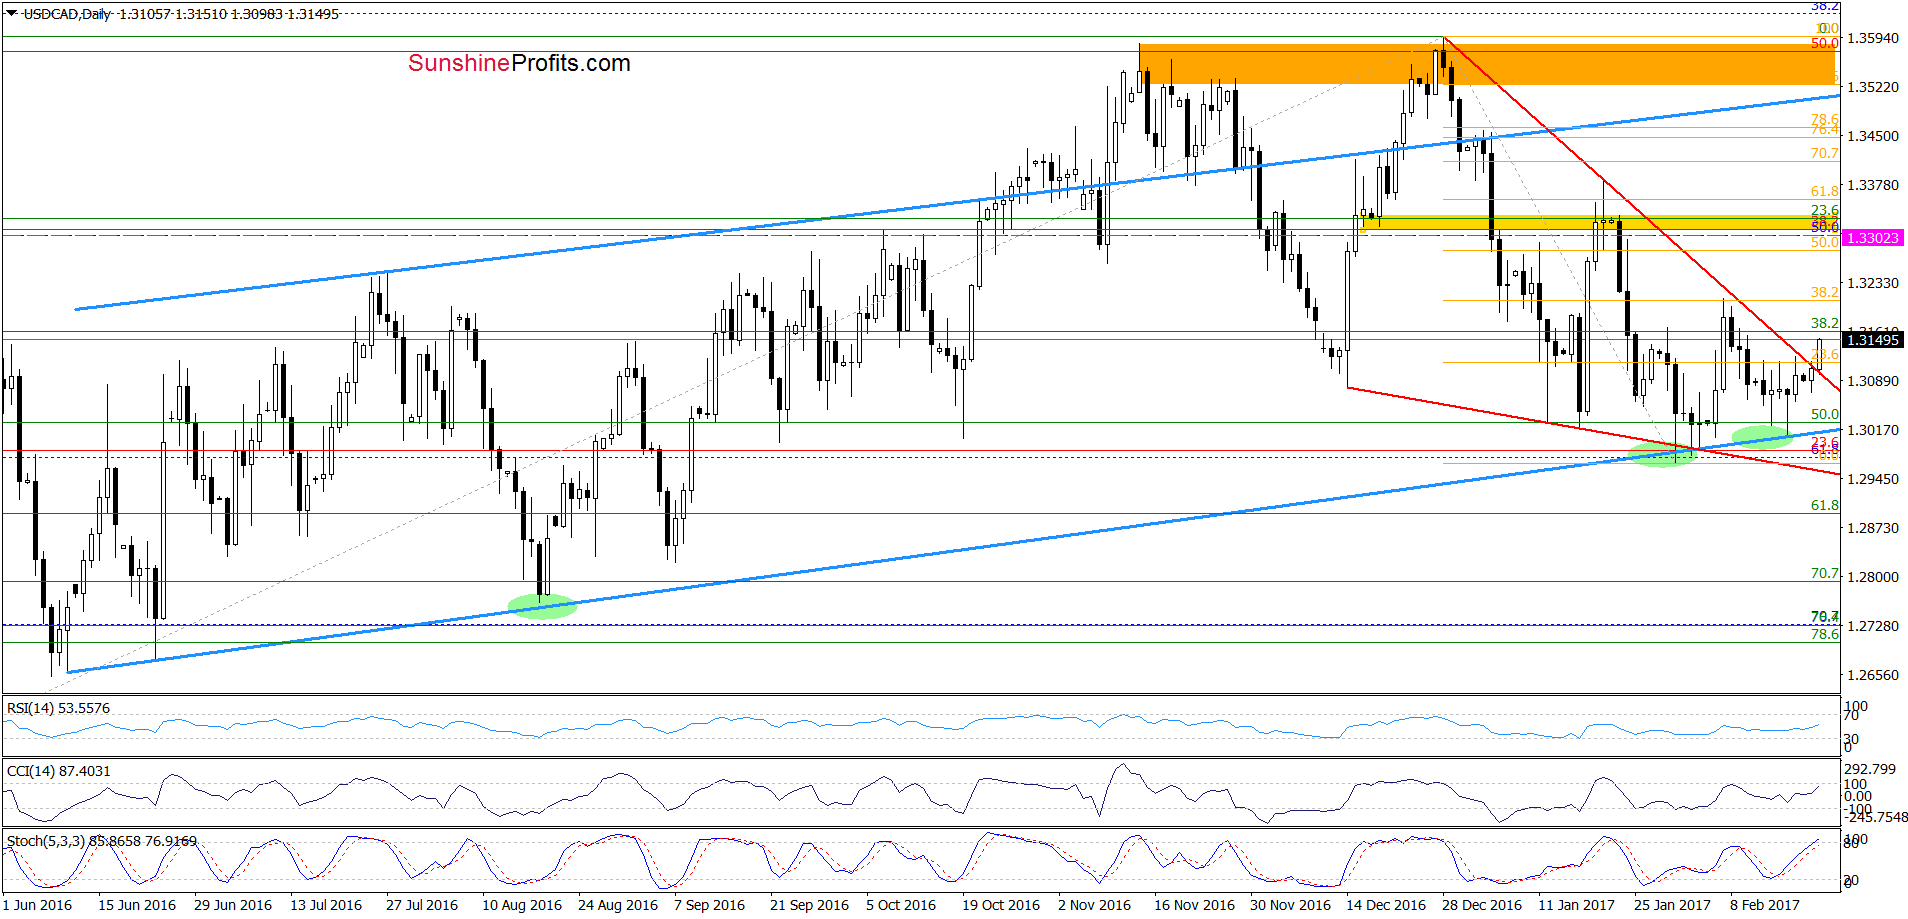
(…) although USD/CAD moved lower yesterday, the long-term blue support line stopped currency bears once again, triggering a rebound. On the daily chart, we see that there were similar situations in the past. In both previous cases, such price action translated into an upward move. Taking this fact into account and the buy signal generated by the Stochastic Oscillator we think that the pair will extend gains in the coming week.
From today’s point of view, we see that the situation developed in line with the above scenario and USD/CAD rebounded in previous days. Earlier today, the exchange rate broke above the red declining resistance line based on the December and January highs, which is a positive signal and suggests further improvement in the coming days. If this is the case, the exchange rate will (at least) test the February high and the 38.2% Fibonacci retracement.
Very short-term outlook: bullish
Short-term outlook: mixed with bullish bias
MT outlook: mixed
LT outlook: mixed
Trading position (short-term; our opinion): Long positions (with a stop-loss order at 1.2949 and the initial upside target at 1.3302) are justified from the risk/reward perspective. We will keep you informed should anything change, or should we see a confirmation/invalidation of the above.
USD/CHF
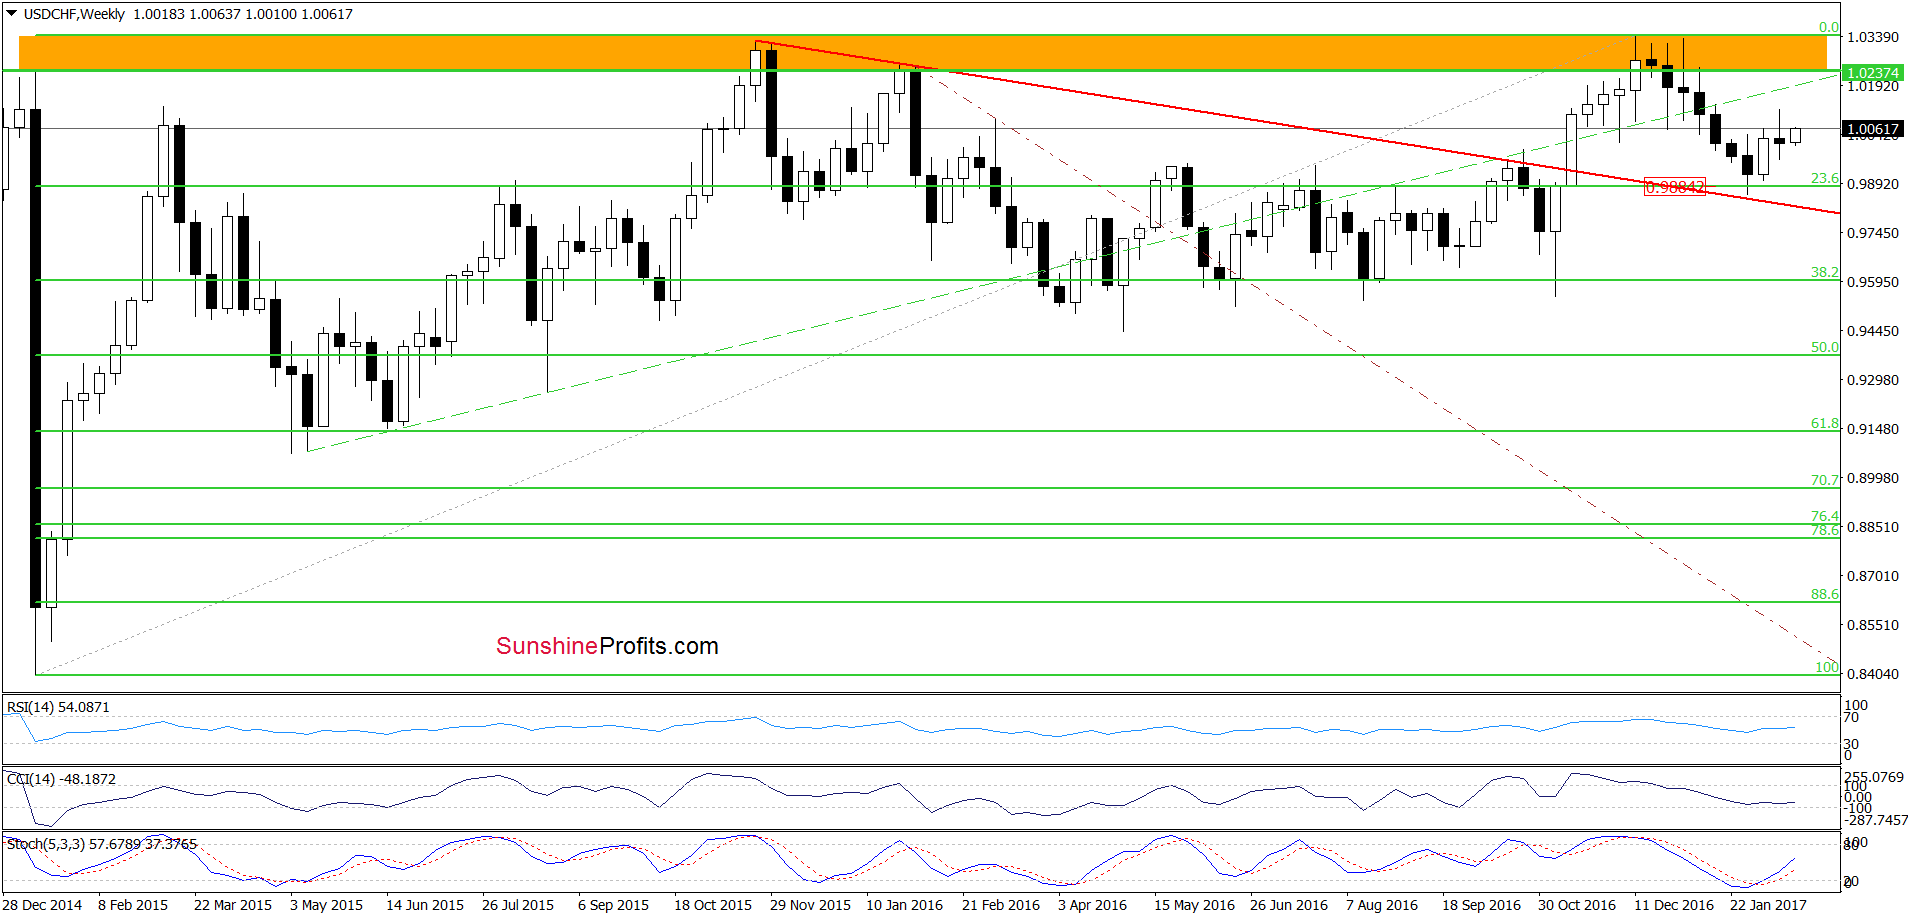
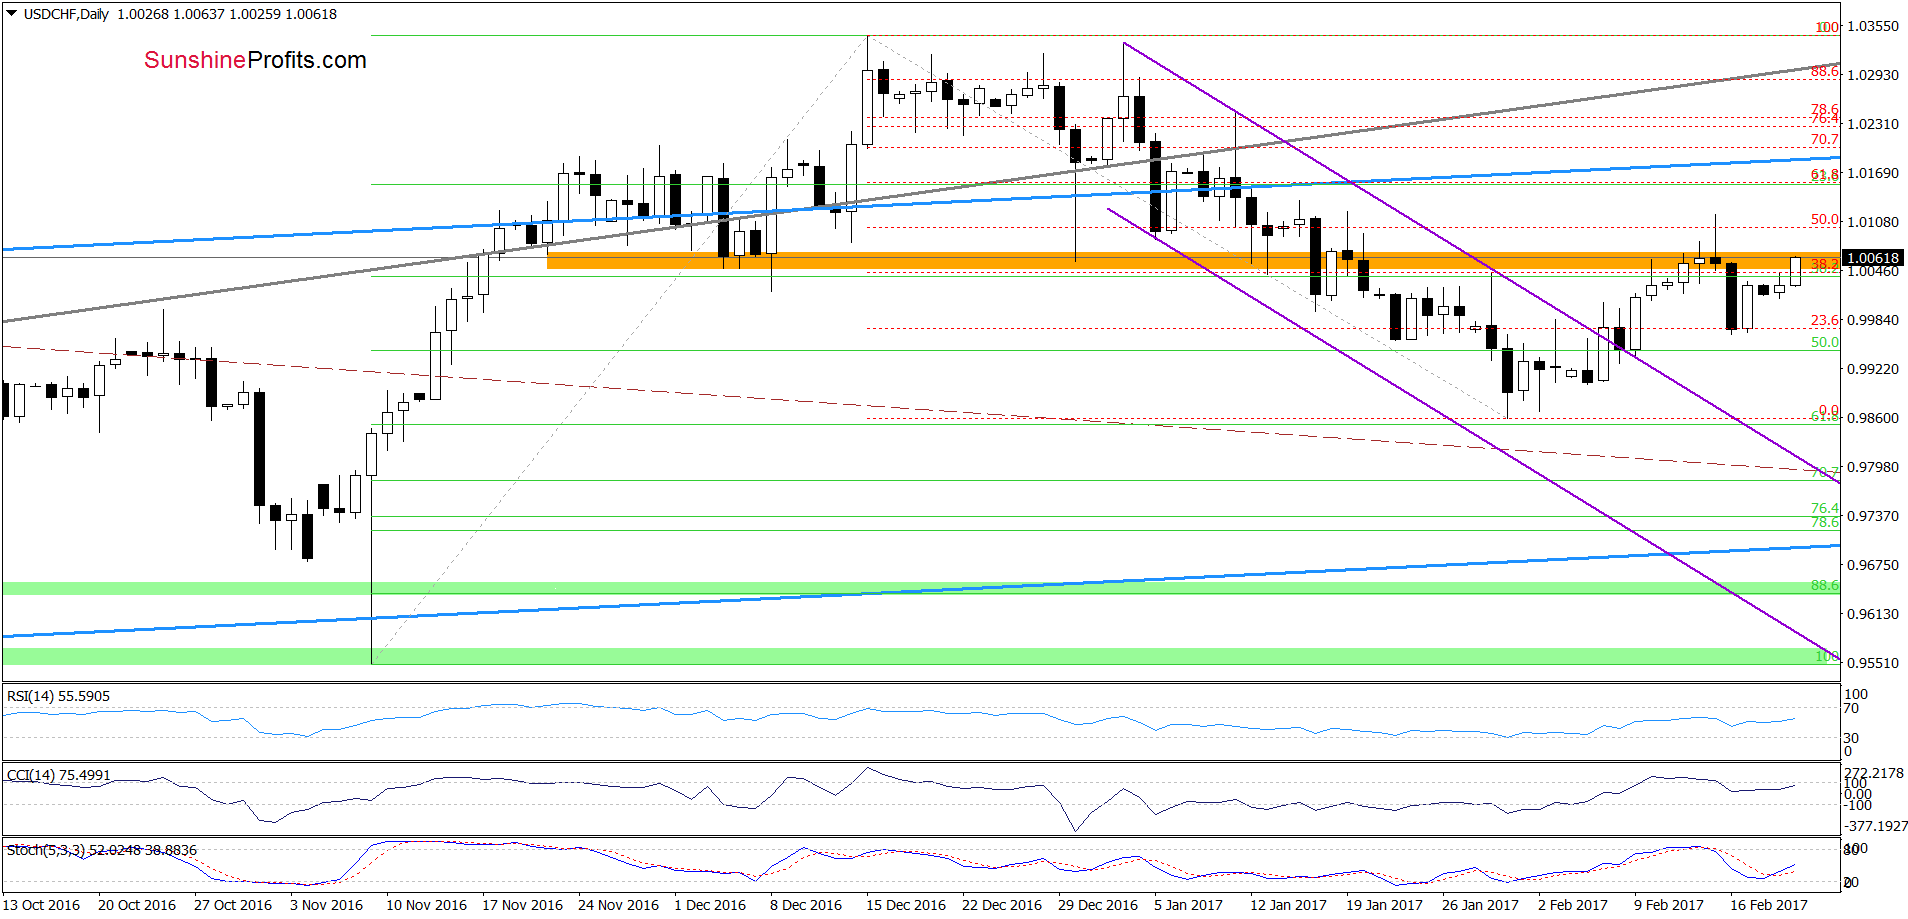
On the daily chart, we see that USD/CHF reversed and came back to the orange resistance zone and the 38.2% Fibonacci retracement. Additionally, the Stochastic Oscillator re-generated the buy signal, suggesting another attempt to move higher. If this is the case, we’ll see a test of the next retracement or even an increase to the upper border of the blue rising trend channel in the coming days. Therefore, we think that opening long positions is justified from the risk/reward perspective.
Very short-term outlook: bullish
Short-term outlook: mixed with bullish bias
MT outlook: mixed
LT outlook: mixed
Trading position (short-term; our opinion): Long positions (with a stop-loss order at 0.9891 and the initial upside target at 1.0180) are justified from the risk/reward perspective. We will keep you informed should anything change, or should we see a confirmation/invalidation of the above.
AUD/USD
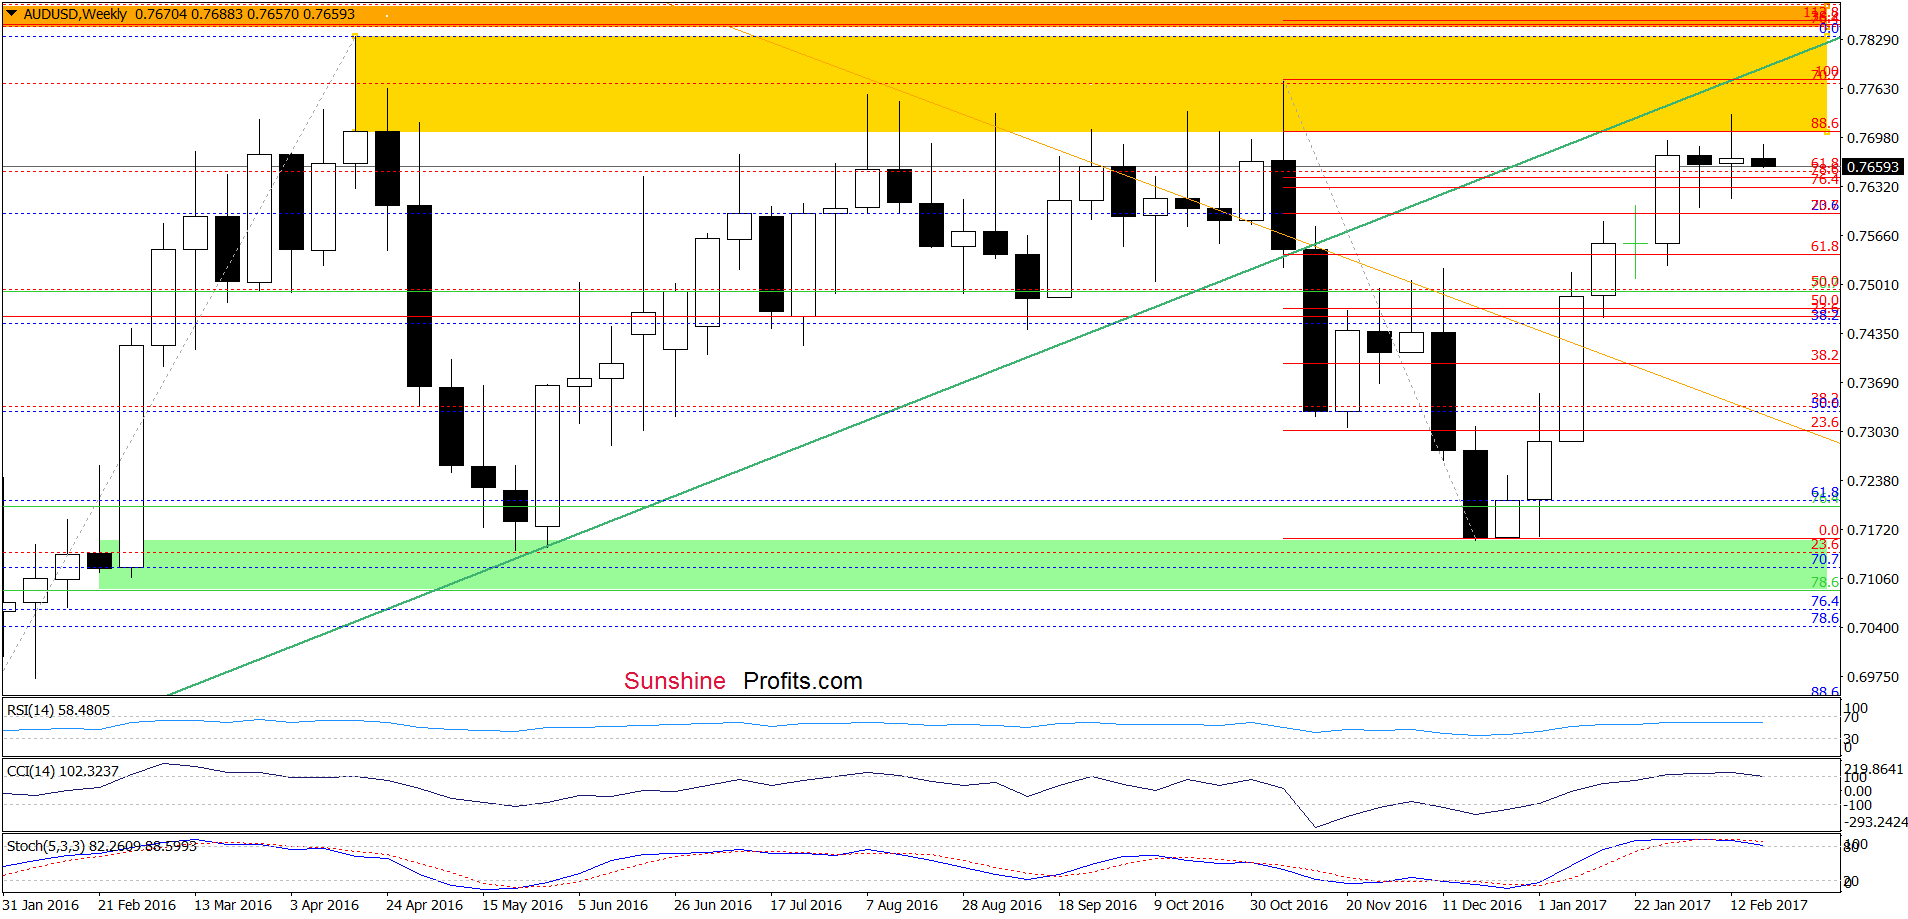
On the weekly chart, we see that AUD/USD extended gains and climbed to the yellow resistance zone in the previous week. This area was strong enough to stop currency bulls several times in the past, which suggests that another attempt to move lower may be just around the corner. This scenario is also reinforced by the current position of the indicators – the CCI and the Stochastic Oscillator generated the sell signals, supporting lower prices of the exchange rate.
Will the very short-term picture confirm this pro bearish scenario? Let’s check.
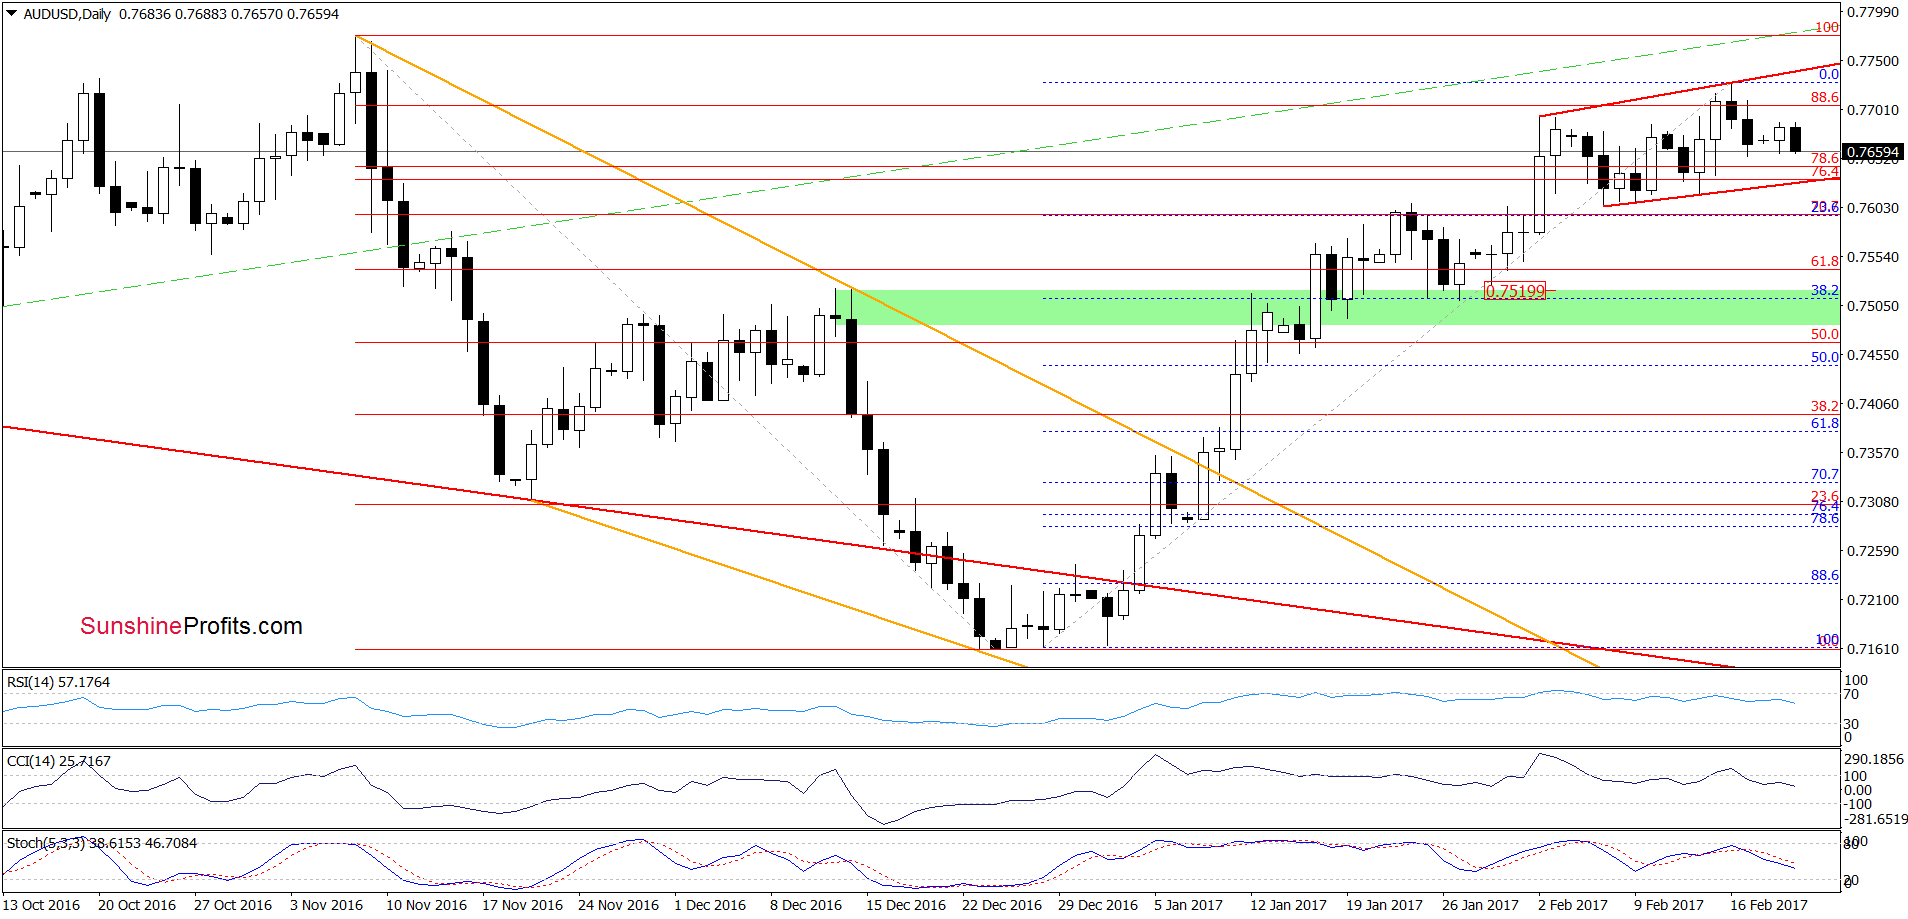
Looking at the daily chart, we see that the overall situation hasn’t changed much as the exchange rate is still trading in the red rising trend channel. Nevertheless, taking into account the sell signals generated by the indicators and the medium-term picture, we think that the pair will test the lower border of the formation in very near future. Therefore, if AUD/USD declines under this support line, we’ll likely open short positions. In this case, the next target for currency bears will be the green support zone.
Very short-term outlook: mixed with bearish bias
Short-term outlook: mixed with bearish bias
MT outlook: mixed
LT outlook: mixed
Trading position (short-term; our opinion): No positions are justified from the risk/reward perspective. We will keep you informed should anything change, or should we see a confirmation/invalidation of the above.
As a reminder – “initial target price” means exactly that – an “initial” one, it’s not a price level at which we suggest closing positions. If this becomes the case (like it did in the previous trade) we will refer to these levels as levels of exit orders (exactly as we’ve done previously). Stop-loss levels, however, are naturally not “initial”, but something that, in our opinion, might be entered as an order.
Thank you.
Nadia Simmons
Forex & Oil Trading Strategist
Przemyslaw Radomski, CFA
Founder, Editor-in-chief, Gold & Silver Fund Manager
Gold & Silver Trading Alerts
Forex Trading Alerts
Oil Investment Updates
Oil Trading Alerts

