

Earlier today, the British pound moved lower against the greenback after official data showed that although UK consumer prices rose, they missed expectations. As a result, GBP/USD reversed and dropped under 1.2500. Will we see lower values of the exchange rate in the coming days?
In our opinion the following forex trading positions are justified - summary:
- EUR/USD: short (a stop-loss order at 1.0957; the initial downside target at 1.0538)
- GBP/USD: none
- USD/JPY: none
- USD/CAD: long (a stop-loss order at 1.2949; the initial upside target at 1.3302)
- USD/CHF: long (a stop-loss order at 0.9879; the next upside target at 1.0100)
- AUD/USD: short (a stop-loss order at 0.7723; the initial downside target at 0.7520)
EUR/USD
Yesterday, we wrote the following:
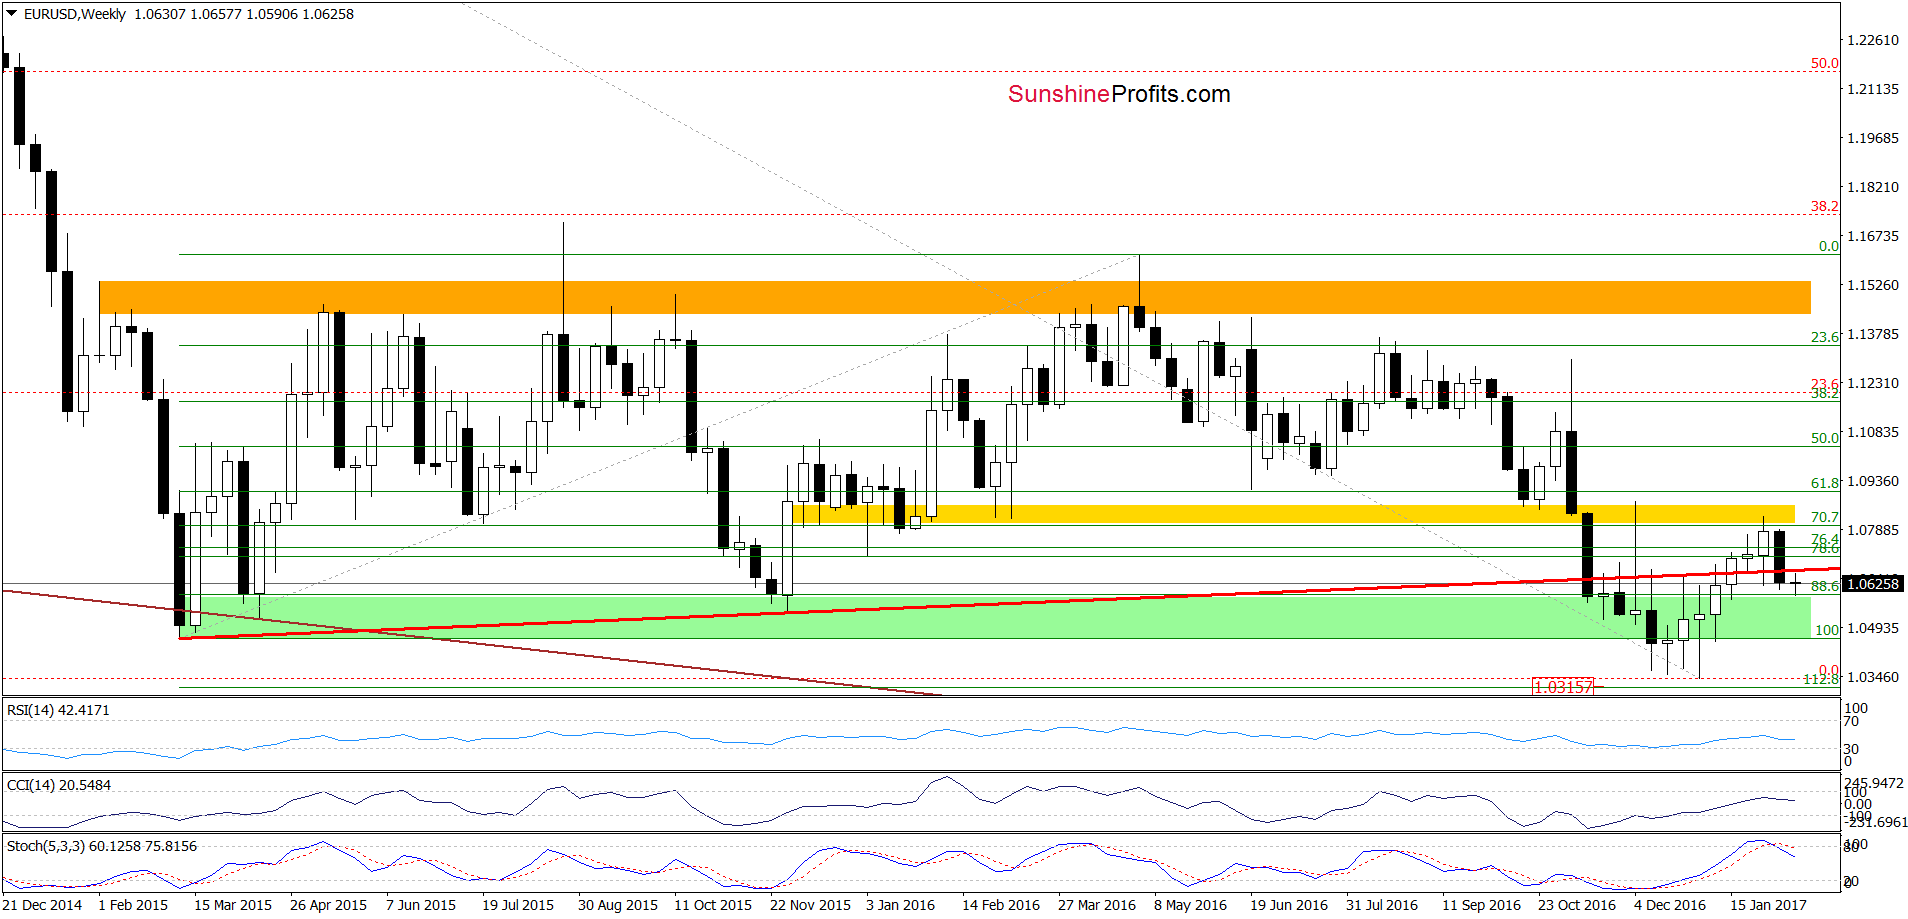
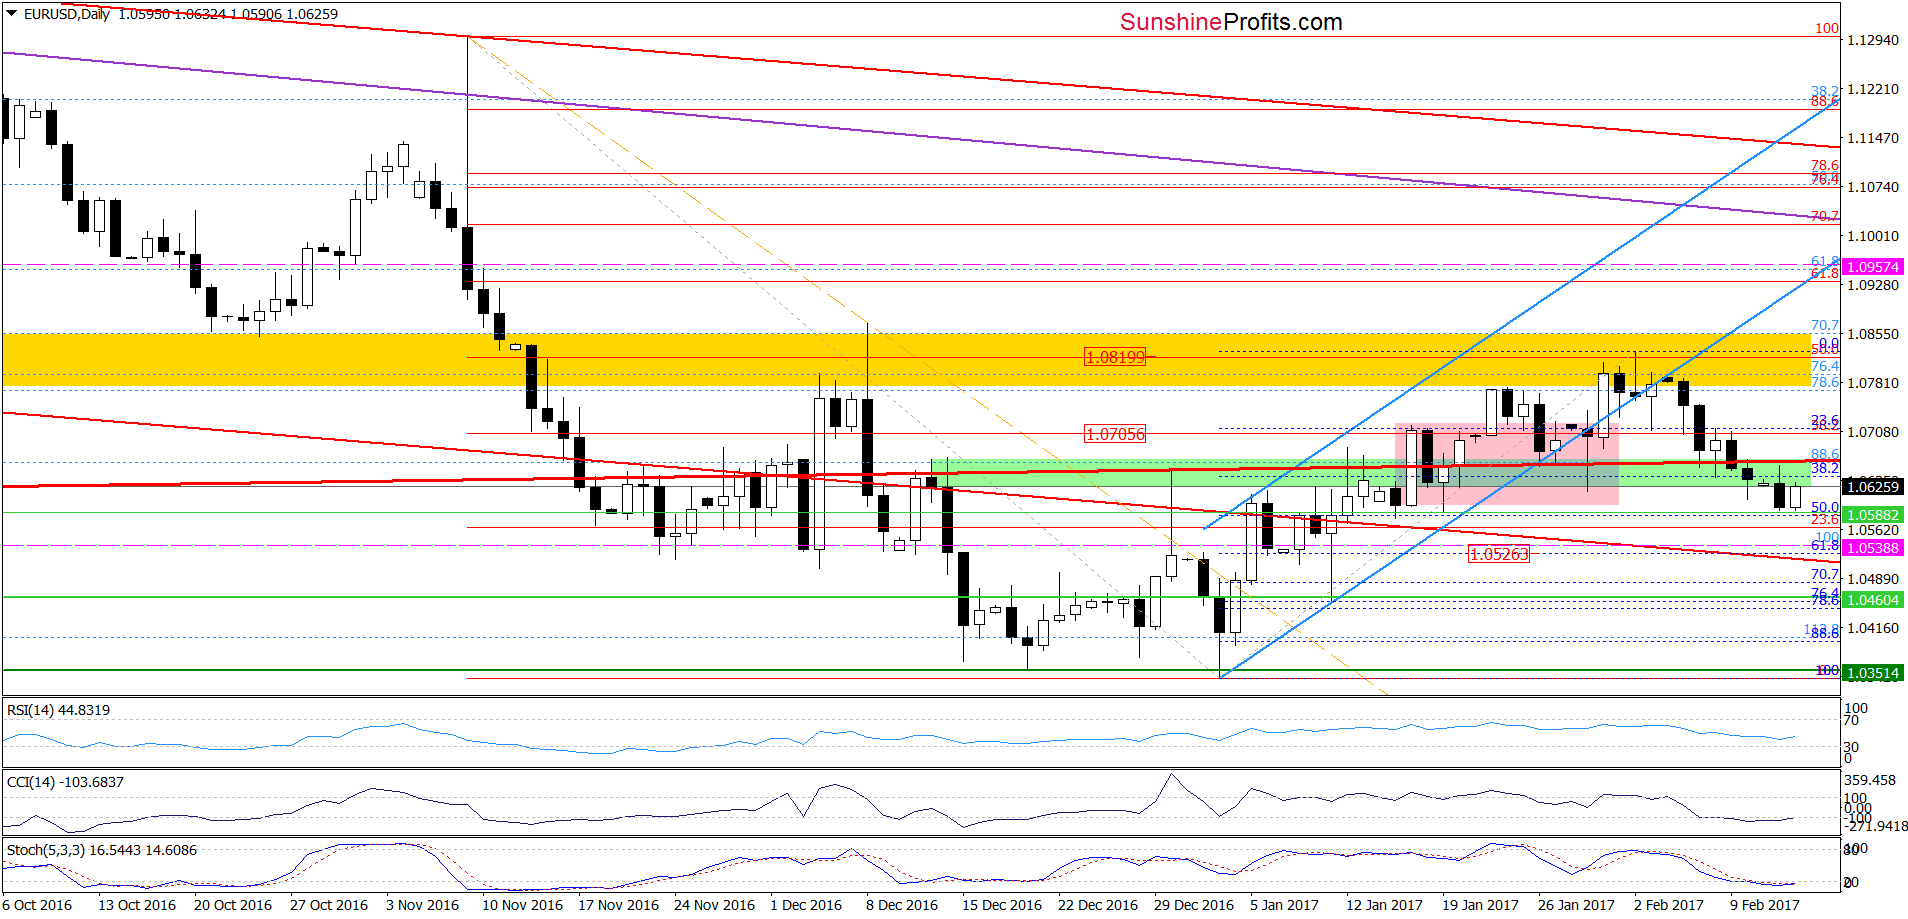
(…) EUR/USD closed the previous week below the long-term red support line (seen more clearly on the weekly chart), invalidating the earlier breakout. Additionally, (….) the exchange rate moved a bit higher, but then gave up the gains, which looks like a verification of the breakdown under the above-mentioned red line. If this is the case, the pair will likely extend losses and test the January 19 low of 1.0588.
From today’s point of view, we see that the situation developed in line with the above scenario and EUR/USD almost touched our initial downside target. As you see, the proximity to the January 19 low and the 50% Fibonacci retracement (based on the January-February upward move) triggered a rebound earlier today, but despite this increase the exchange rate is still trading below the long-term red support line and the green zone, which serves now as a resistance. This looks like another verification of the breakdown and suggests lower values of EUR/USD in the coming days.
If this is the case and the pair drops under yesterday’s lows, the next target for currency bears will be the 61.8% Fibonacci retracement based on the January-February upward move around1.0526.
Very short-term outlook: bearish
Short-term outlook: mixed with bearish bias
MT outlook: mixed
LT outlook: mixed
Trading position (short-term; our opinion): Short positions (with a stop-loss order at 1.0957 and the initial downside target at 1.0538) are justified from the risk/reward perspective. We will keep you informed should anything change, or should we see a confirmation/invalidation of the above.
GBP/USD
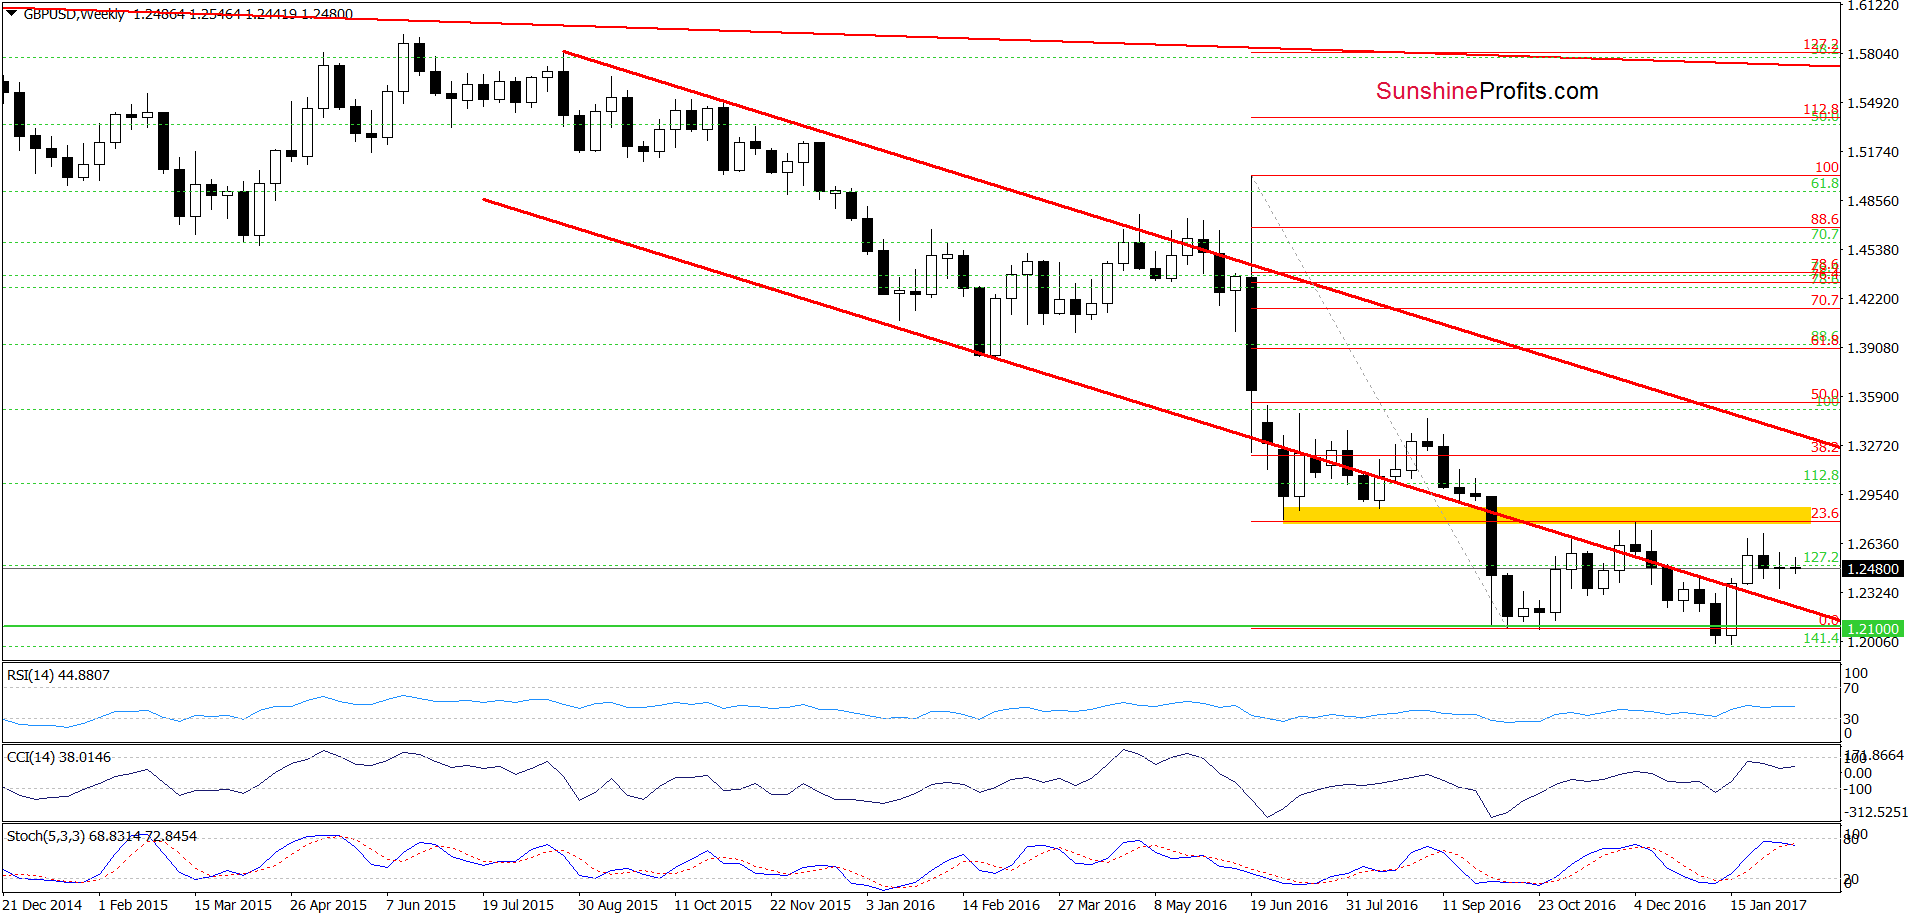
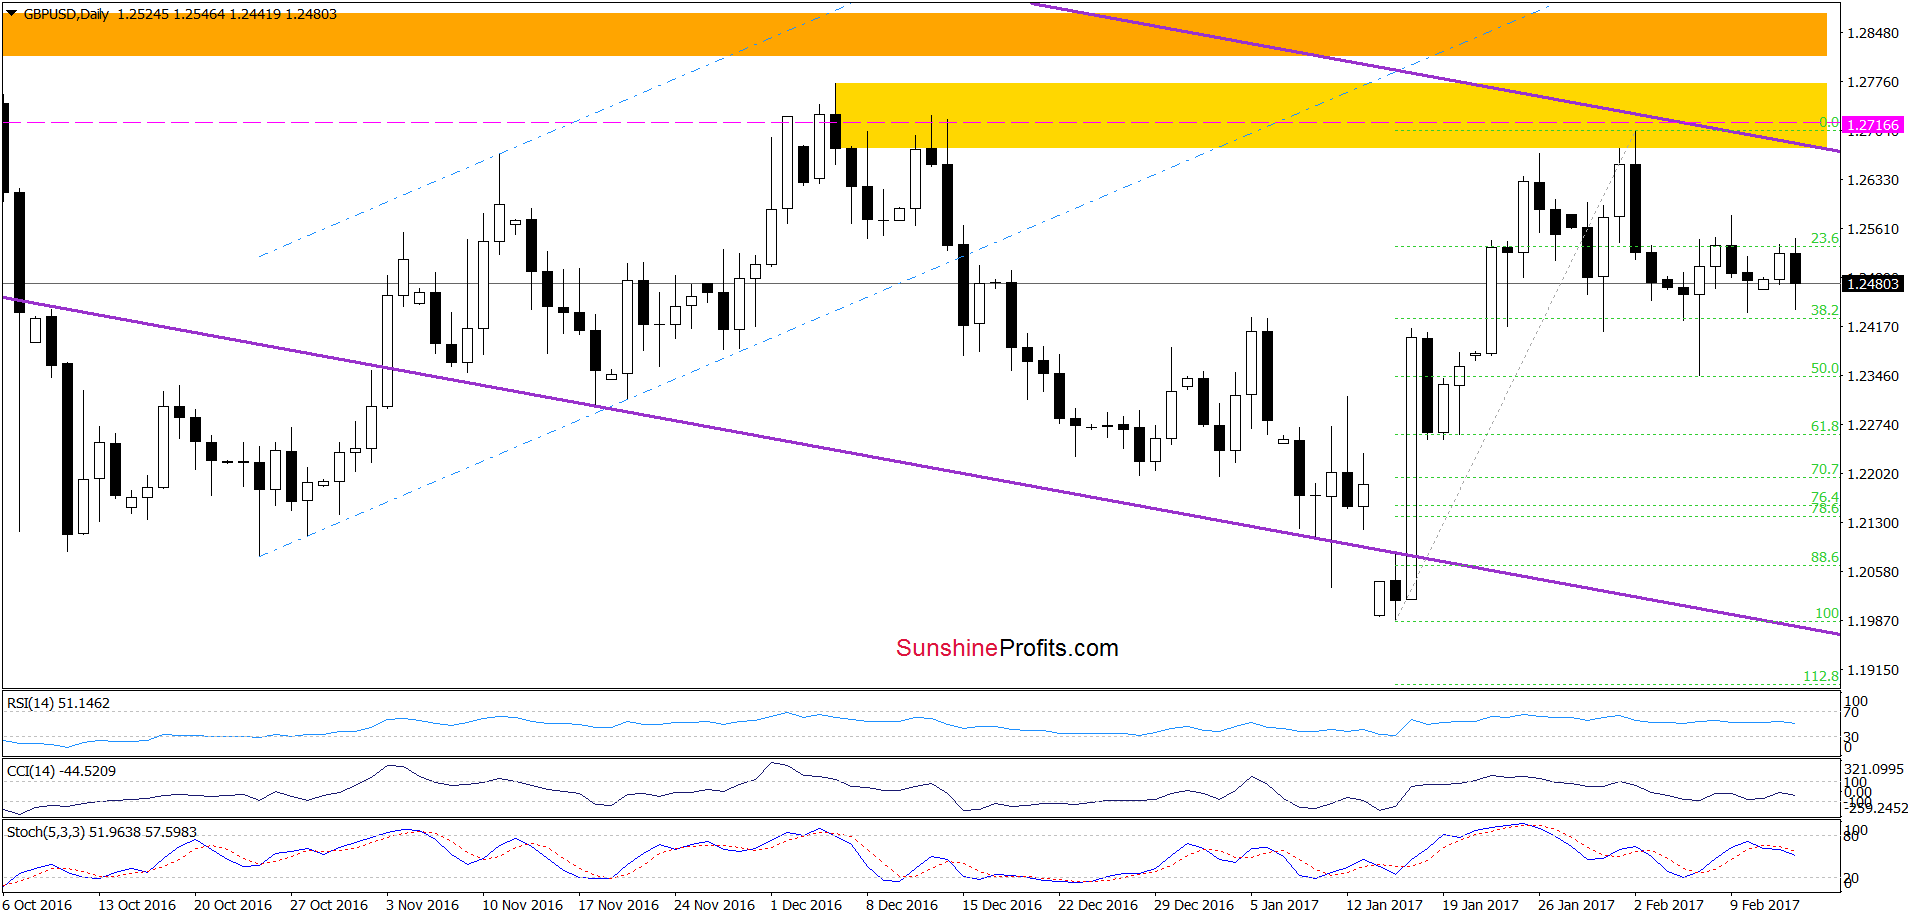
On the daily chart, we see that although GBP/USD rebounded in the previous week, currency bulls didn’t manage to push the pair to the purple resistance line. As a result, the exchange rate reversed, which suggests further deterioration in the coming days. Additionally, the weekly and daily Stochastic Oscillators generated the sell signals, which increases the probability of declines. If this is the case and GBP/USD moves lower from here the initial downside target will be the 50% Fibonacci retracement and the February low. If this area is broken, the next downside target will be the 61.8% retracement and the mid-January lows (around 1.2251-1.2260). At this point, it is also worth noting that slightly below this area is also the previously-broken lower border of the red declining trend channel (marked on the weekly chart), which serves as an additional support.
Very short-term outlook: mixed with bearish bias
Short-term outlook: mixed
MT outlook: mixed
LT outlook: mixed
Trading position (short-term; our opinion): No positions are justified from the risk/reward perspective. However, if we see a daily closure below the 38.2% Fibonacci retracement, we’ll consider opening short positions. We will keep you informed should anything change, or should we see a confirmation/invalidation of the above.
USD/CHF
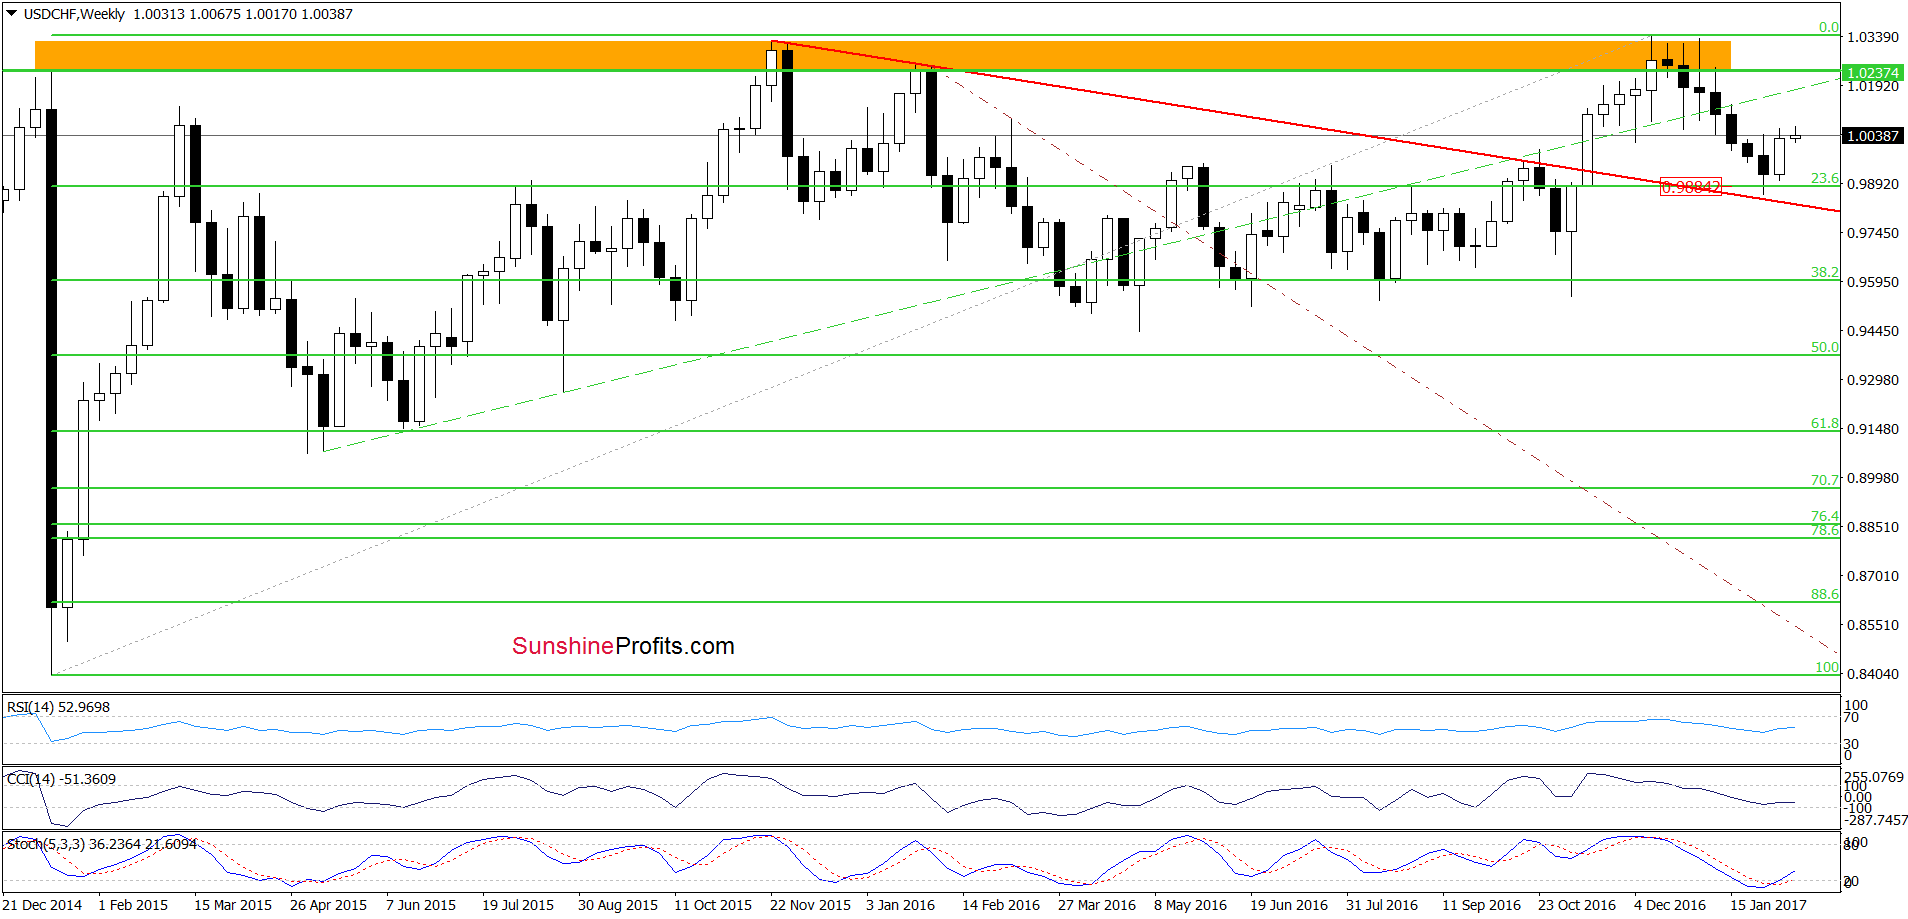
A week ago, we wrote the following:
(…) the buy signals generated by the indicators suggest further improvement and (at least) a test of our initial upside target.
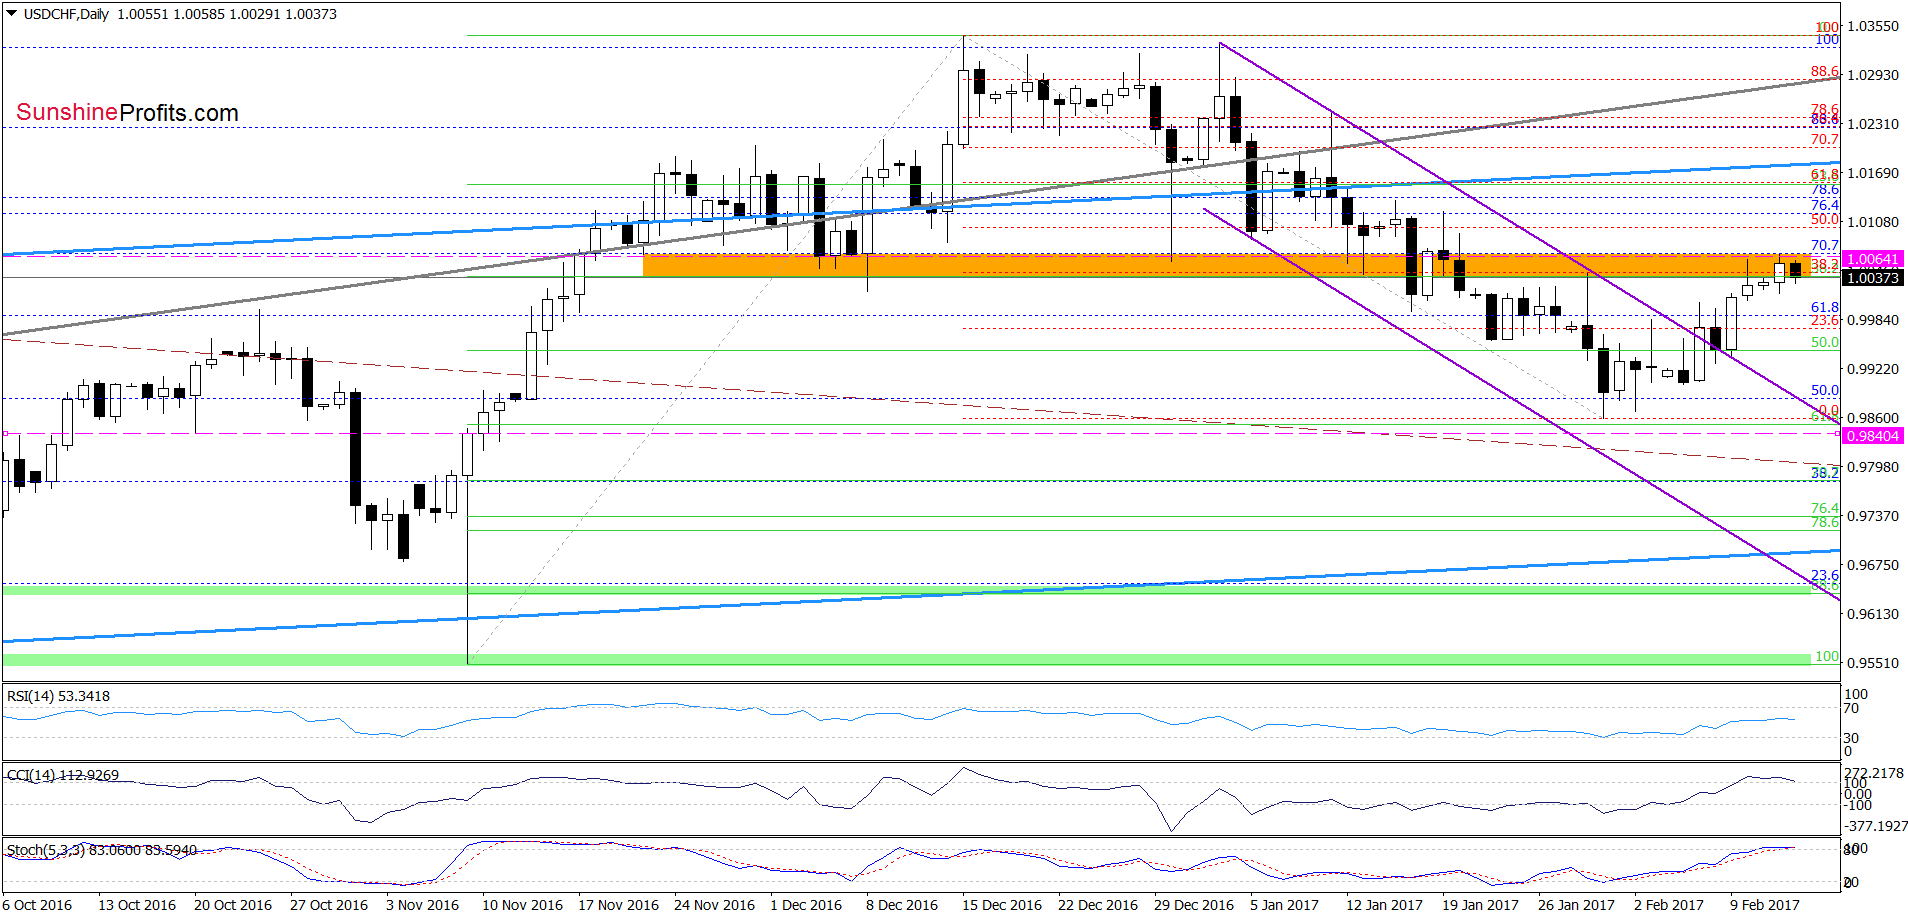
On the daily chart, we see that the situation developed in tune with our assumptions and USD/CHF reached our first upside target yesterday. Although the 38.2% Fibonacci retracement and the orange resistance zone triggered a small drop earlier today, there are no sell signals, which could encourage currency bears to act. Therefore, it seem that the exchange rate will extend gains and the pair will test the next Fibonacci retracement or even the previously-broken upper border of the blue rising trend channel in the following days.
Very short-term outlook: bullish
Short-term outlook: mixed with bullish bias
MT outlook: mixed
LT outlook: mixed
Trading position (short-term; our opinion): Long positions (with a stop-loss order at 0.9879 and the next upside target at 1.0100) are justified from the risk/reward perspective. We will keep you informed should anything change, or should we see a confirmation/invalidation of the above.
As a reminder – “initial target price” means exactly that – an “initial” one, it’s not a price level at which we suggest closing positions. If this becomes the case (like it did in the previous trade) we will refer to these levels as levels of exit orders (exactly as we’ve done previously). Stop-loss levels, however, are naturally not “initial”, but something that, in our opinion, might be entered as an order.
Thank you.
Nadia Simmons
Forex & Oil Trading Strategist
Przemyslaw Radomski, CFA
Founder, Editor-in-chief, Gold & Silver Fund Manager
Gold & Silver Trading Alerts
Forex Trading Alerts
Oil Investment Updates
Oil Trading Alerts

