

Although the British pound moved lower against the greenback in the previous week, the first important Fibonacci retracement stopped declines, triggering a pullback yesterday. Will we see further improvement and a test of the level of 1.2700 in the coming days?
In our opinion the following forex trading positions are justified - summary:
EUR/USD
Yesterday, we wrote the following:
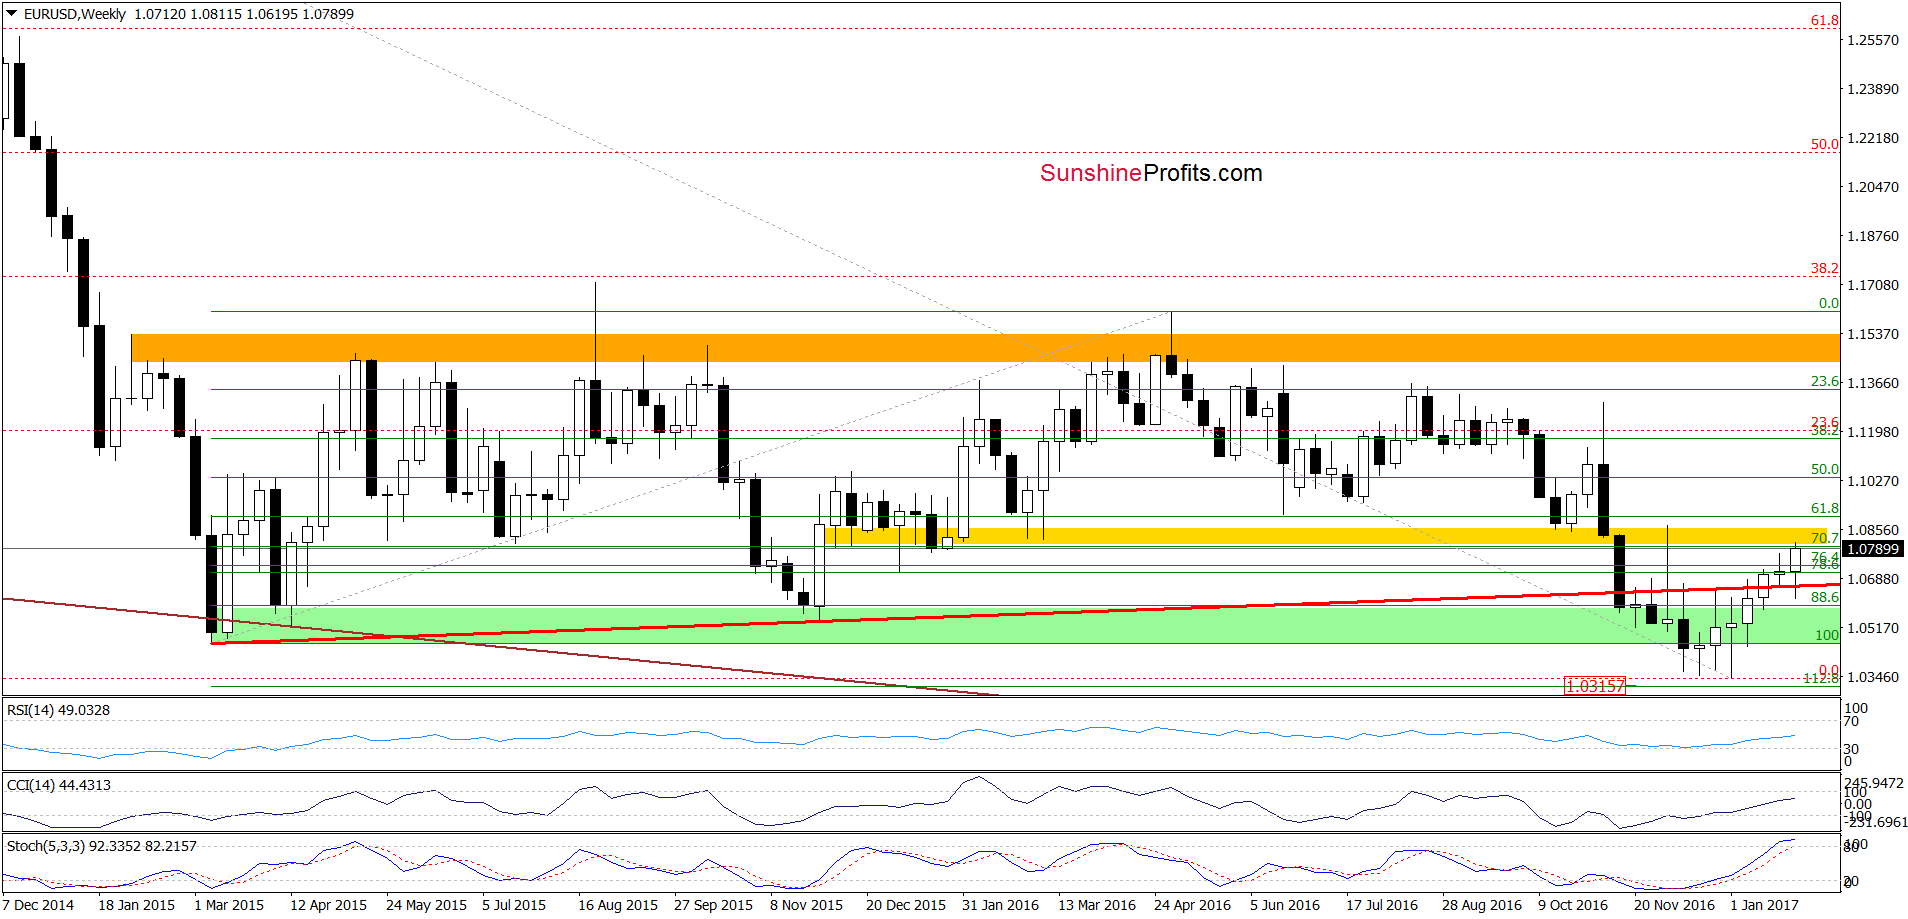
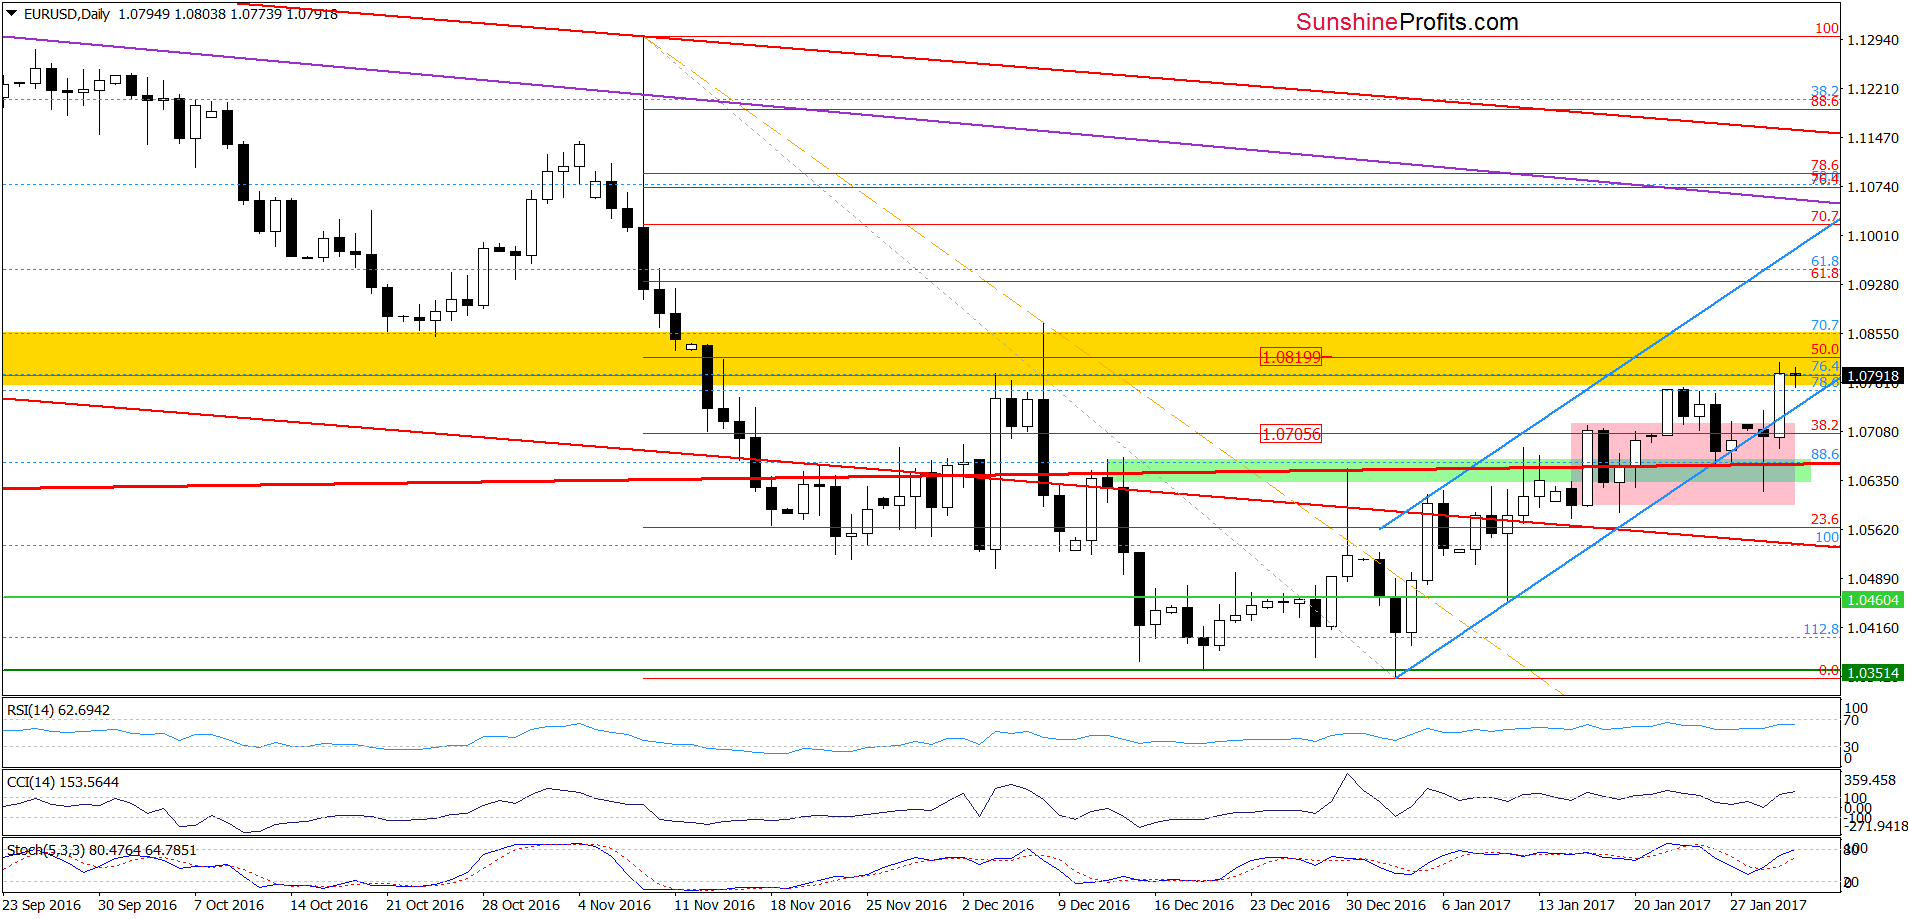
(...) an invalidation of the breakdown under the lower border of the blue rising trend channel (…) resulted in further improvement and a comeback above the upper line of the pink consolidation. Additionally, the Stochastic Oscillator generated a buy signal, suggesting further improvement in the following days. If this is the case and EUR/USD moves higher from here, we’ll see a re-test of the strength of the yellow resistance zone and even a climb to the 50% Fibonacci retracement based on the November-January downward moves.
From today’s point of view, we see that the situation developed in line with the above scenario and EUR/USD reached the yellow resistance zone, approaching the 50% Fibonacci retracement. What’s next? Taking into account the fact that the proximity to this resistance area was enough to trigger a pullback in the previous week, it seems that we’ll see a similar price action and a verification of a breakout above the lower border of the blue rising trend channel in the very near future. Nevertheless, we should keep in mind that as long as there is no drop below this support another upswing and a test of the upper border of the yellow resistance zone is likely – especially when we factor in the fact that the buy signals generated by the weekly and daily indicators are still in play.
Very short-term outlook: mixed with bullish bias
Short-term outlook: mixed
MT outlook: mixed
LT outlook: mixed
Trading position (short-term; our opinion): No positions are justified from the risk/reward perspective. We will keep you informed should anything change, or should we see a confirmation/invalidation of the above.
GBP/USD
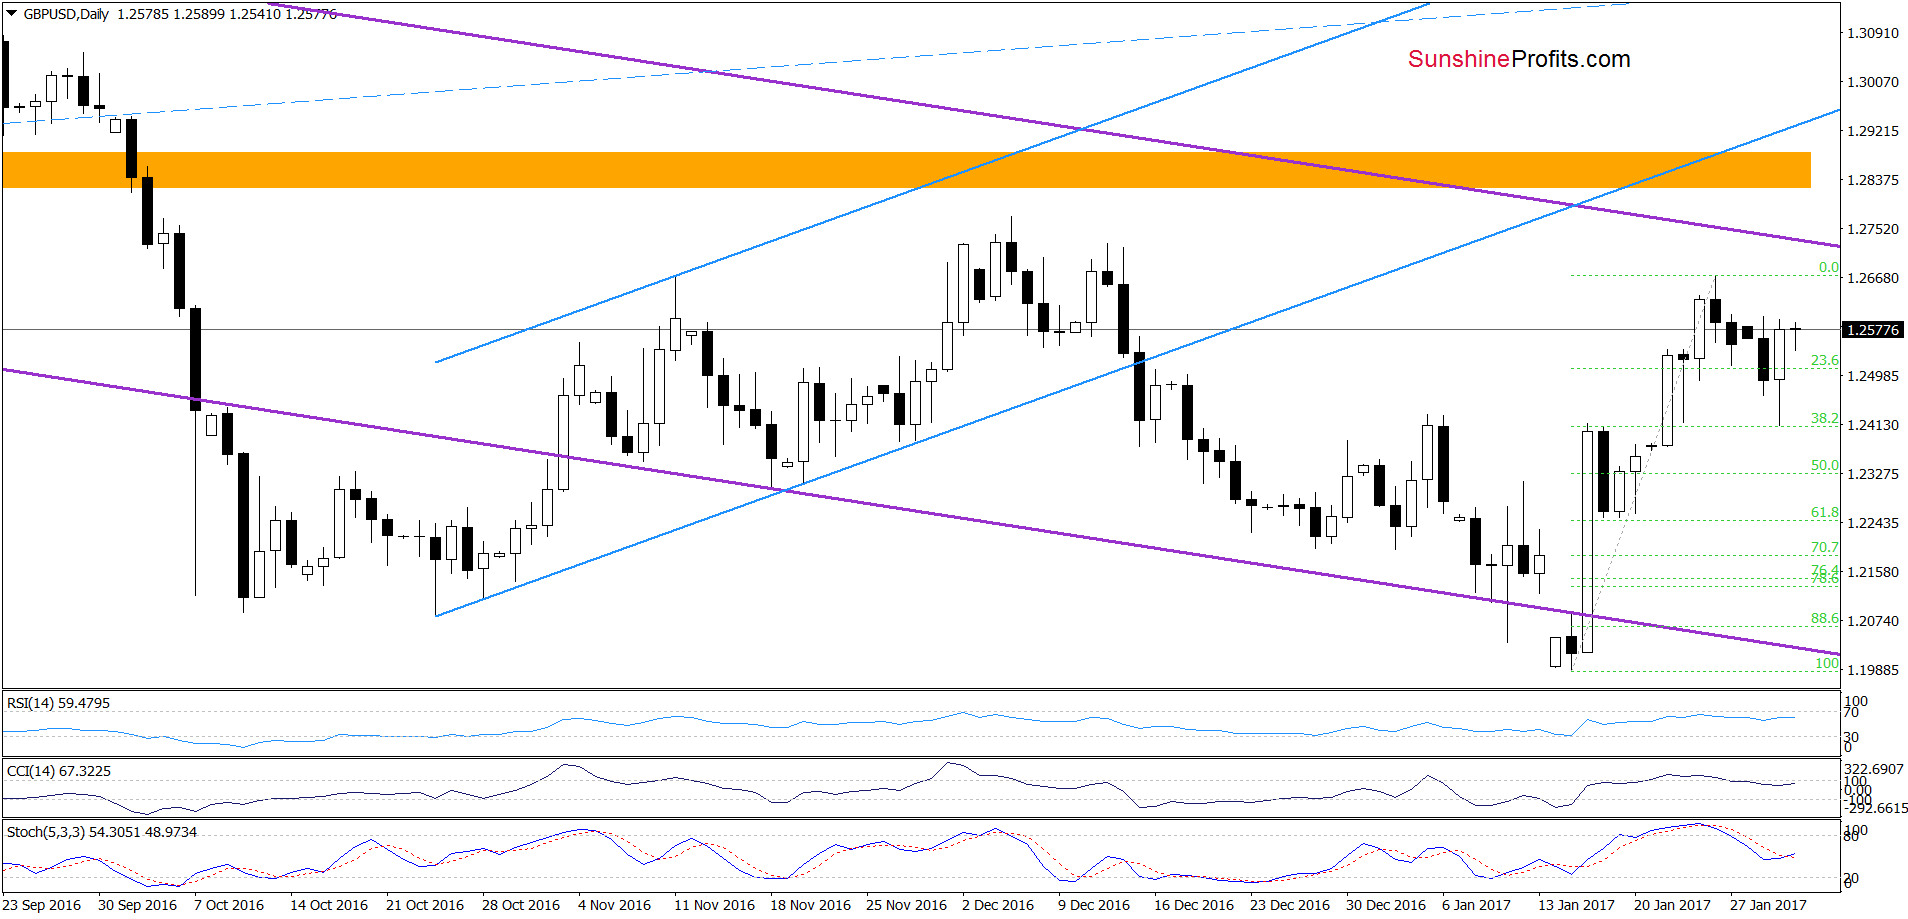
Looking at the daily chart, we see that although GBP/USD gave up some gains in the previous days, the 38.2% Fibonacci retracement based on the January upward move stopped further deterioration and triggered a rebound. Additionally, the Stochastic Oscillator generated a buy signal, suggesting another attempt to move higher. How high could the pair go in the coming days? We think that the best answer to this question will be the quote from our Forex Trading Alert posted on February 23:
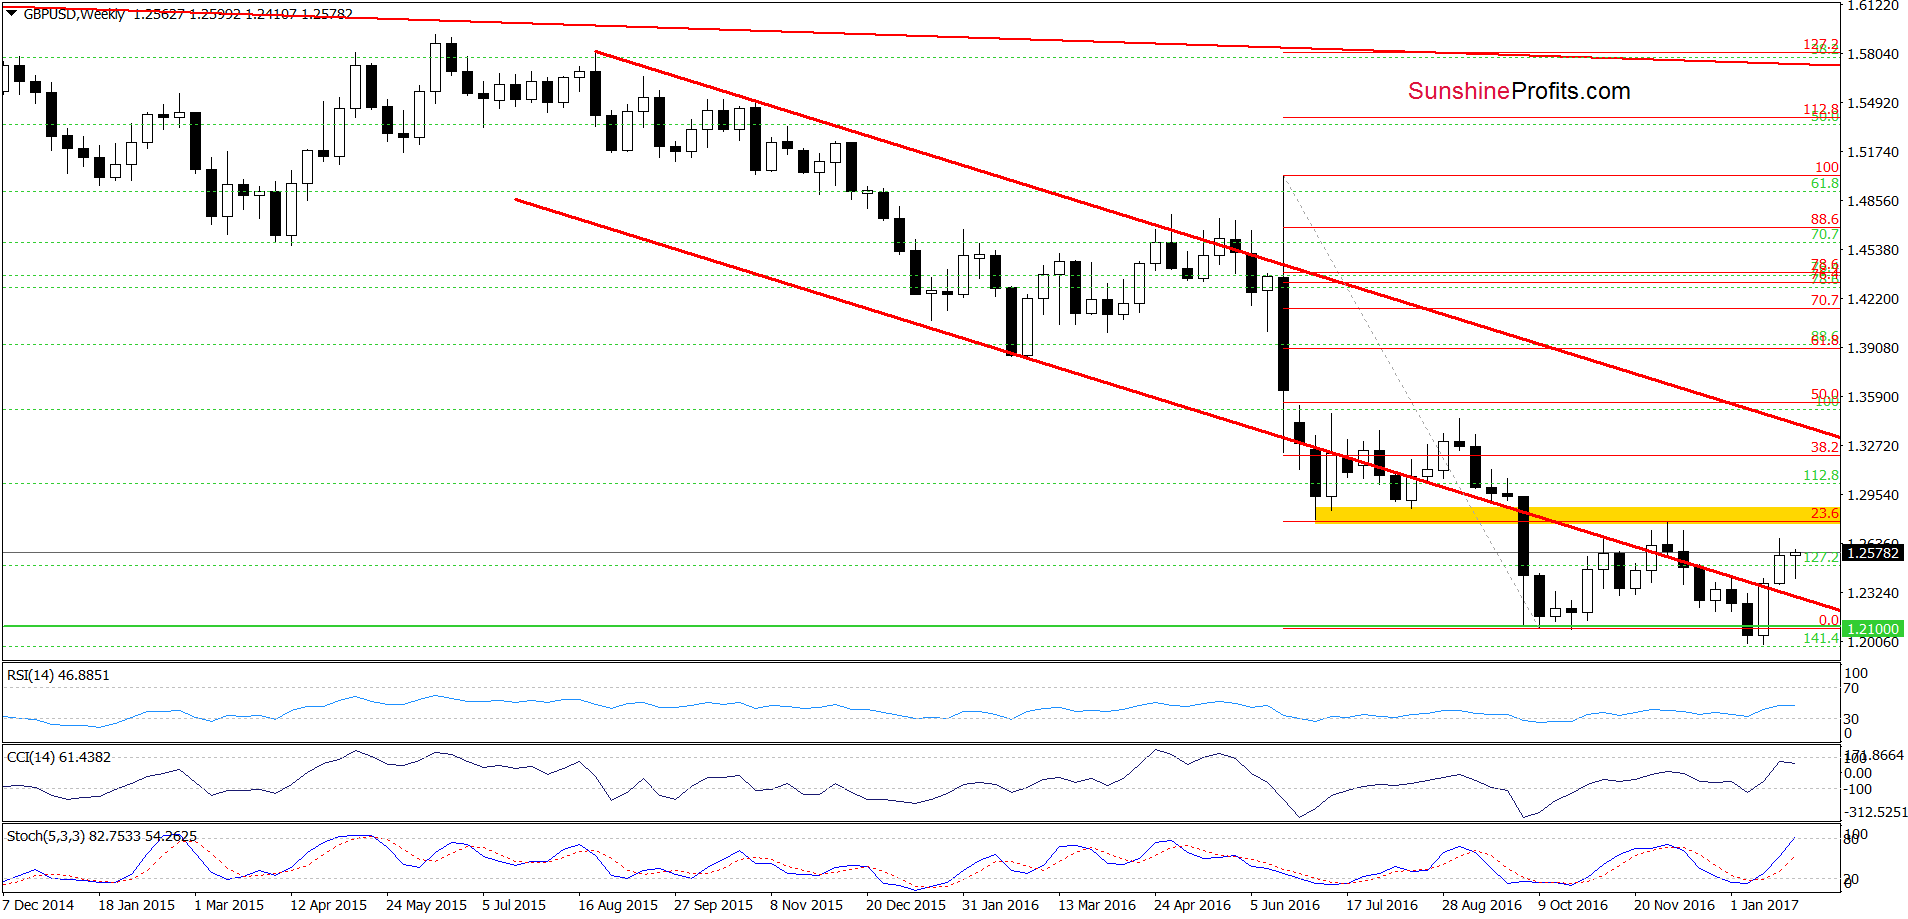
(…) the exchange rate climbed above the previously-broken lower border of the red declining trend channel, invalidating the earlier breakdown. This is a positive signal (…), which suggests that we may see an increase even to the upper border of the purple declining trend channel seen on the daily chart. In this area is also the yellow resistance zone marked on the weekly chart, which could stop further improvement.
Very short-term outlook: mixed with bullish bias
Short-term outlook: mixed
MT outlook: mixed
LT outlook: bearish
Trading position (short-term; our opinion): No positions are justified from the risk/reward perspective. We will keep you informed should anything change, or should we see a confirmation/invalidation of the above.
USD/CHF
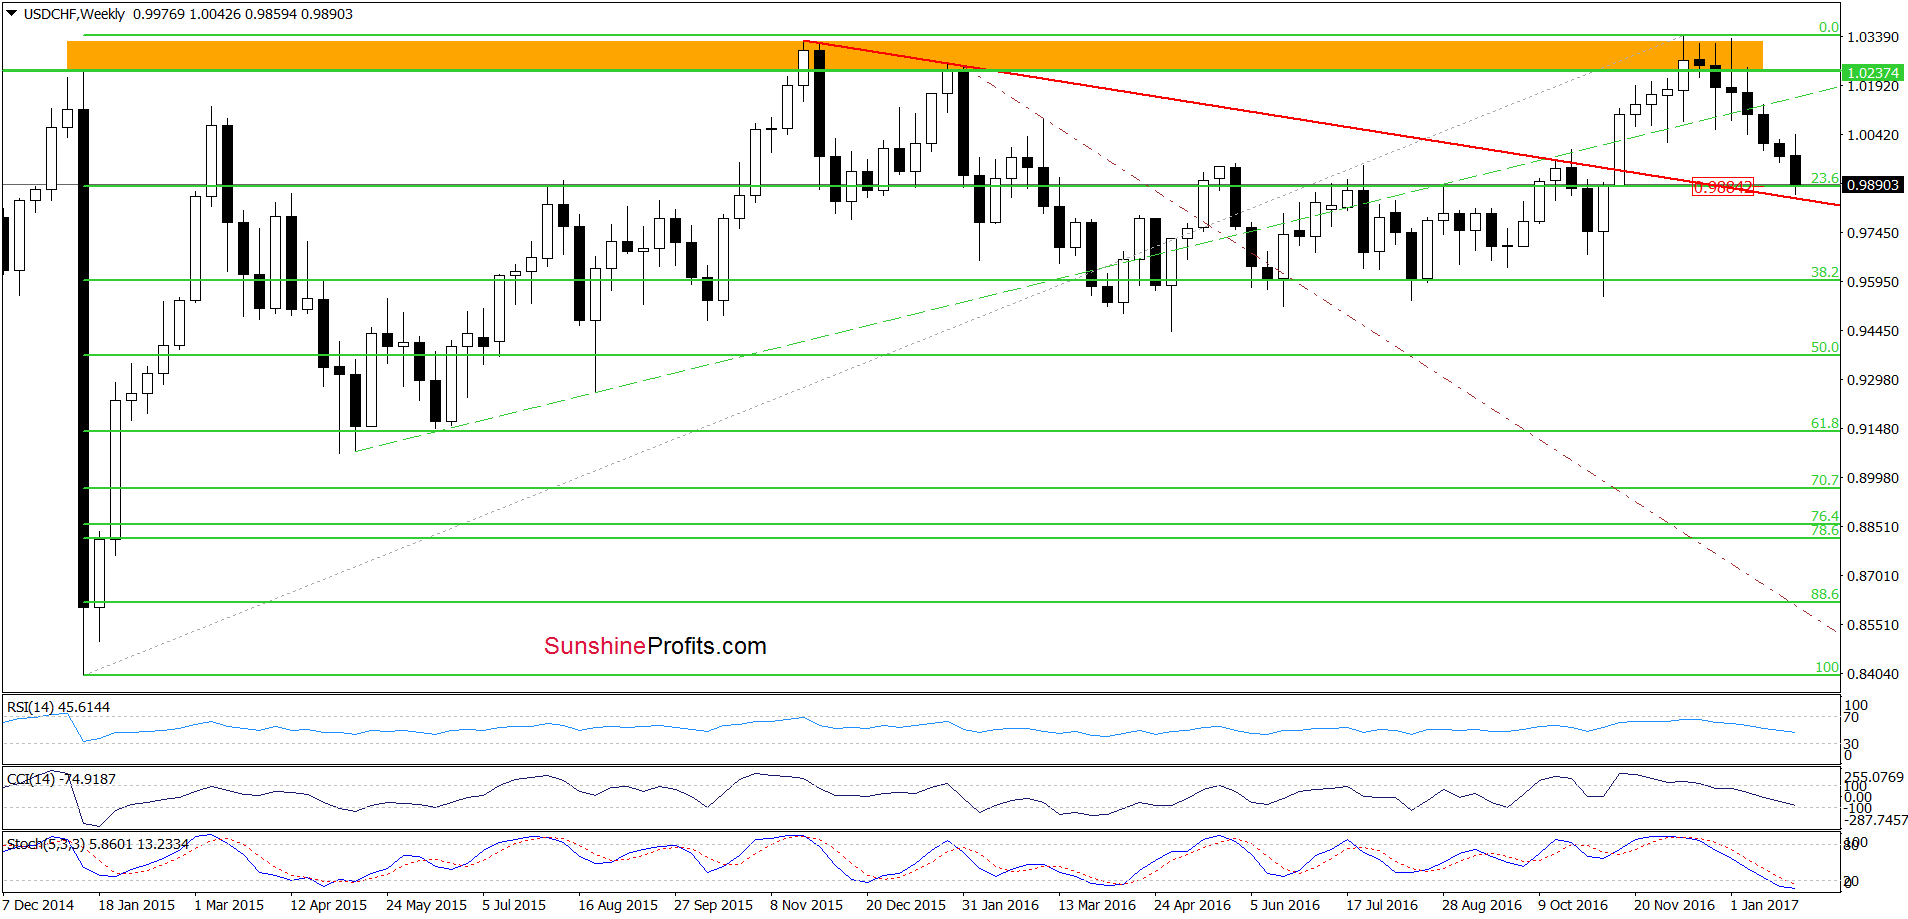
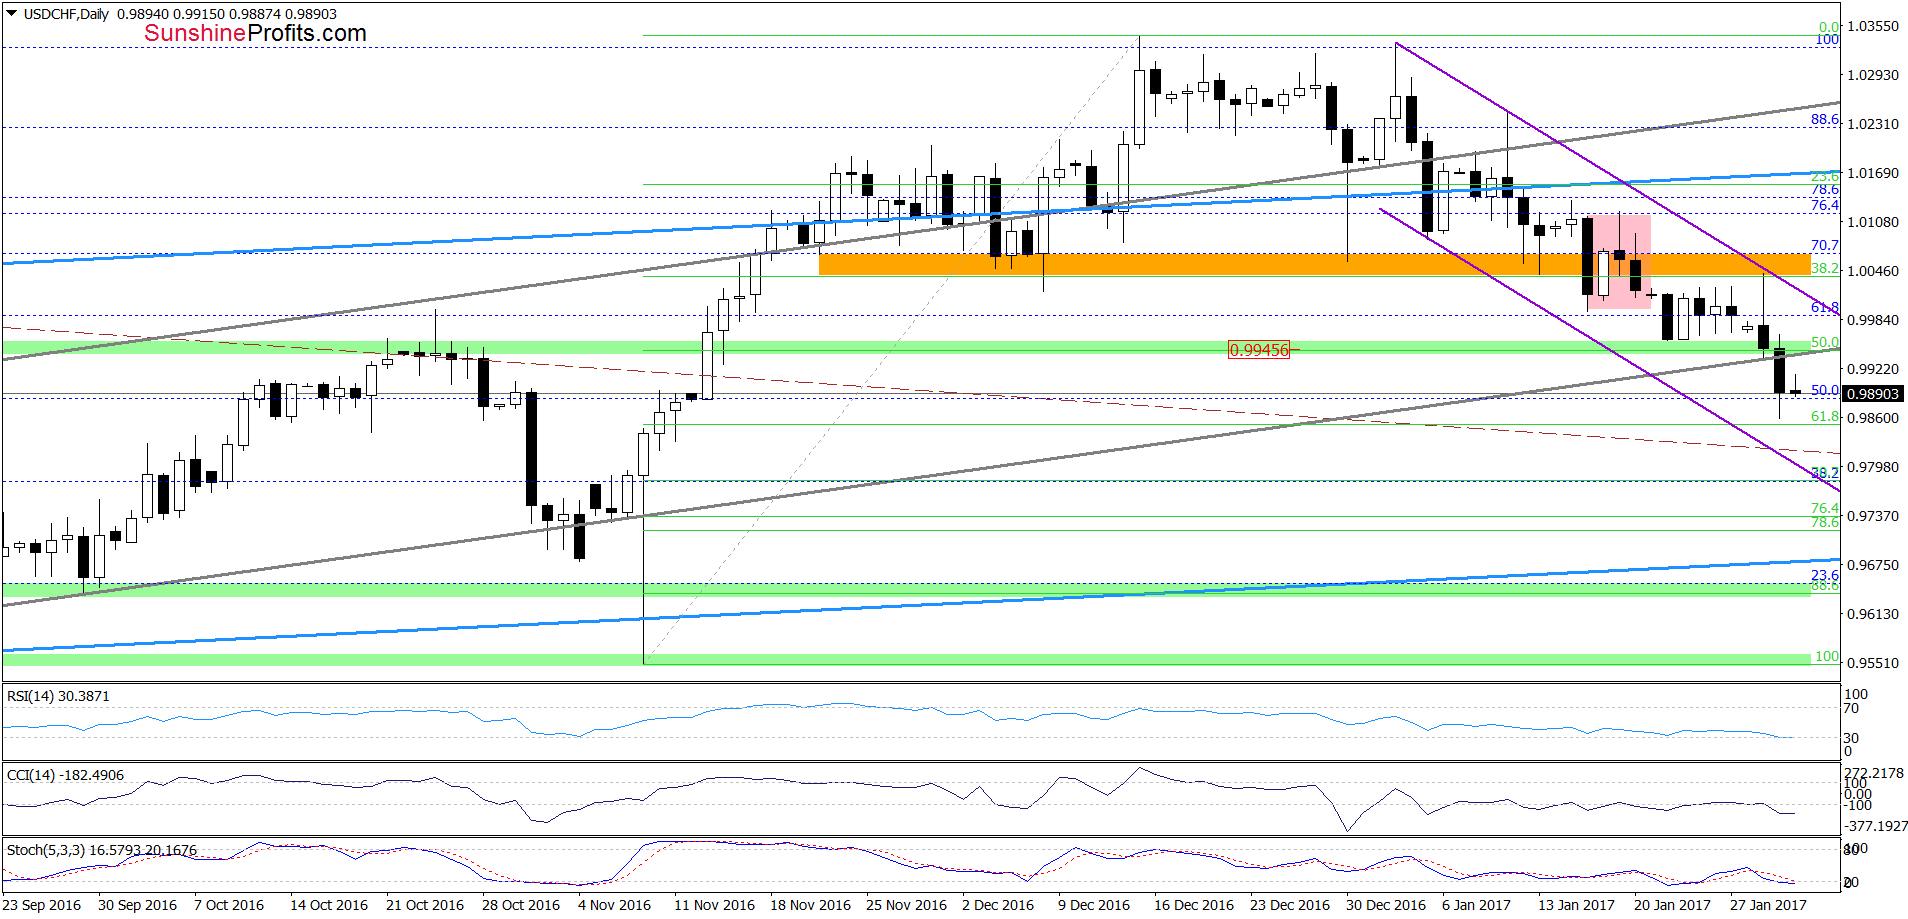
Looking at the daily chart we see that the situation in the very short term has deteriorated as USD/CHF broke below the green support zone and closed yesterday’s session below it. Taking this fact into account, we think that the exchange rate will extend losses and test the red declining line based on the November 2015 and January 2016 peaks (currently around 0.9838) in the very near future. However, as long as there are no buy signals generated by the indicators, further deterioration is likely. Therefore, if the pair drops under the red line seen on the weekly chart, the next downside target for currency bears will be the lower border of the purple declining trend channel marked on the daily chart (currently round 0.9800).
Very short-term outlook: bearish
Short-term outlook: mixed
MT outlook: mixed
LT outlook: mixed
Trading position (short-term; our opinion): No positions are justified from the risk/reward perspective. We will keep you informed should anything change, or should we see a confirmation/invalidation of the above.
Thank you.
Nadia Simmons
Forex & Oil Trading Strategist
Przemyslaw Radomski, CFA
Founder, Editor-in-chief, Gold & Silver Fund Manager
Gold & Silver Trading Alerts
Forex Trading Alerts
Oil Investment Updates
Oil Trading Alerts

