

In our opinion the following forex trading positions are justified - summary:
EUR/USD
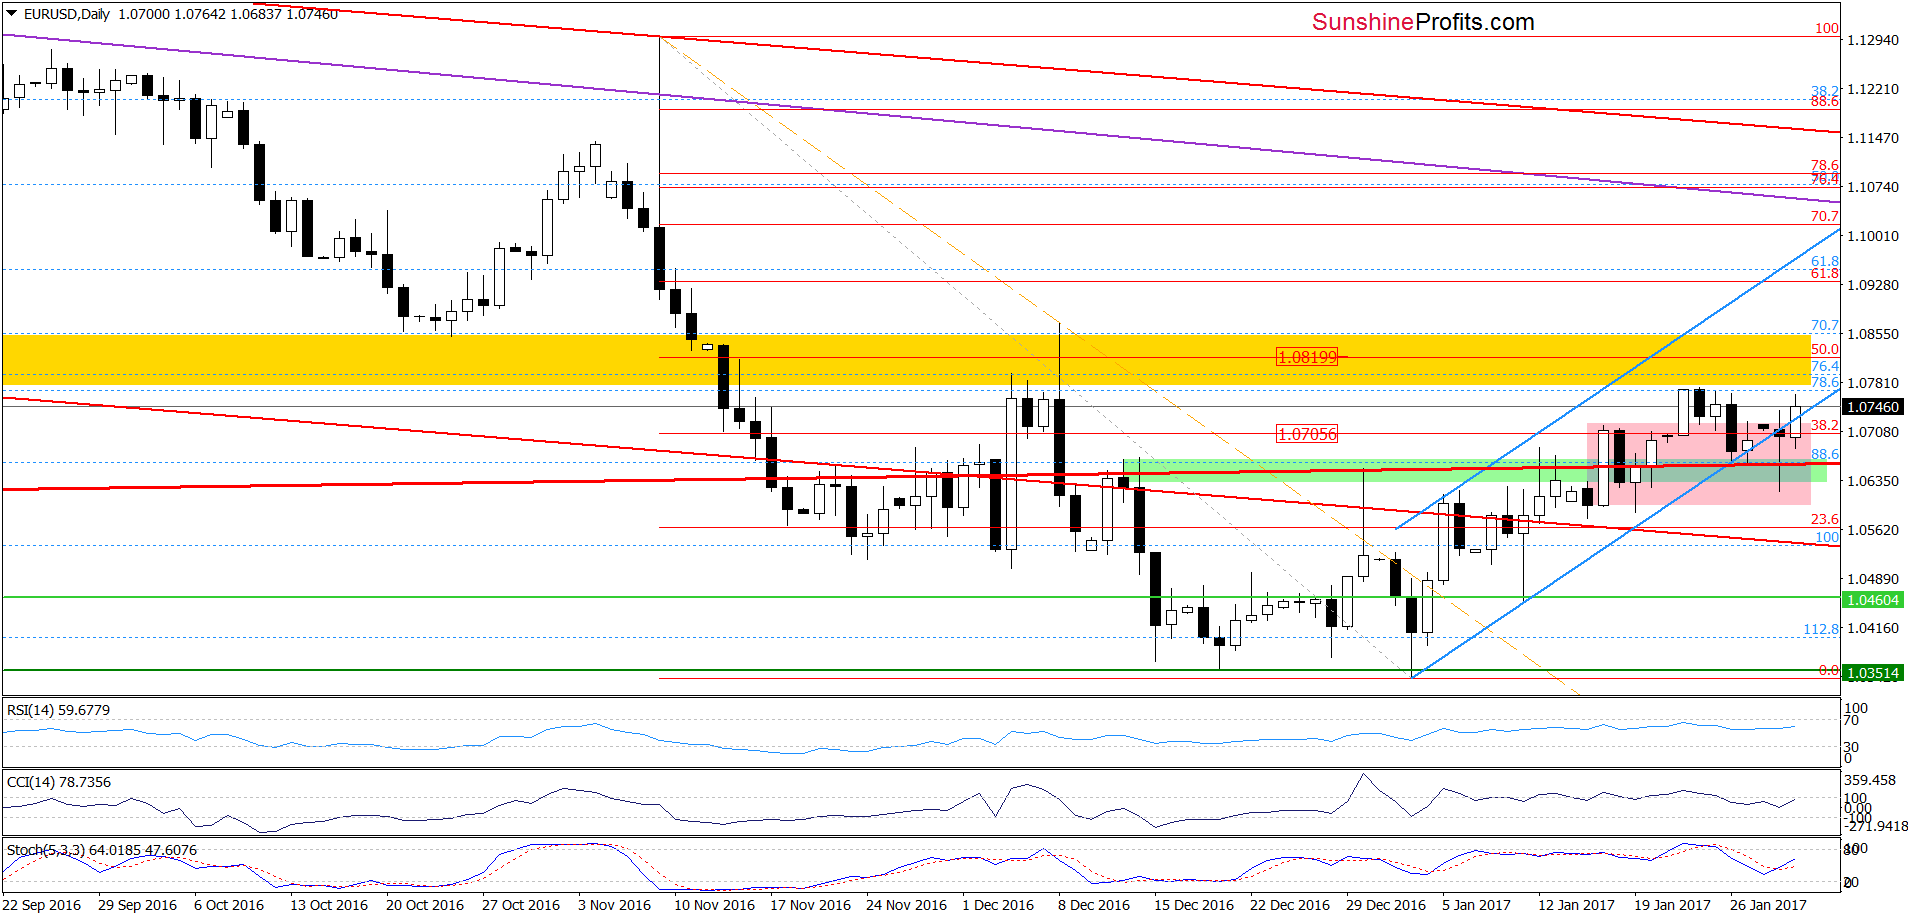
The first thing that catches the eye on the daily chart is an invalidation of the breakdown under the lower border of the blue rising trend channel. This positive event encouraged currency bulls to act, which resulted in further improvement and a comeback above the upper line of the pink consolidation. Additionally, the Stochastic Oscillator generated a buy signal, suggesting further improvement in the following days. If this is the case and EUR/USD moves higher from here, we’ll see a re-test of the strength of the yellow resistance zone and even a climb to the 50% Fibonacci retracement based on the November-January downward moves.
Very short-term outlook: mixed with bullish bias
Short-term outlook: mixed
MT outlook: mixed
LT outlook: mixed
Trading position (short-term; our opinion): No positions are justified from the risk/reward perspective. We will keep you informed should anything change, or should we see a confirmation/invalidation of the above.
USD/CAD
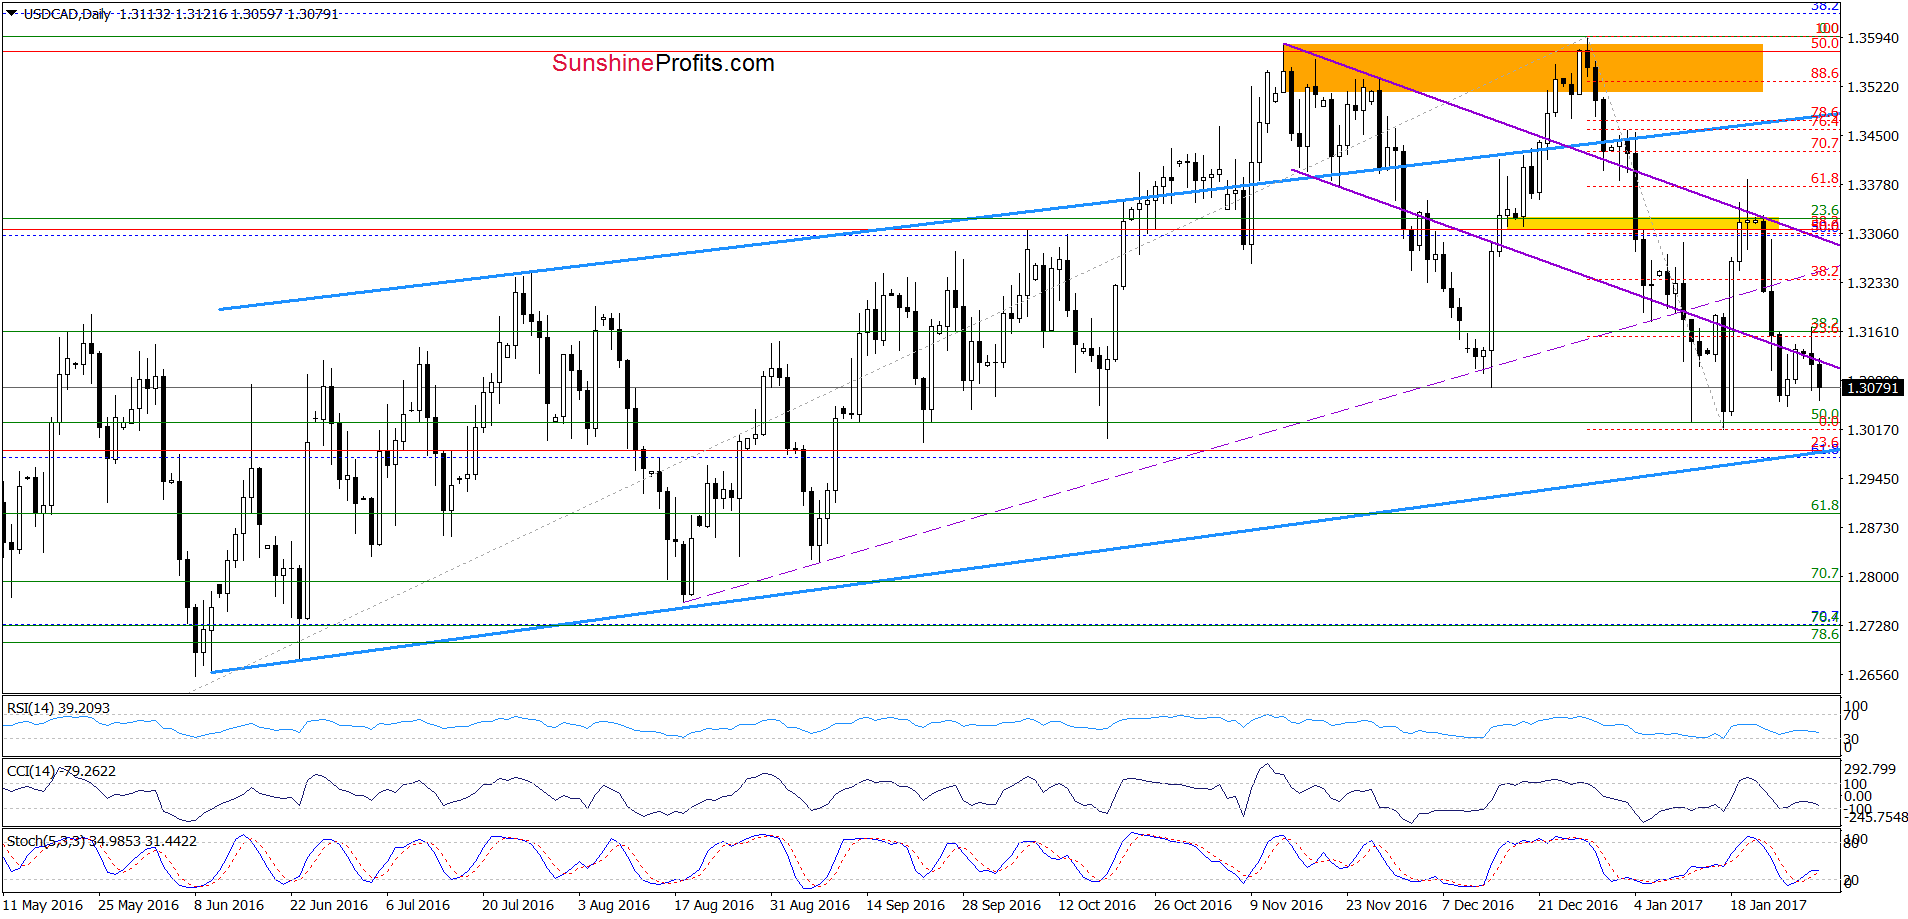
On the daily chart, we see that USD/CAD gave up the earlier gains and came back below the previously-broken lower purple resistance line which means that what we wrote on Friday is up-to-date also today:
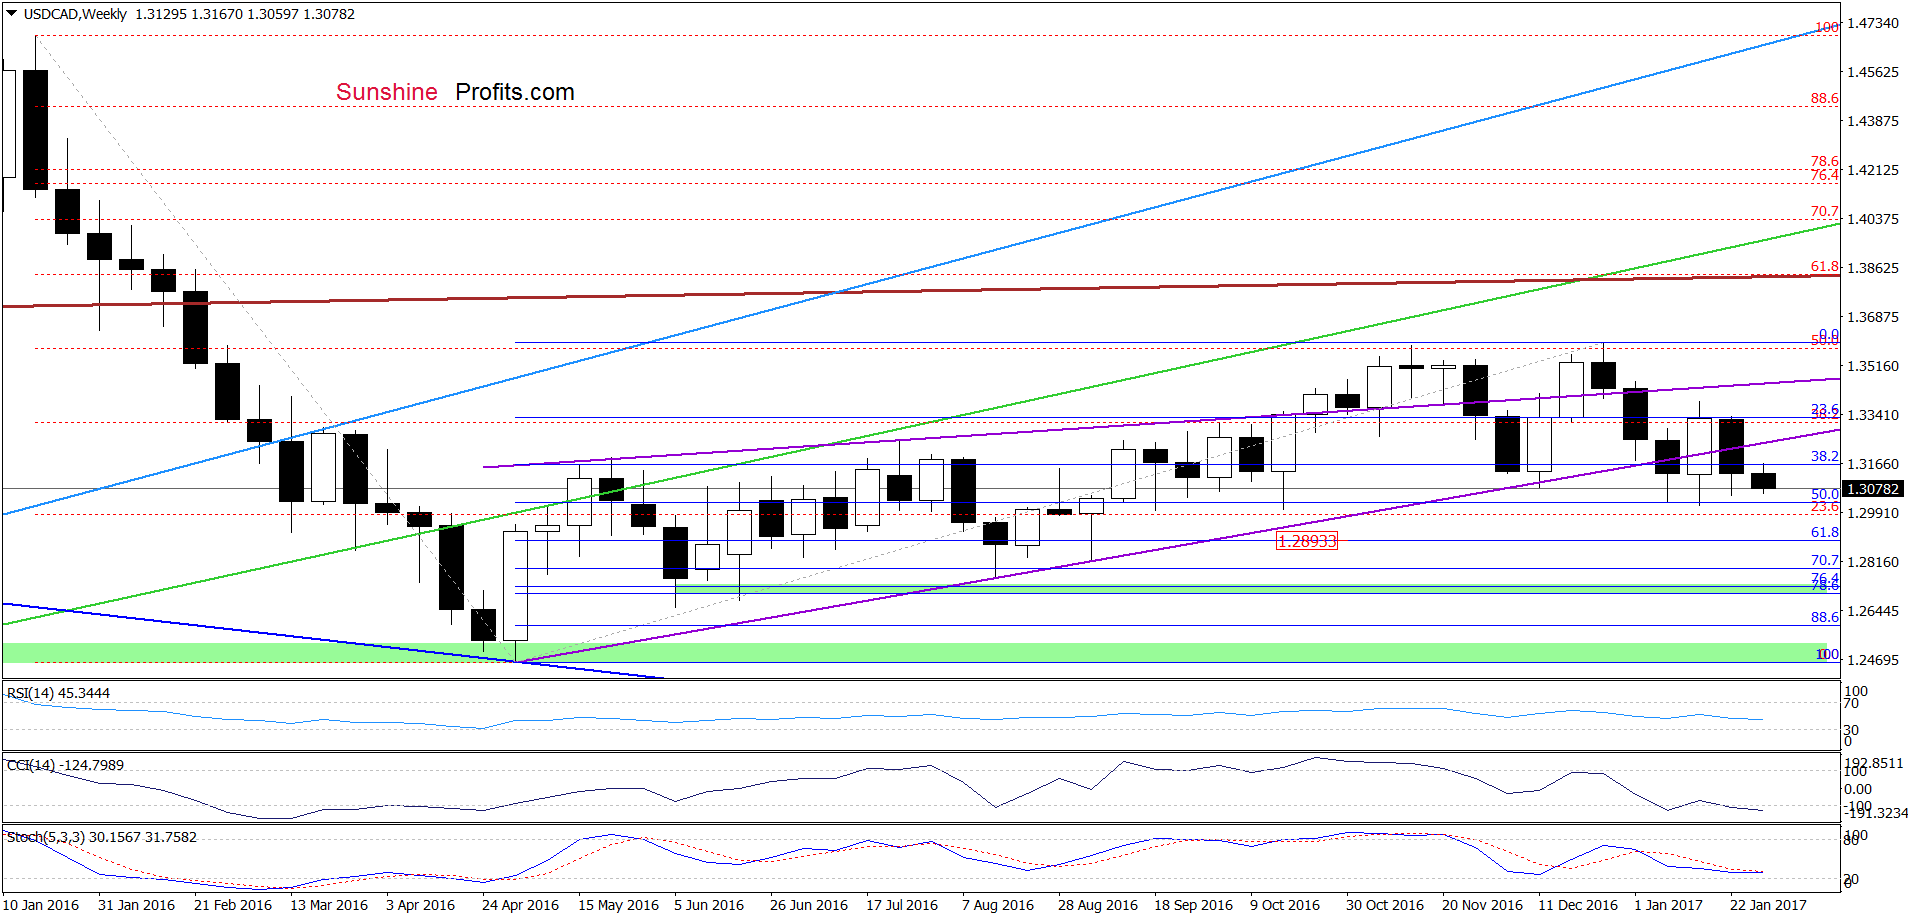
(…)Although the pair rebounded in recent days, the exchange rate still remains under the previously-broken lower purple resistance line, which suggests that the current upswing could be nothing more than a verification of the earlier breakdown. Additionally, (…) the sell signals generated by the weekly indicators remain in place suggesting lower values of USD/CAD in the coming days. If this is the case and the exchange rate declines from here, (…), it seems that the exchange rate will move lower once again and test the lower border of the blue rising tend channel (seen on the daily chart) in the coming days.
Very short-term outlook: bearish
Short-term outlook: mixed
MT outlook: mixed
LT outlook: mixed
Trading position (short-term; our opinion): No positions are justified from the risk/reward perspective. We will keep you informed should anything change, or should we see a confirmation/invalidation of the above.
AUD/USD
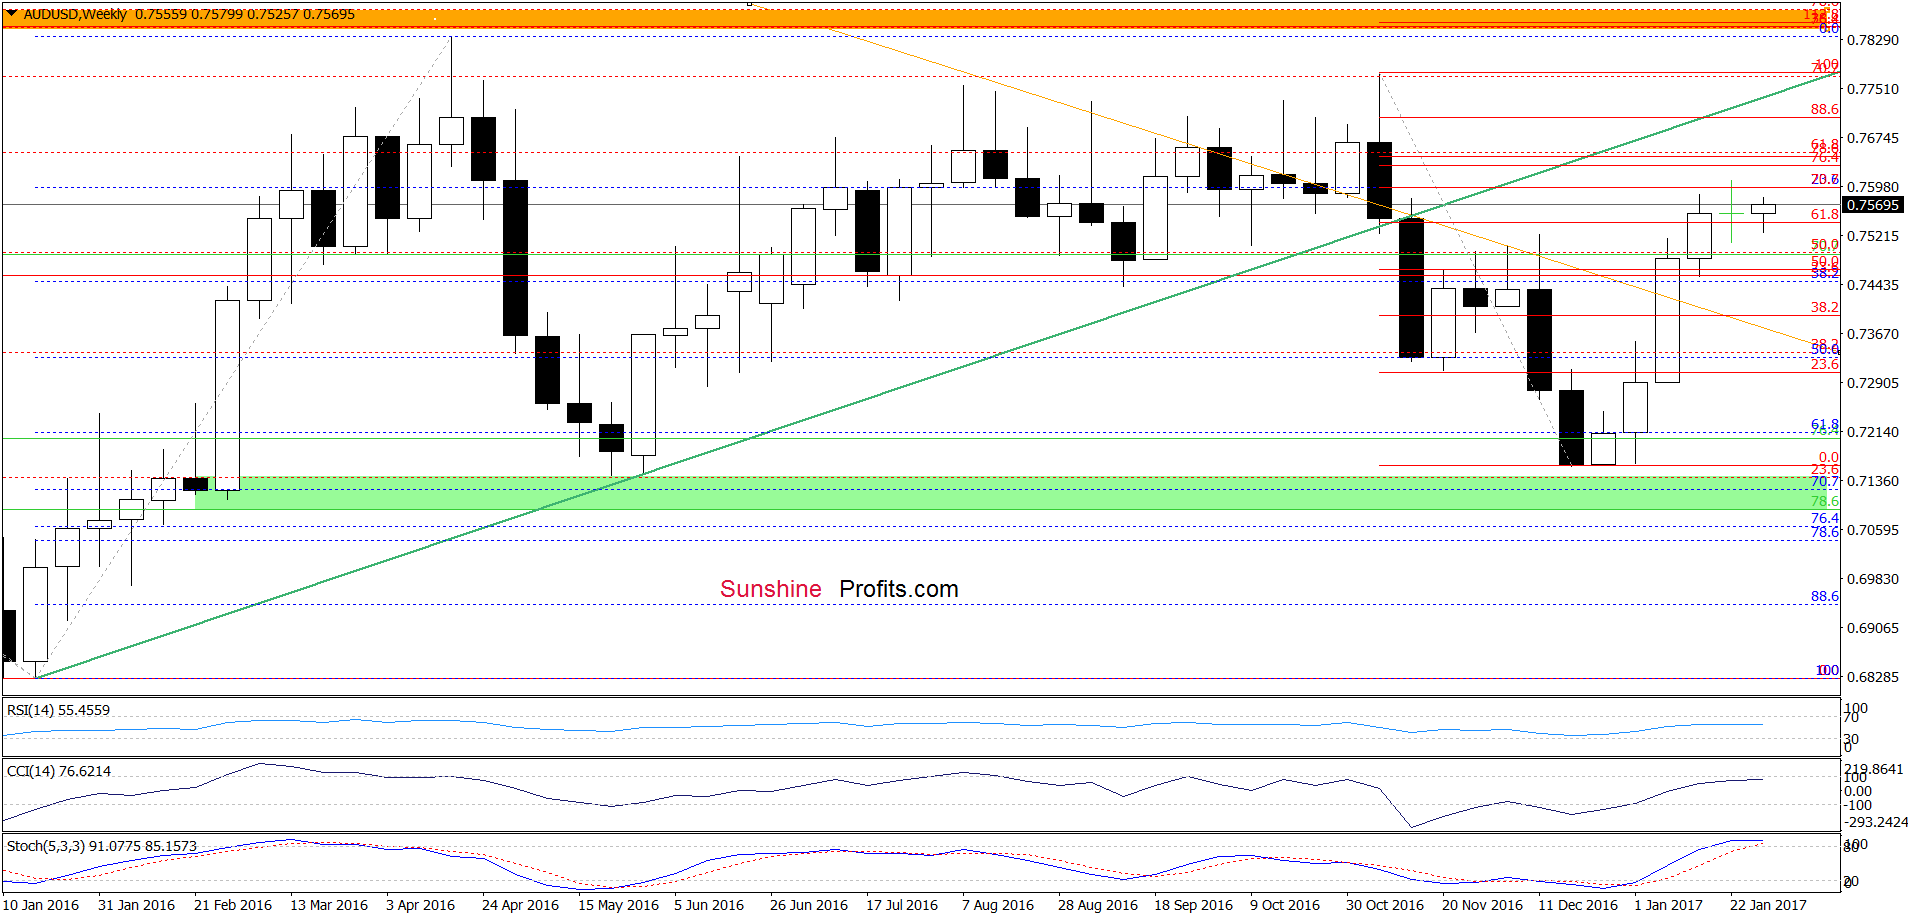
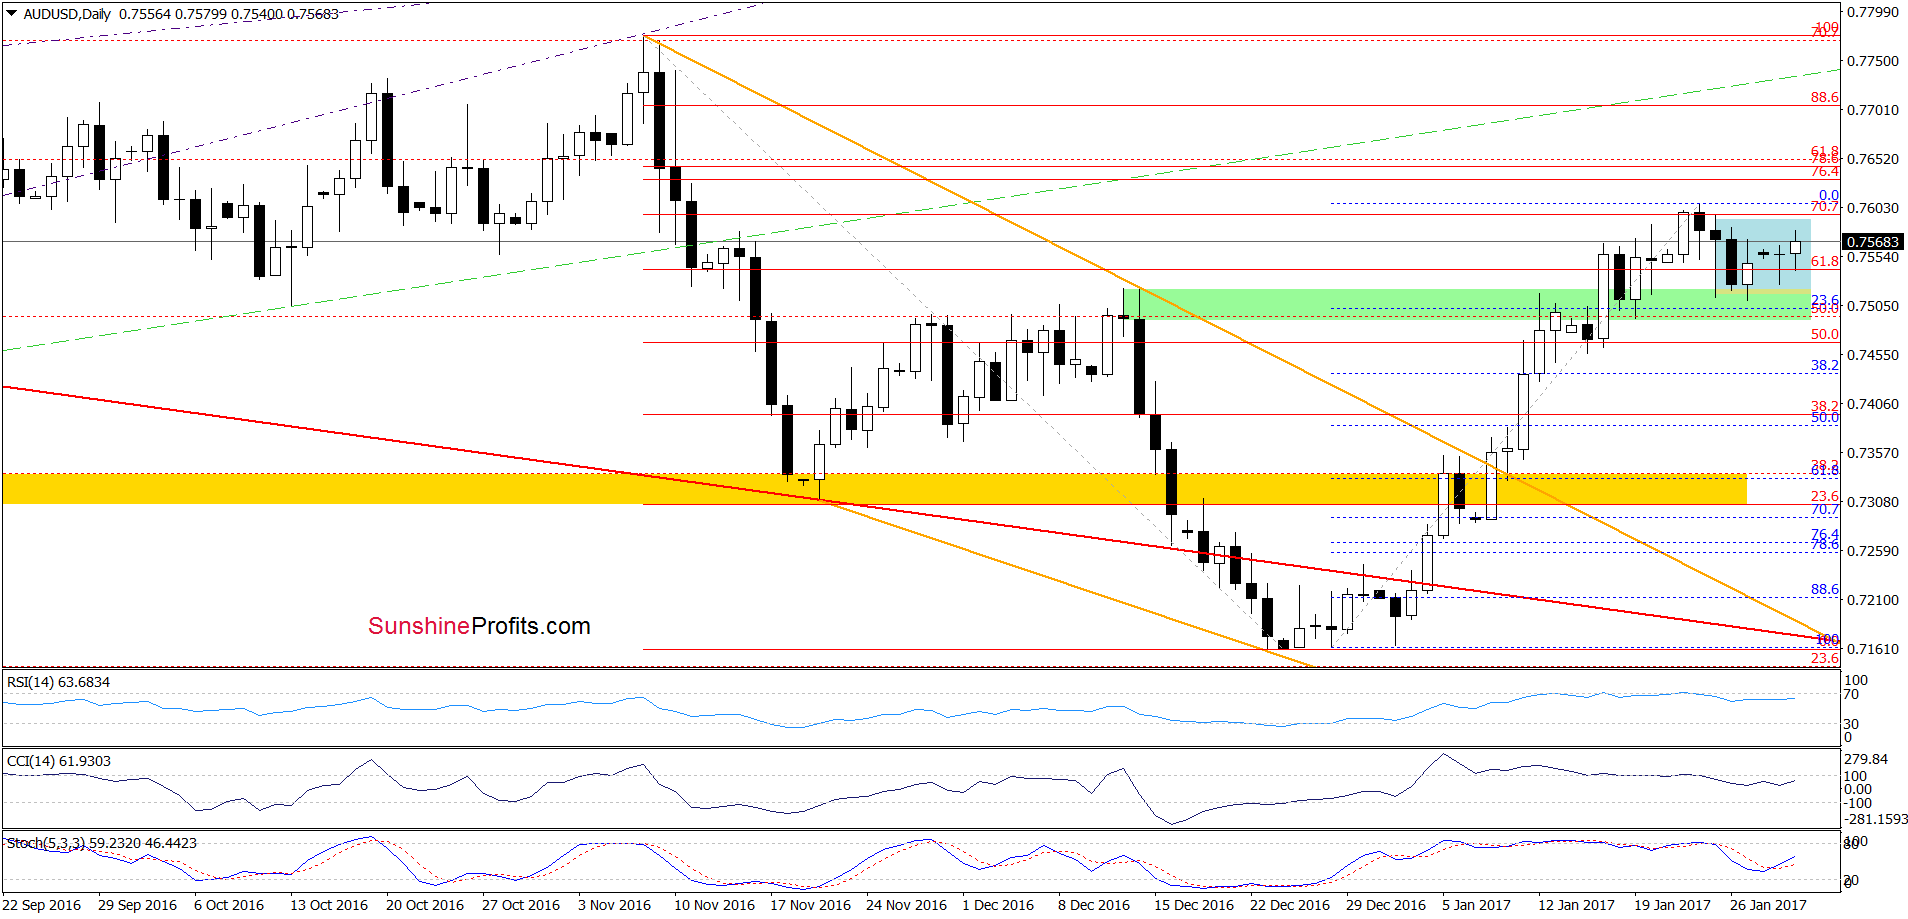
Looking at the daily chart, we see that the situation in the very short term hasn’t changed much as AUD/USD is still trading in the blue consolidation above the green support zone, which makes the picture unclear. Nevertheless, taking into account the buy signal generated by the Stochastic Oscillator, it seems that currency bulls will try to push the pair higher in the coming days. If this is the case, and the exchange rate breaks above the upper border of the consolidation, we’ll see not only a test of the recent highs, but also an increase to the resistance zone created by the 76.4% and 78.6% Fibonacci retracement levels (around 0.7629-0.7643). If this area is broken, the next target will be around 0.7677, where the size of the upward move will correspond to the height of the blue consolidation.
Very short-term outlook: mixed with bullish bias
Short-term outlook: mixed
MT outlook: mixed
LT outlook: mixed
Trading position (short-term; our opinion): No positions are justified from the risk/reward perspective. We will keep you informed should anything change, or should we see a confirmation/invalidation of the above.
Thank you.
Nadia Simmons
Forex & Oil Trading Strategist
Przemyslaw Radomski, CFA
Founder, Editor-in-chief, Gold & Silver Fund Manager
Gold & Silver Trading Alerts
Forex Trading Alerts
Oil Investment Updates
Oil Trading Alerts

