

Earlier today the USD Index extended losses and slipped under 101. What impact did this decrease have on the technical picture of our currency pairs?
In our opinion the following forex trading positions are justified - summary:
EUR/USD
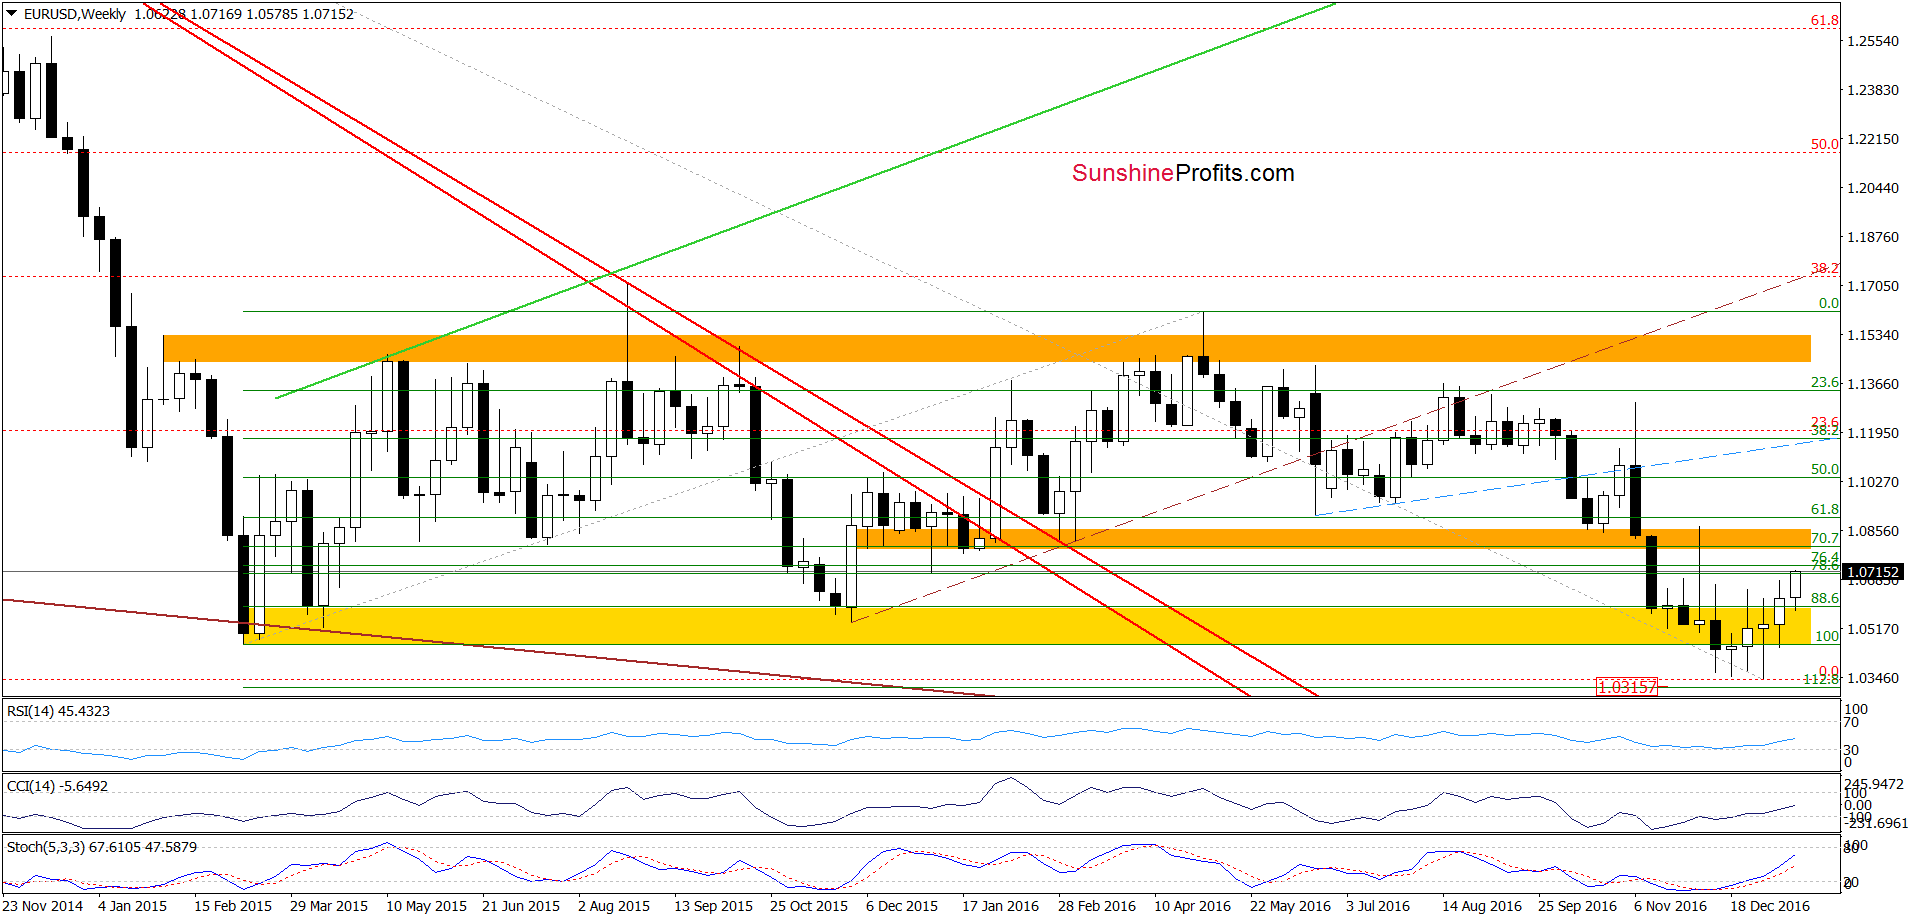
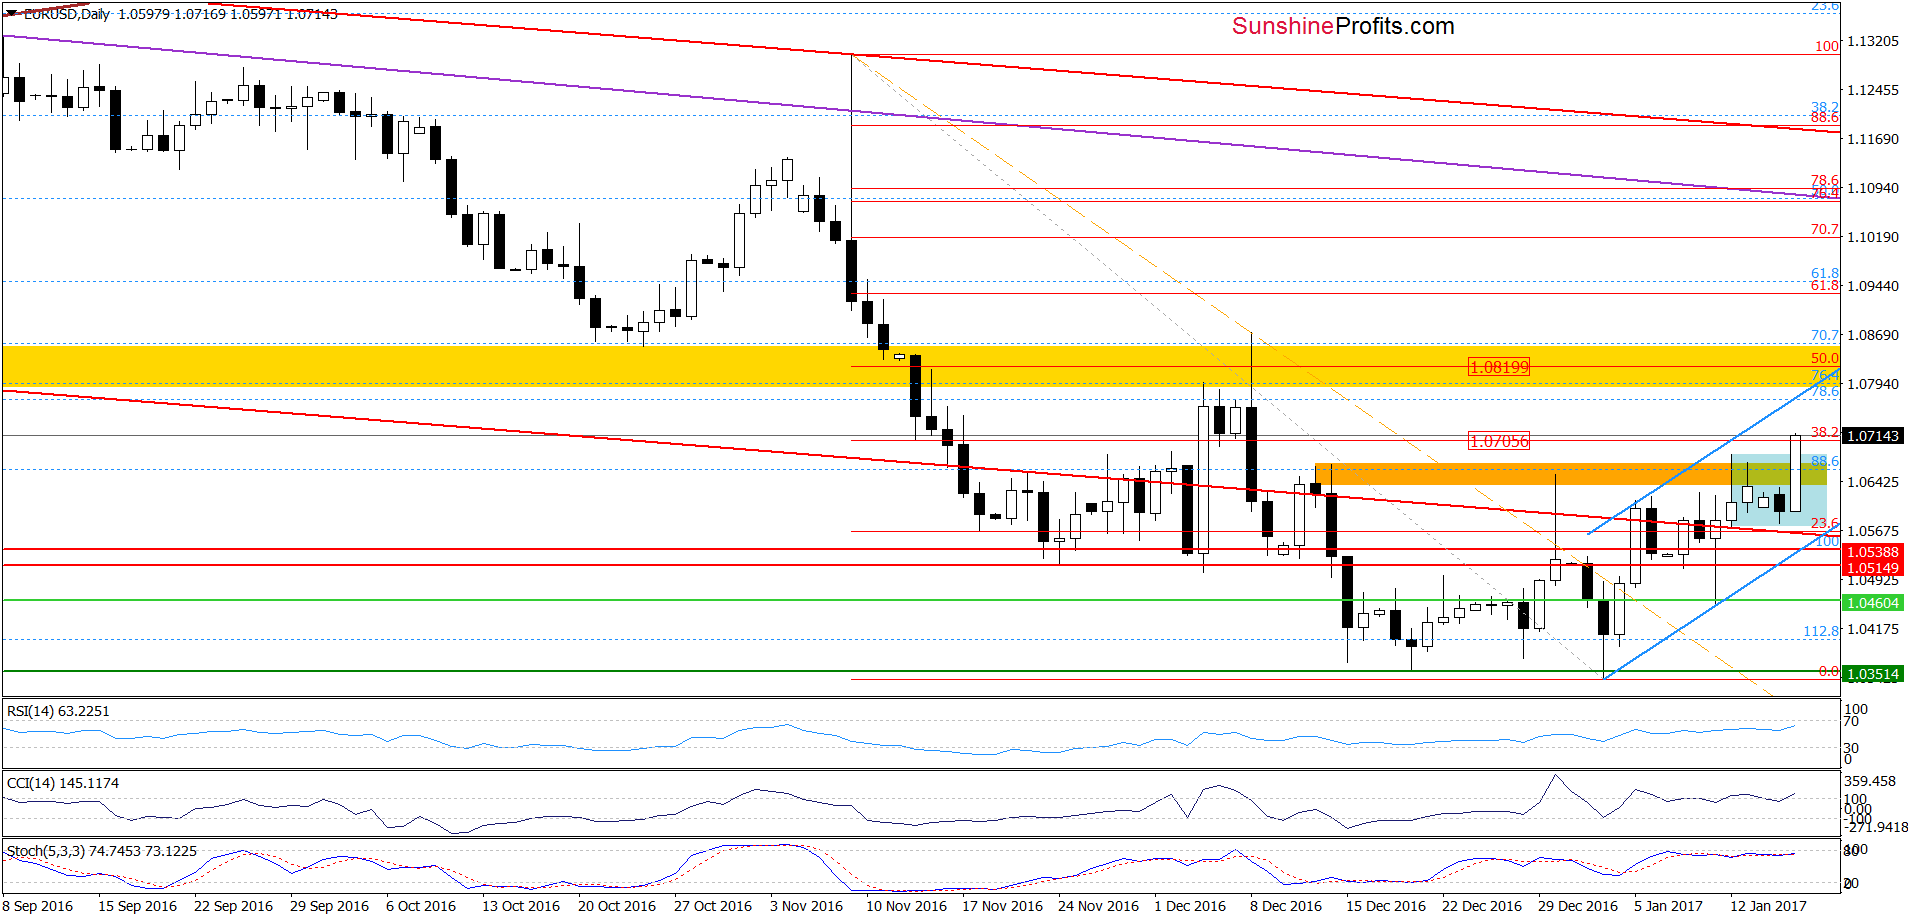
Looking at the daily chart, we see that EUR/USD broke above the upper border of the blue consolidation and the orange resistance zone, reaching the 38.2% Fibonacci retracement, which could pause further improvements. Nevertheless, as long as there is no invalidation of the earlier breakouts another attempt to move higher is likely. Therefore, if the exchange rate closes today’s session above the mentioned Fibonacci retracement, we’ll likely see a test of the upper border of the blue rising trend channel in the following day(s). Finishing today’s commentary on this currency pair, please note that the current position of the daily indicators suggests that a reversal is just around the corner.
Very short-term outlook: mixed
Short-term outlook: mixed
MT outlook: mixed
LT outlook: mixed
Trading position (short-term; our opinion): No positions are justified from the risk/reward perspective. We will keep you informed should anything change, or should we see a confirmation/invalidation of the above.
GBP/USD
Quoting our last commentary on this currency pair:
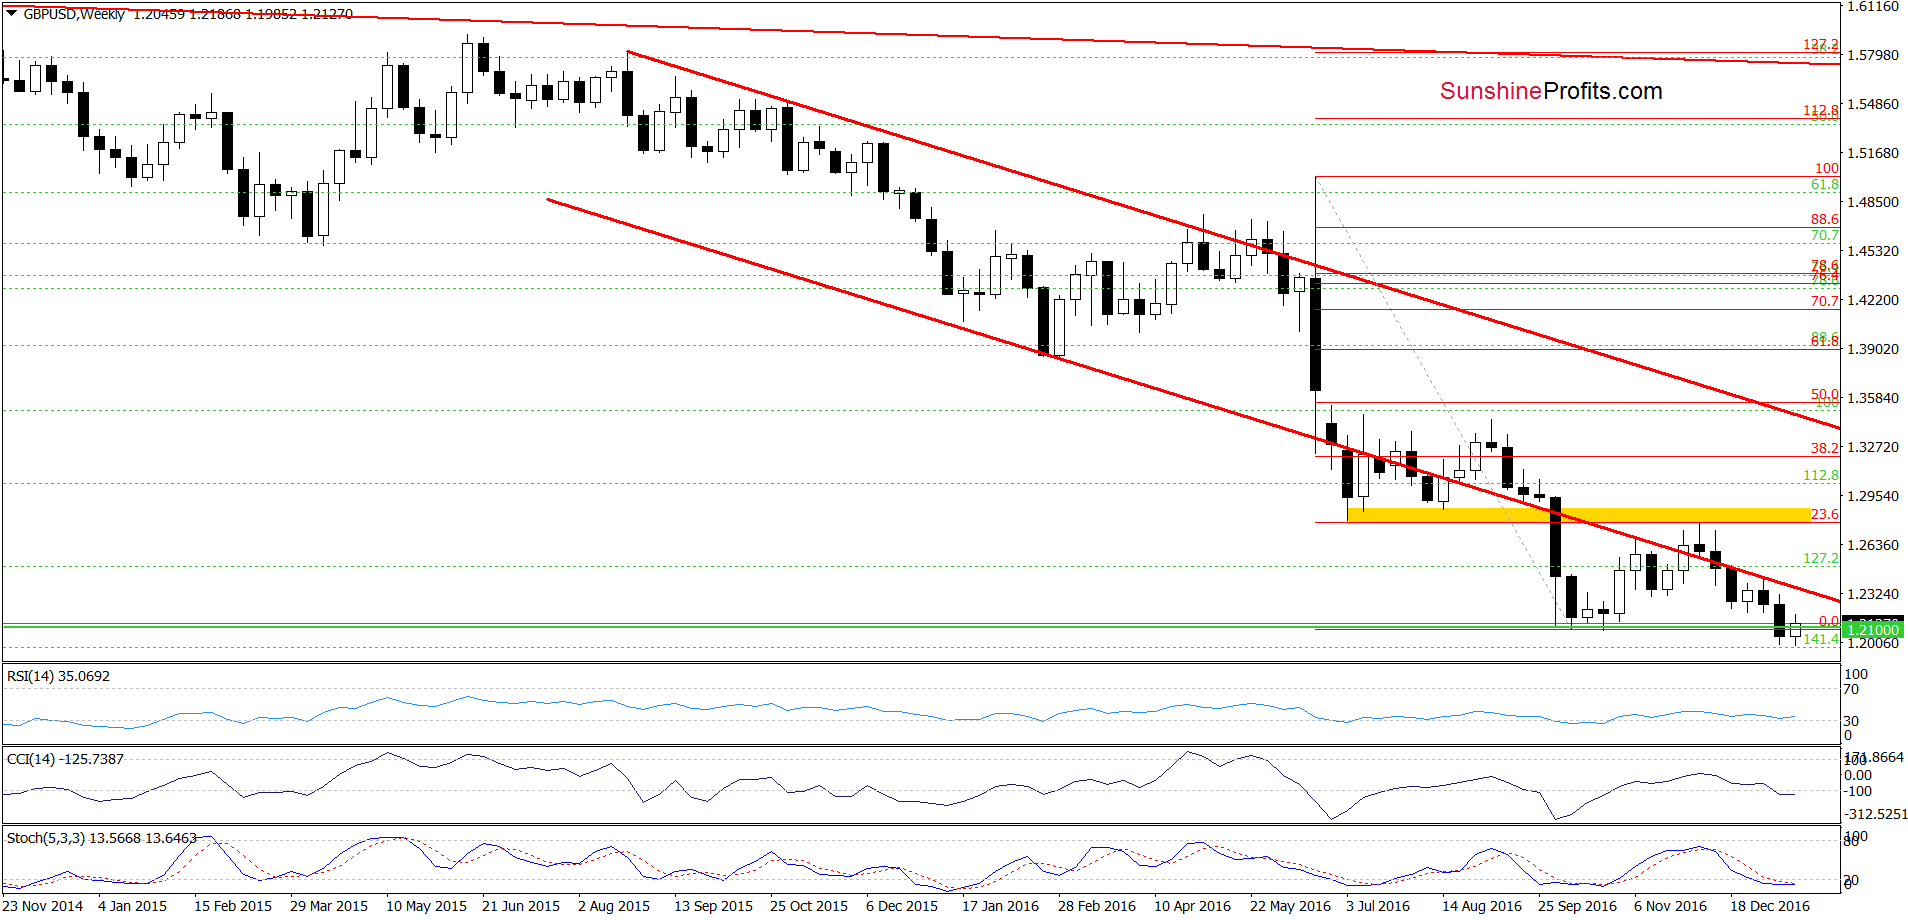
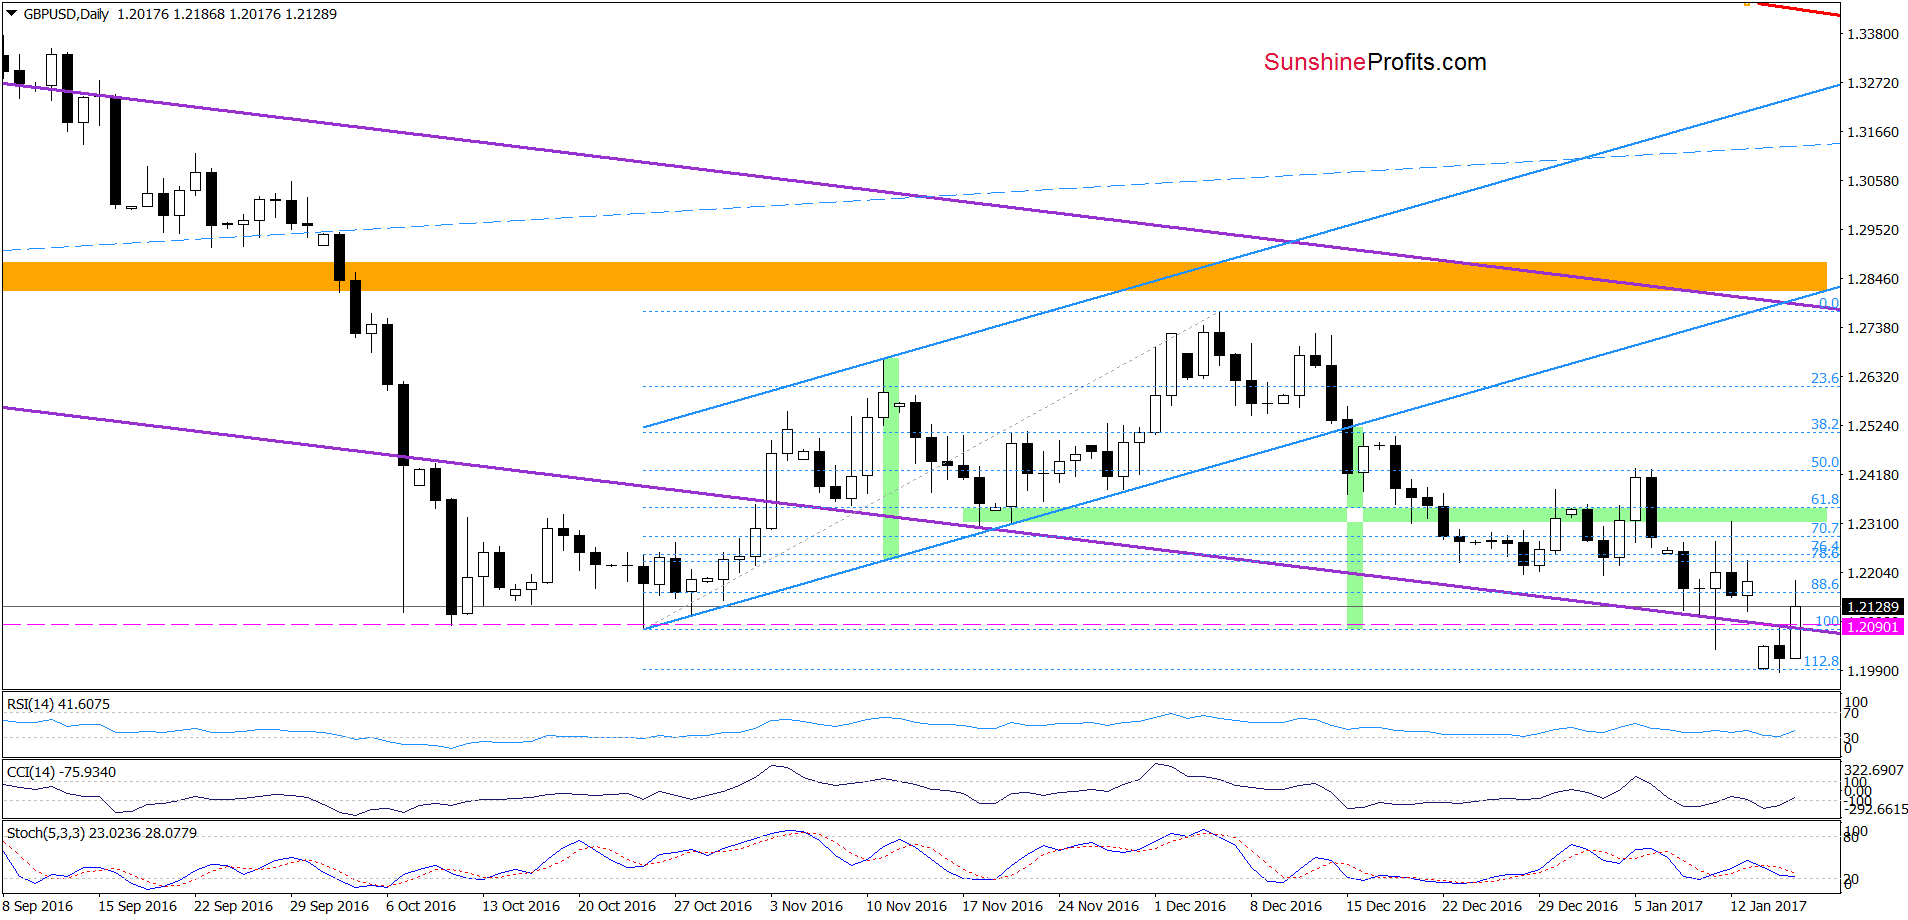
(…) the exchange rate extended gains, but the green zone (the nearest resistance) stopped further improvement. This suggests that as long as there is no breakout above this area another attempt to move lower and a re-test of recent lows can’t be ruled out.
From today’s point of view, we see that the green resistance zone encouraged currency bears to act as we had expected. As a result, GBP/USD broke below the October lows and hit a fresh multi-month low. With this drop, the pair slipped to the 1.128 Fibonacci extension based on the October-December upward move and the 1.414 extension based on the entire 2009-2014 move up. This area triggered a rebound earlier today, which resulted in an invalidation of the earlier breakdown under the previous lows and the lower border of the purple trend channel marked on the daily chart. Taking all the above and the buy signals generated by the indicators into account, it seems that GBP/USD will extend gains in the coming days. If this is the case, the initial upside target will be the green resistance zone and the January highs. If this area doesn’t stop currency bulls, we’ll likely see an upward move to the previously-broken lower border of the blue rising trend channel seen on the daily chart.
Very short-term outlook: mixed with bullish bias
Short-term outlook: mixed
MT outlook: mixed
LT outlook: mixed
Trading position (short-term; our opinion): No positions are justified from the risk/reward perspective. We will keep you informed should anything change, or should we see a confirmation/invalidation of the above.
USD/JPY
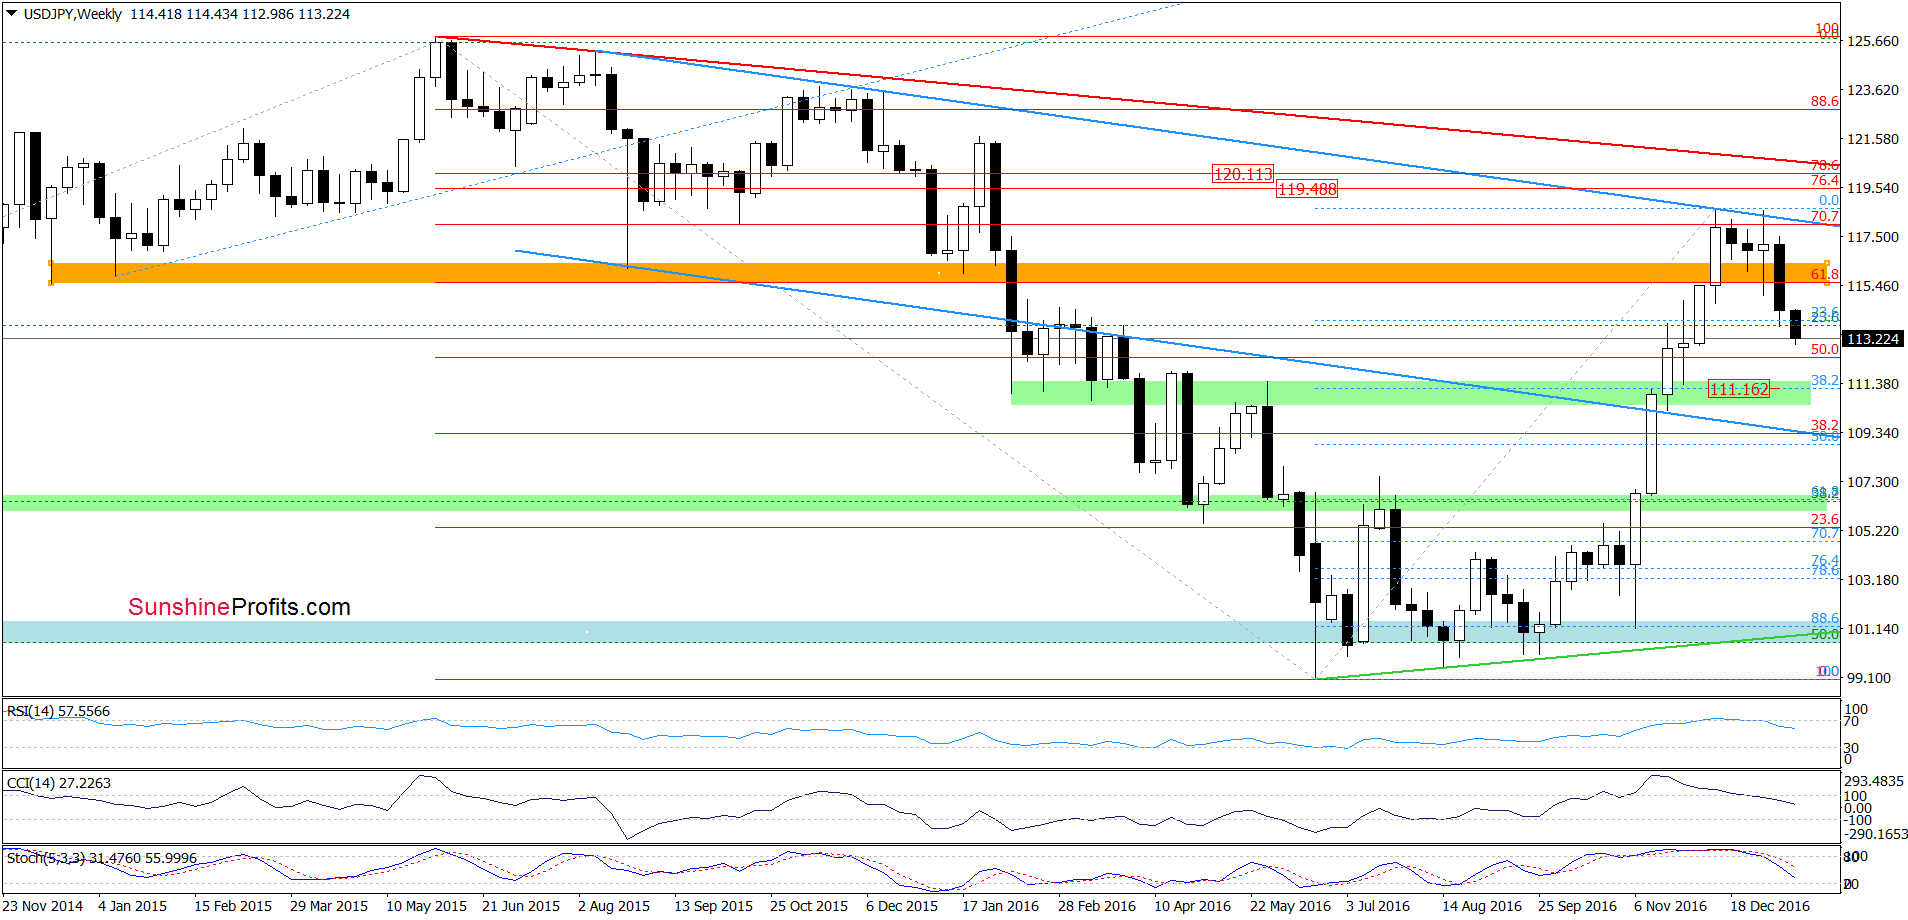
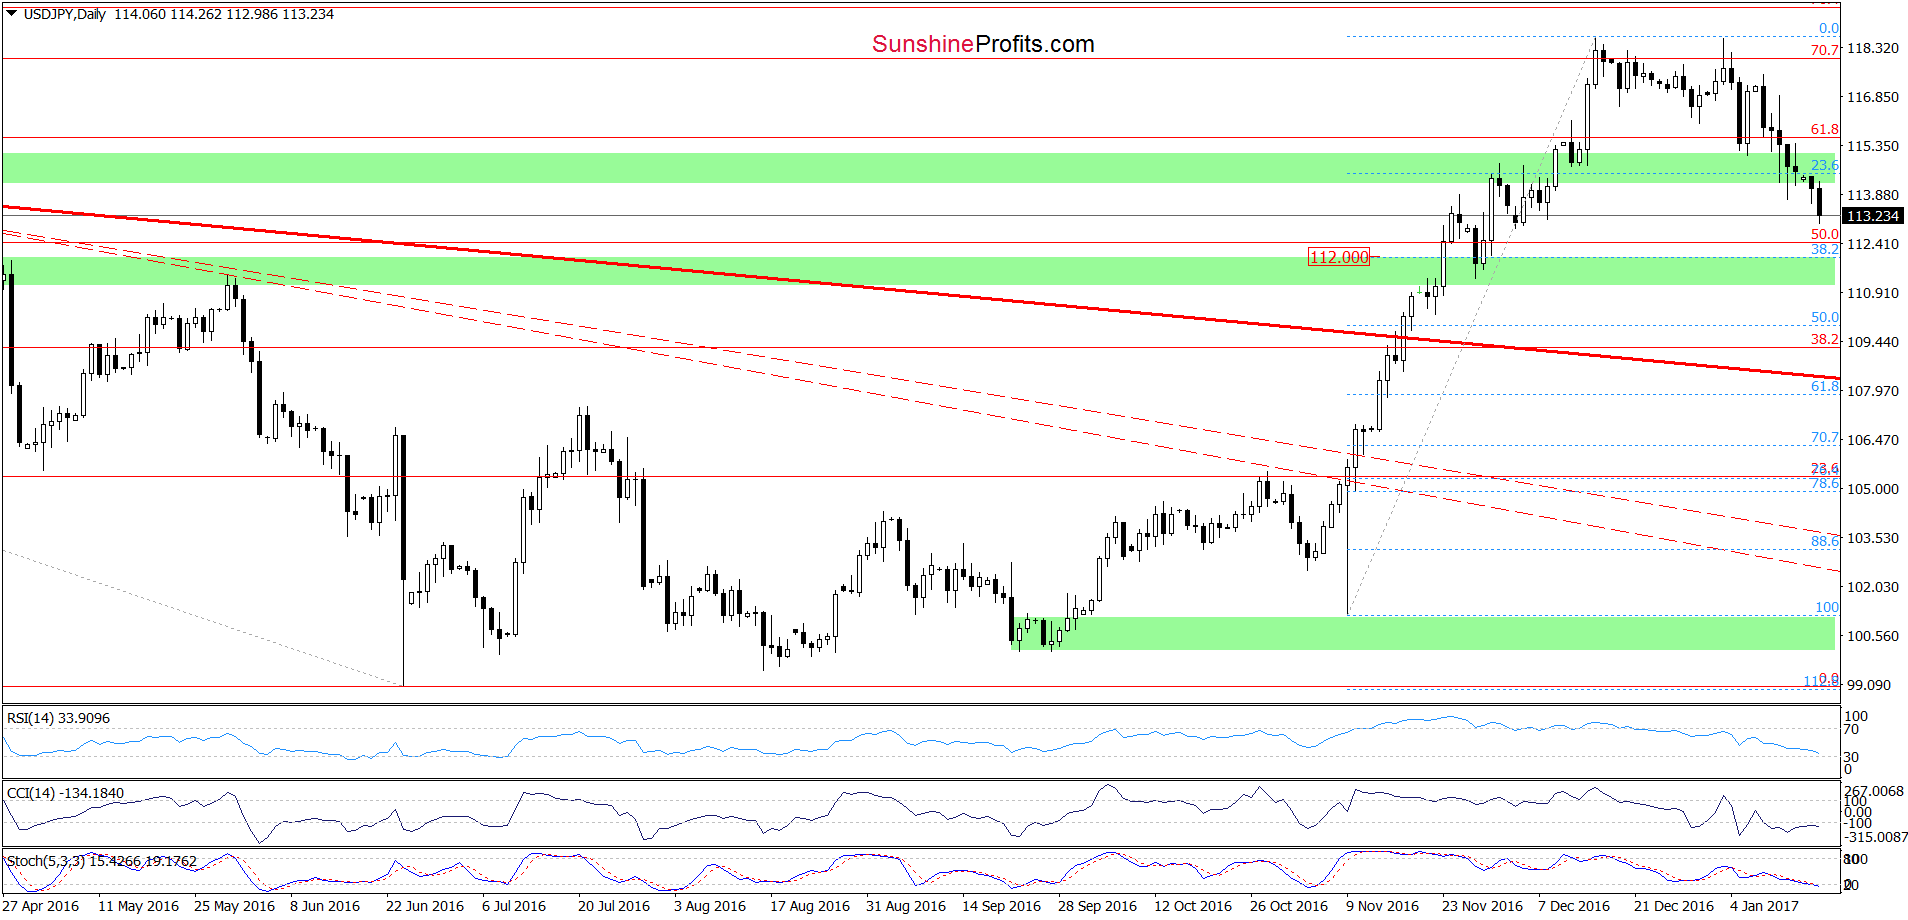
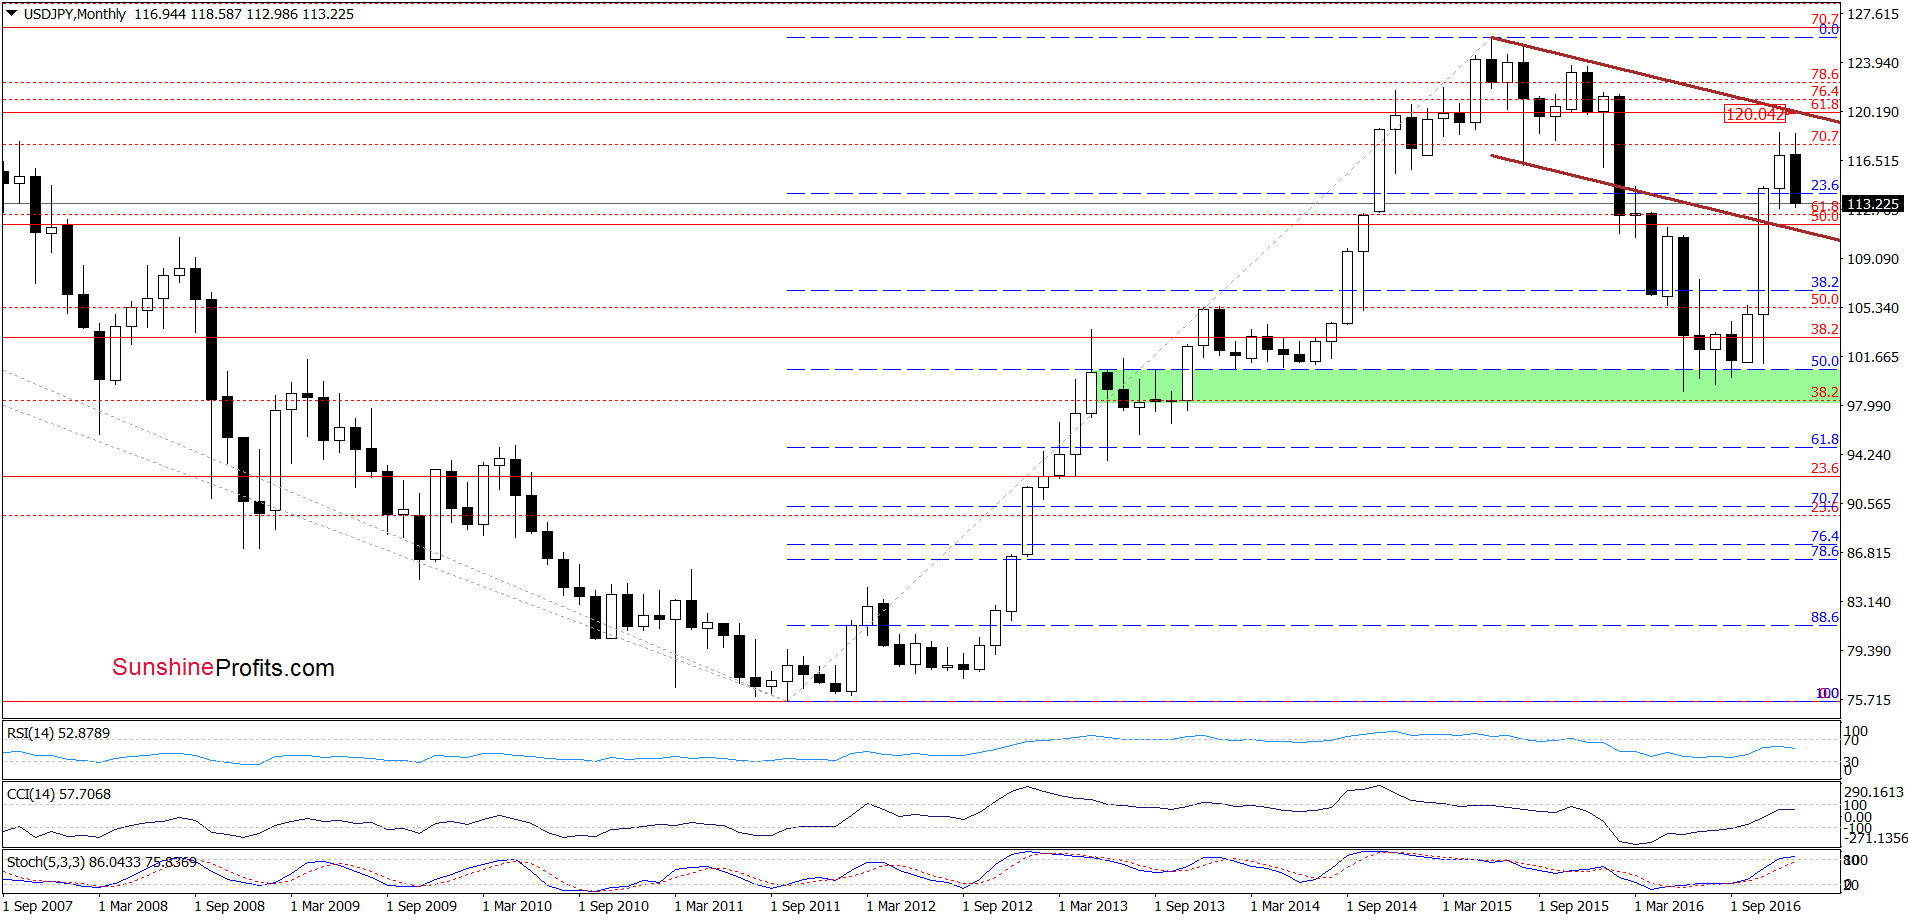
On the above charts, we see that USD/JPY extended losses and broke below the green support zone (seen on the daily chart) and the 23.6% Fibonacci retracement based on the entire June-December upward move, which suggests further deterioration. How low could the exchange rate go? In our opinion, the initial downside target will be around 112, where the 38.2% Fibonacci retracement based on the November-December declines is. If it is broken, the next target will be around 111.17, where the 38.2% Fibonacci retracement based on the June-December upward move and the previously-broken lower border of the brown declining trend channel (marked on the long-term chart below) currently are.
Very short-term outlook: bearish
Short-term outlook: mixed
MT outlook: mixed
LT outlook: mixed
Trading position (short-term; our opinion): No positions are justified from the risk/reward perspective. We will keep you informed should anything change, or should we see a confirmation/invalidation of the above.
USD/CAD
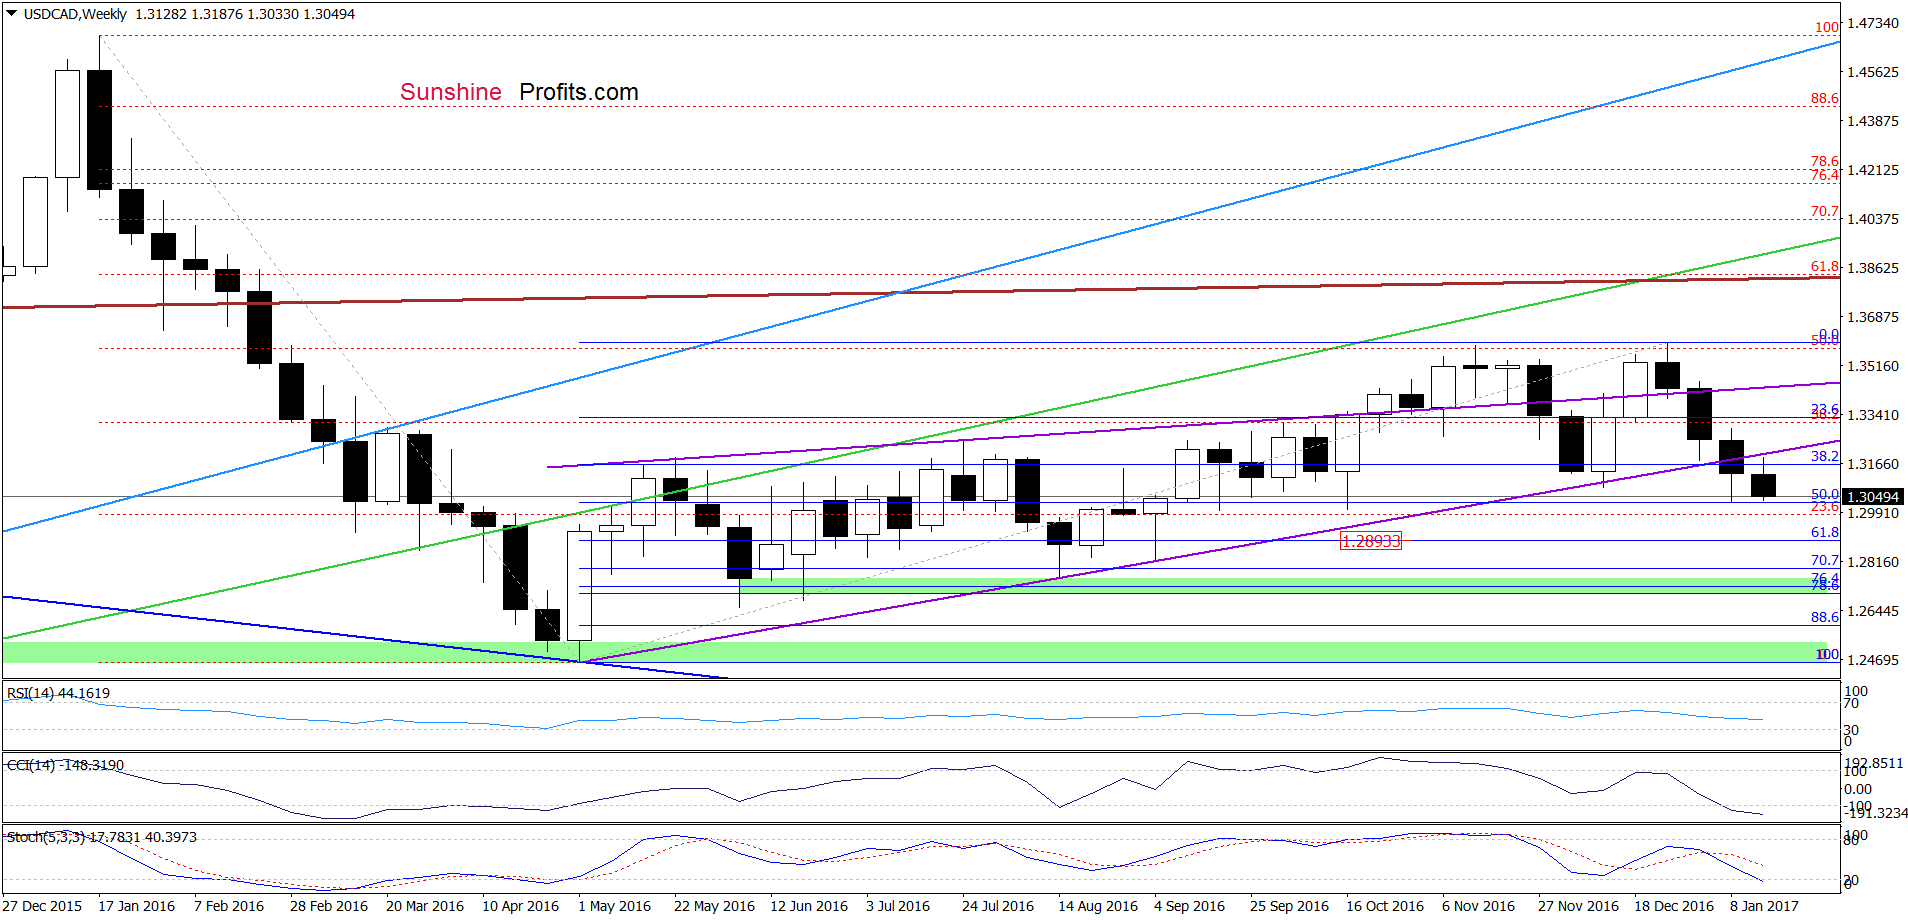
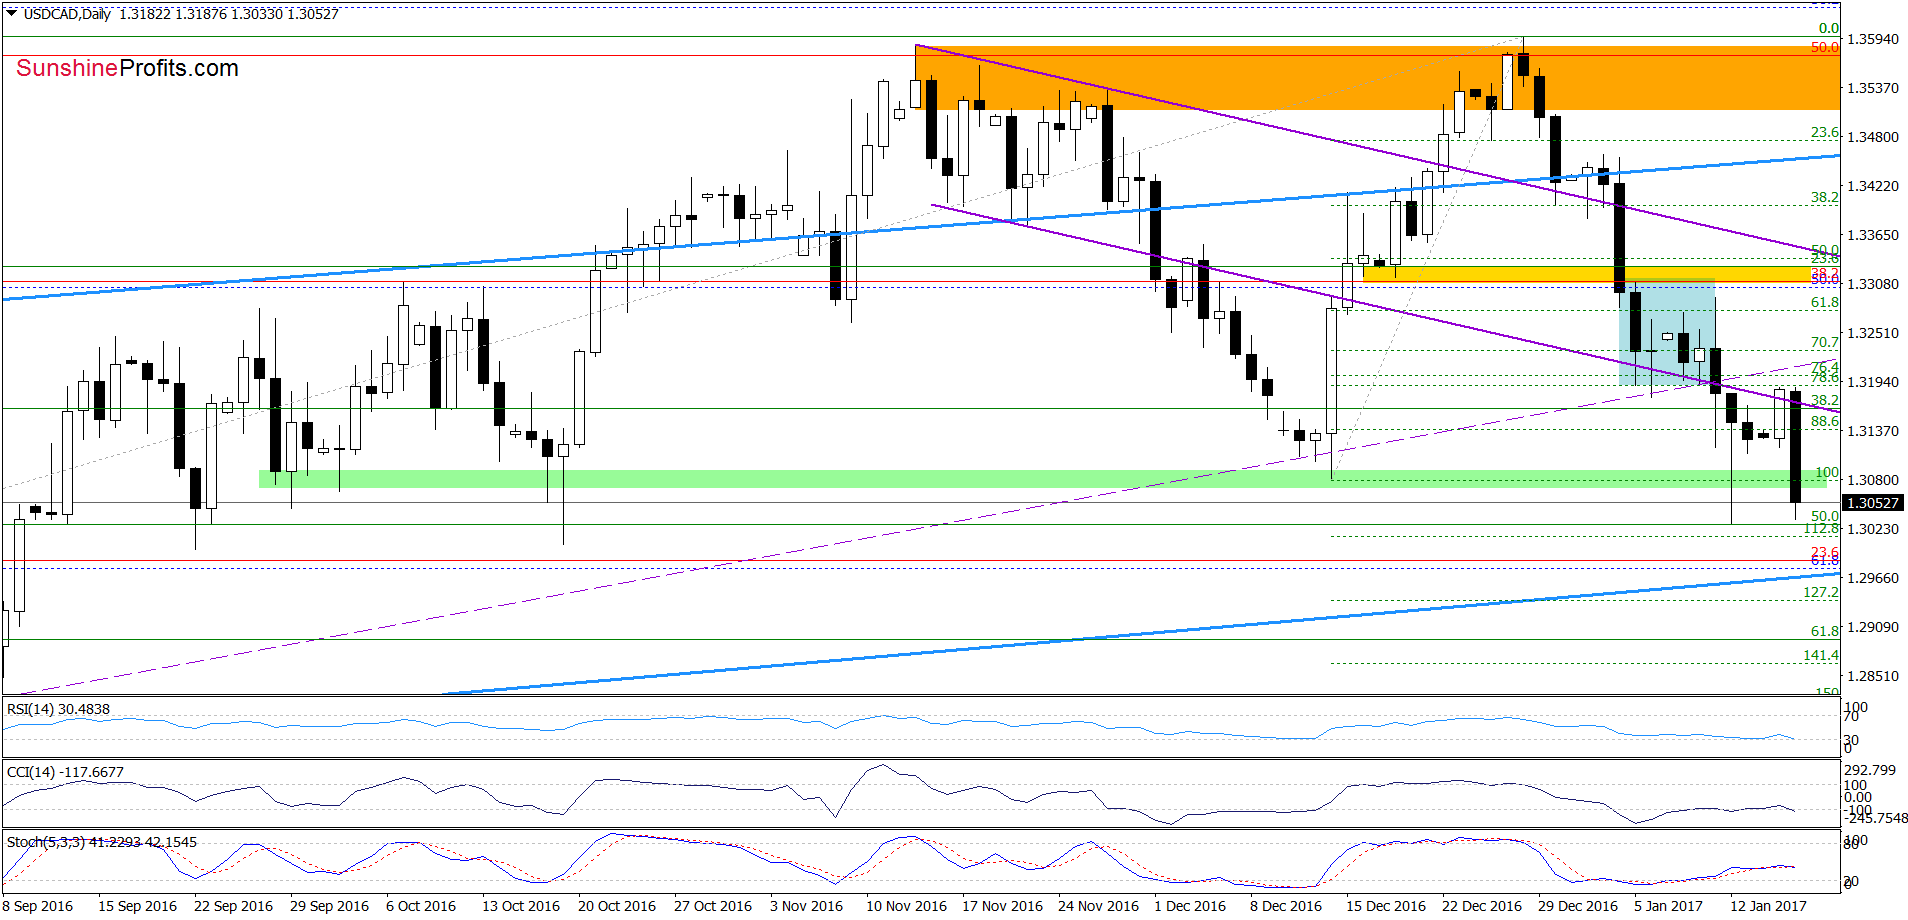
On the above charts, we see that although USD/CAD rebounded and increased to the previously-broken lower border of the purple declining trend channel, this move was nothing more than a verification of the earlier breakdown. As a result, USD/CAD declined sharply and slipped under the green support zone seen on the daily chart. This is a negative signal, which suggests a test of the lower border of the blue rising trend channel (currently around 1.2964) in the coming days.
Very short-term outlook: bearish
Short-term outlook: mixed
MT outlook: mixed
LT outlook: mixed
Trading position (short-term; our opinion): No positions are justified from the risk/reward perspective. We will keep you informed should anything change, or should we see a confirmation/invalidation of the above.
USD/CHF
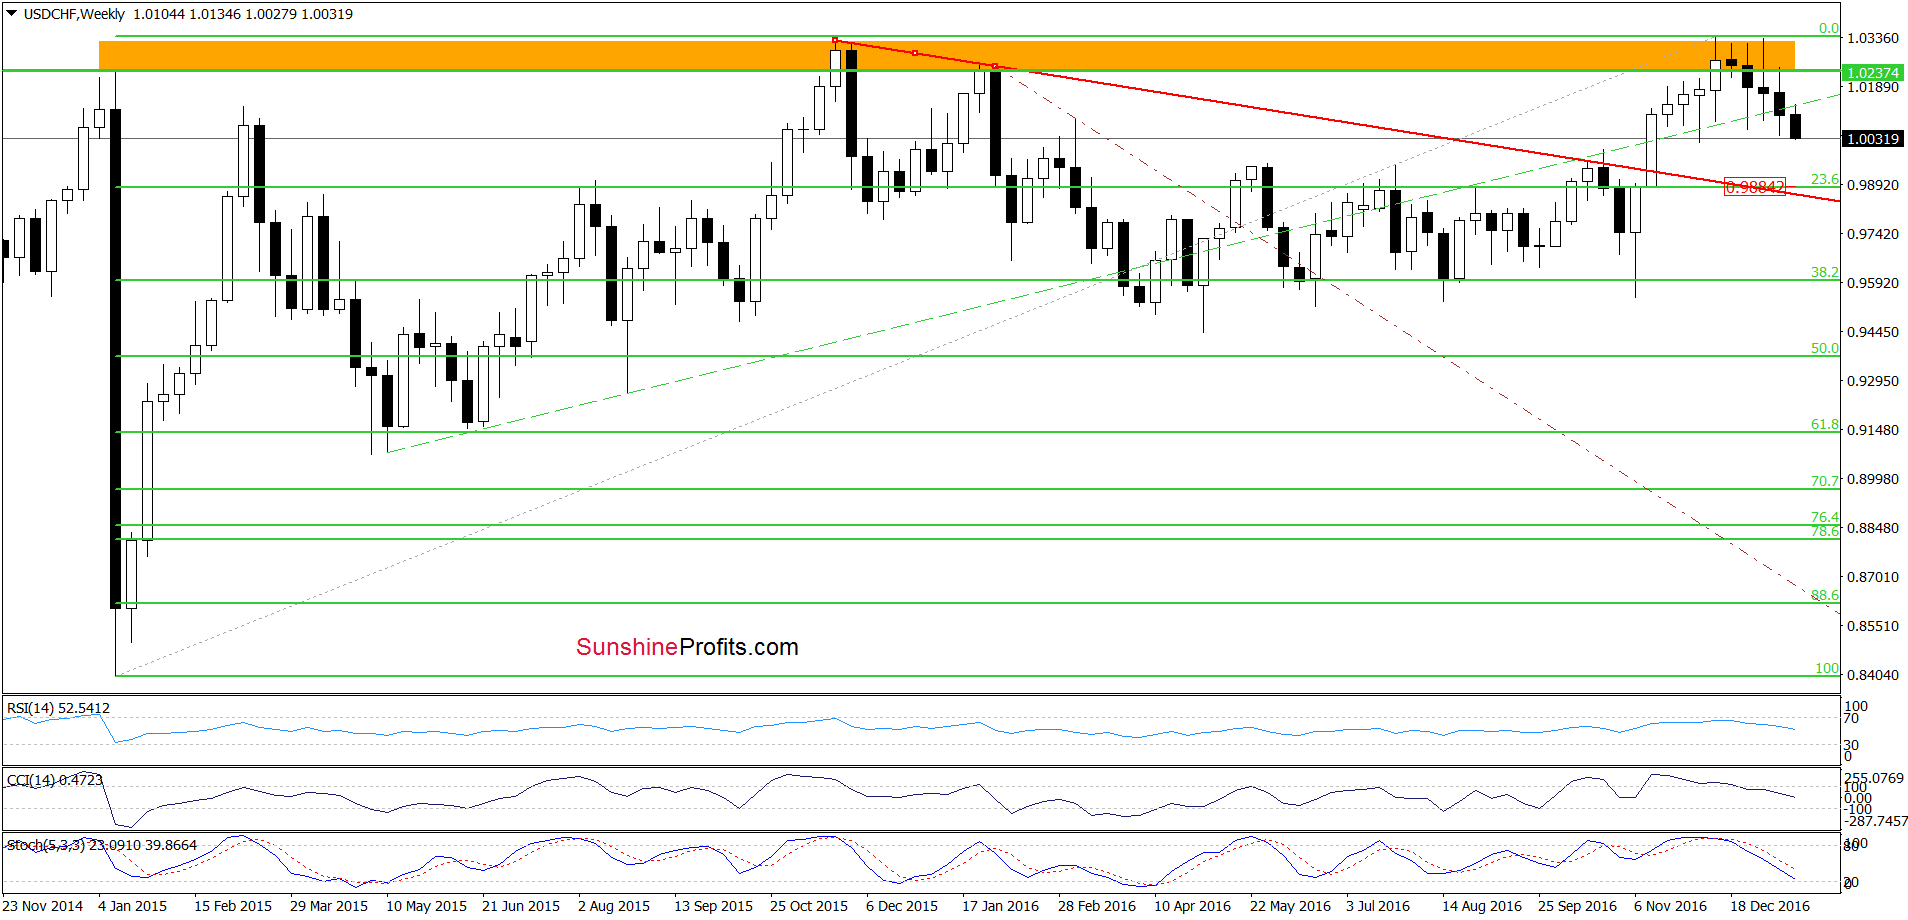
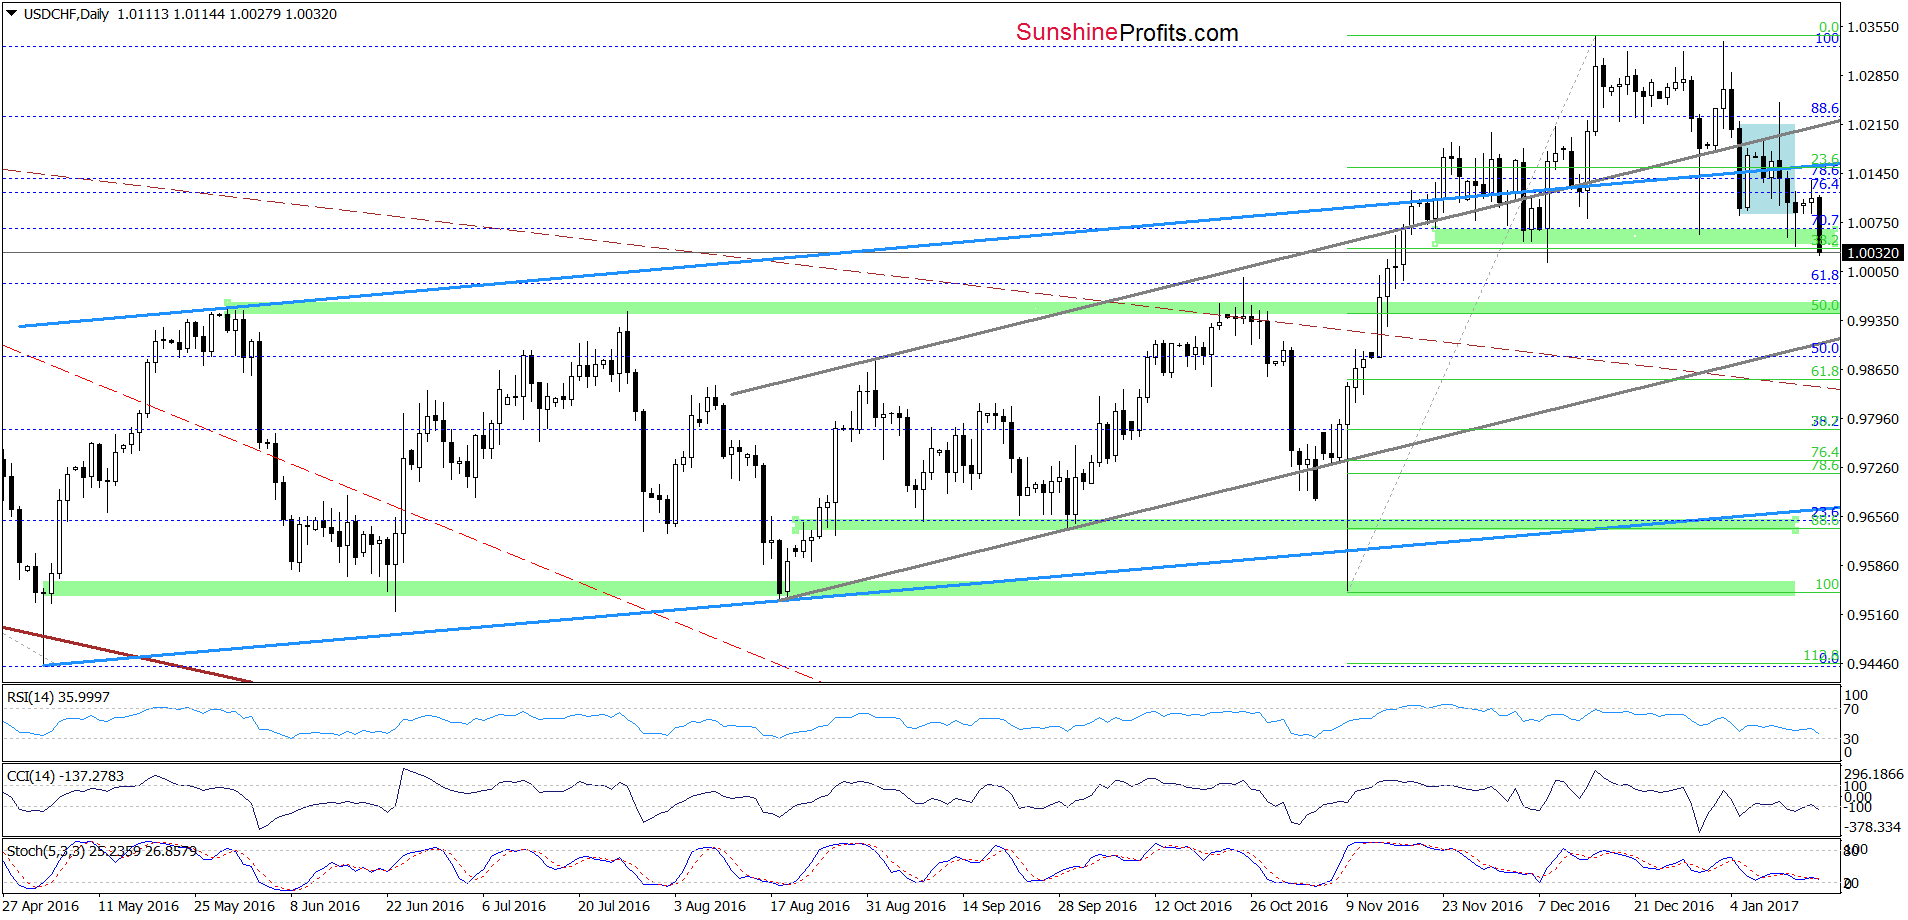
From today’s point of view, we see that USD/CHF came back below the lower border of the blue consolidation, which triggered further deterioration and a drop below the December low and the 38.2% Fibonacci retracement based on the November-December upward move. This is a negative signal, which suggests lower values of USD/CHF in the coming days. This means that if the exchange rate extends losses, we’ll likely see a drop to around 0.9945, where the 50% Fibonacci retracement is. If this support is broken, the next downside target for currency bears will be the 23.6% Fibonacci retracement (based on the entire January 2015-December 2016 upward move) and the previously-broken red declining line based on the November 2015 and January 2016 peaks, which serves now as a support.
Very short-term outlook: bearish
Short-term outlook: mixed
MT outlook: mixed
LT outlook: mixed
Trading position (short-term; our opinion): No positions are justified from the risk/reward perspective. We will keep you informed should anything change, or should we see a confirmation/invalidation of the above.
AUD/USD
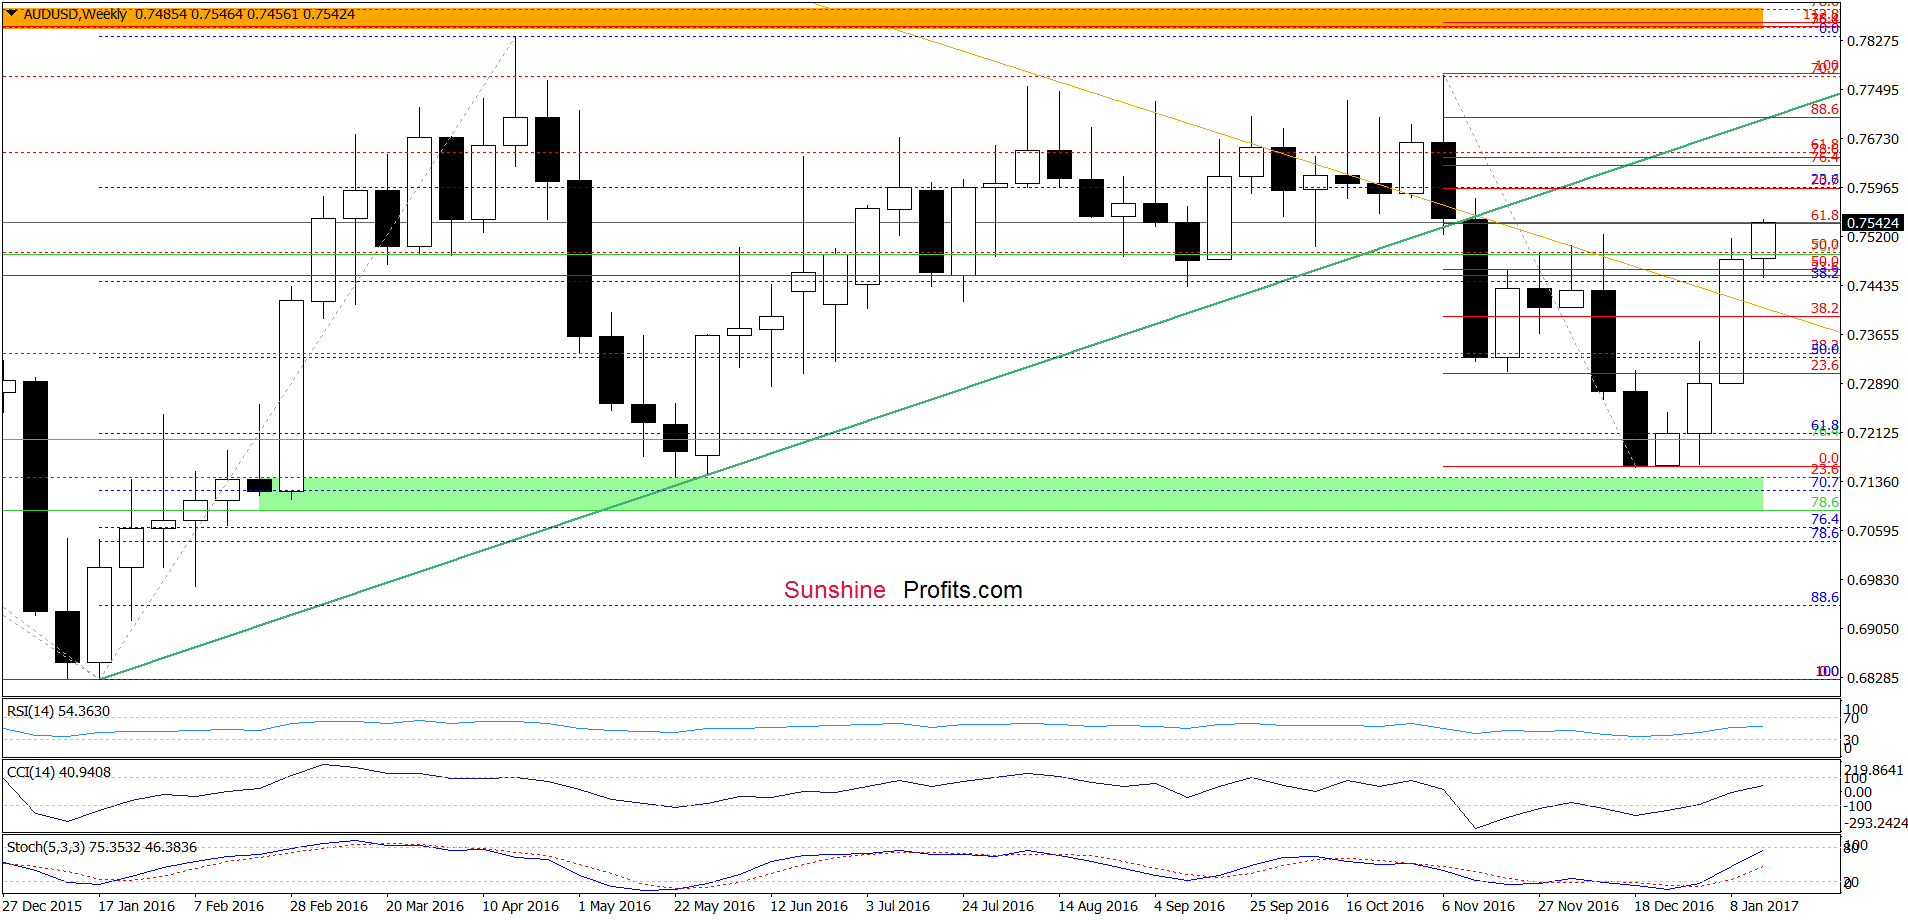
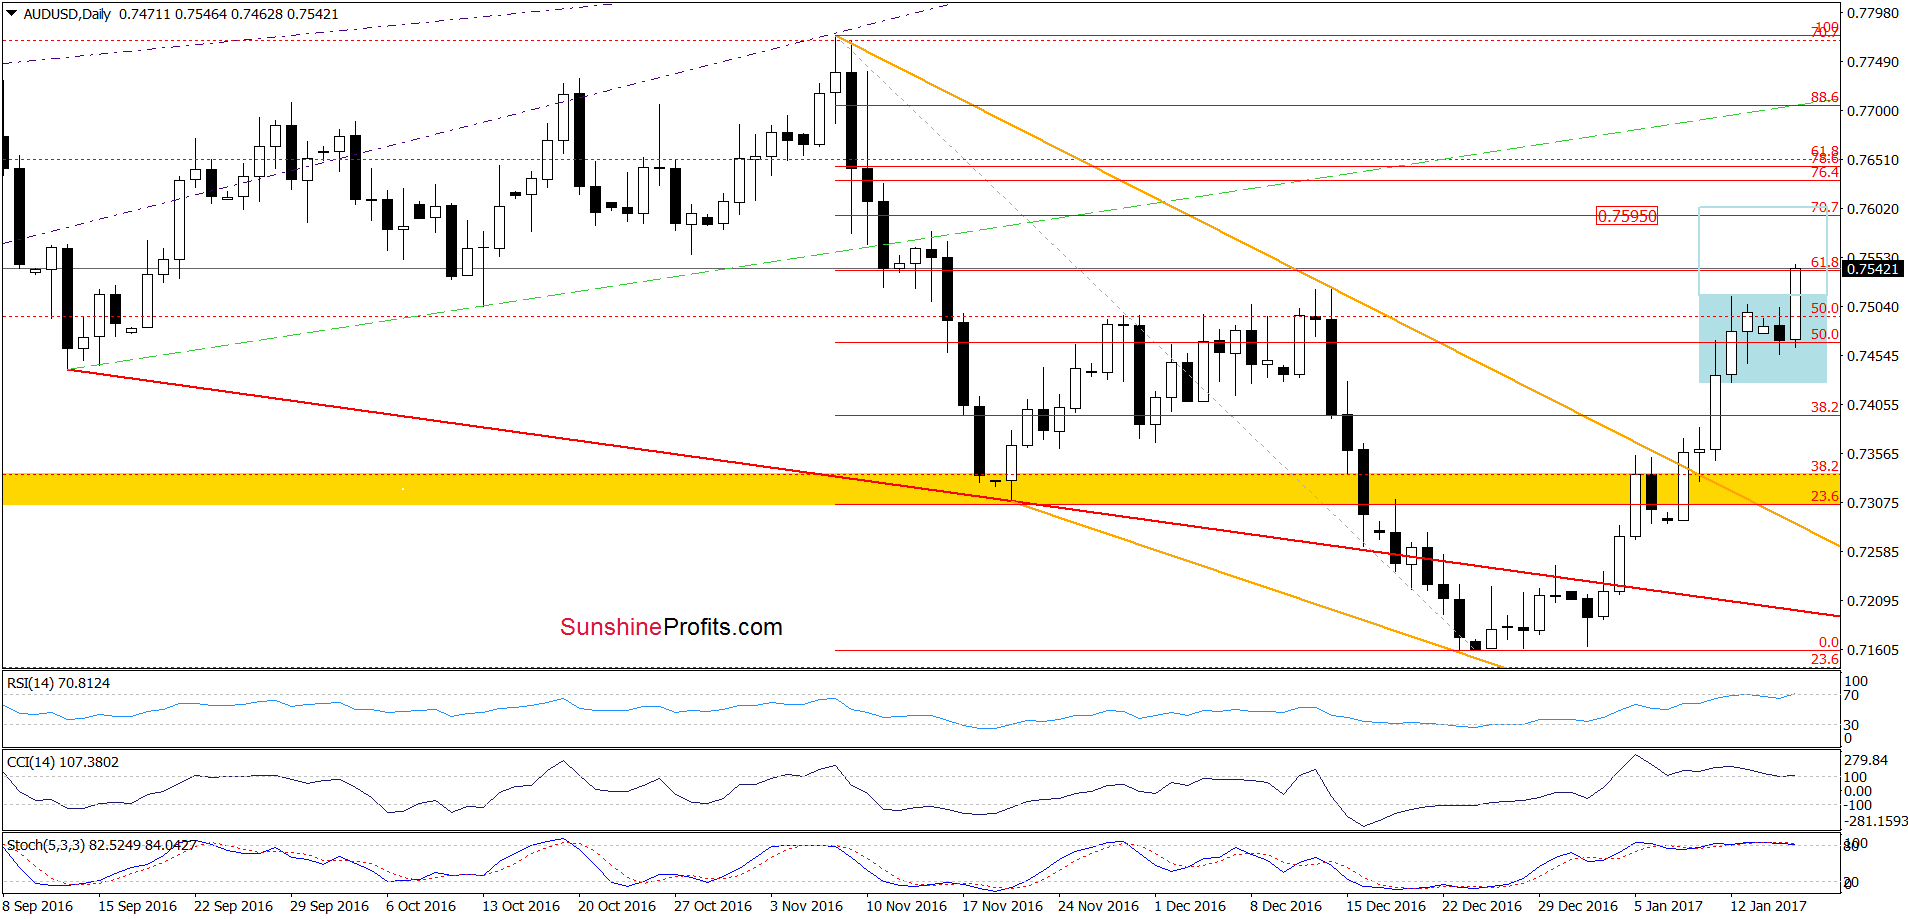
Looking at the charts, we see that AUD/USD extended gains and broke above the upper border of the blue consolidation earlier today. With this increase, the pair also climbed above the mid-December highs, which suggests further improvement and an increase to around 0.7595, where the size of the upward move will correspond to the height of the consolidation. Nevertheless, with today’s move the pair reached the 61.8% Fibonacci retracement, which suggests that further improvement will be likely only if AUD/USD closes today’s session (or one of the following) above this resistance.
Very short-term outlook: mixed with bullish bias
Short-term outlook: mixed
MT outlook: mixed
LT outlook: mixed
Trading position (short-term; our opinion): No positions are justified from the risk/reward perspective. We will keep you informed should anything change, or should we see a confirmation/invalidation of the above.
Thank you.
Nadia Simmons
Forex & Oil Trading Strategist
Przemyslaw Radomski, CFA
Founder, Editor-in-chief
Gold & Silver Trading Alerts
Forex Trading Alerts
Oil Investment Updates
Oil Trading Alerts

