

Earlier today, the U.S. dollar rebounded sharply against a basket of six major currencies and re-approached the December highs. How did this appreciation affect the technical picture for the euro, British pound and yen?
In our opinion the following forex trading positions are justified - summary:
EUR/USD
Quoting our Friday’s alert:
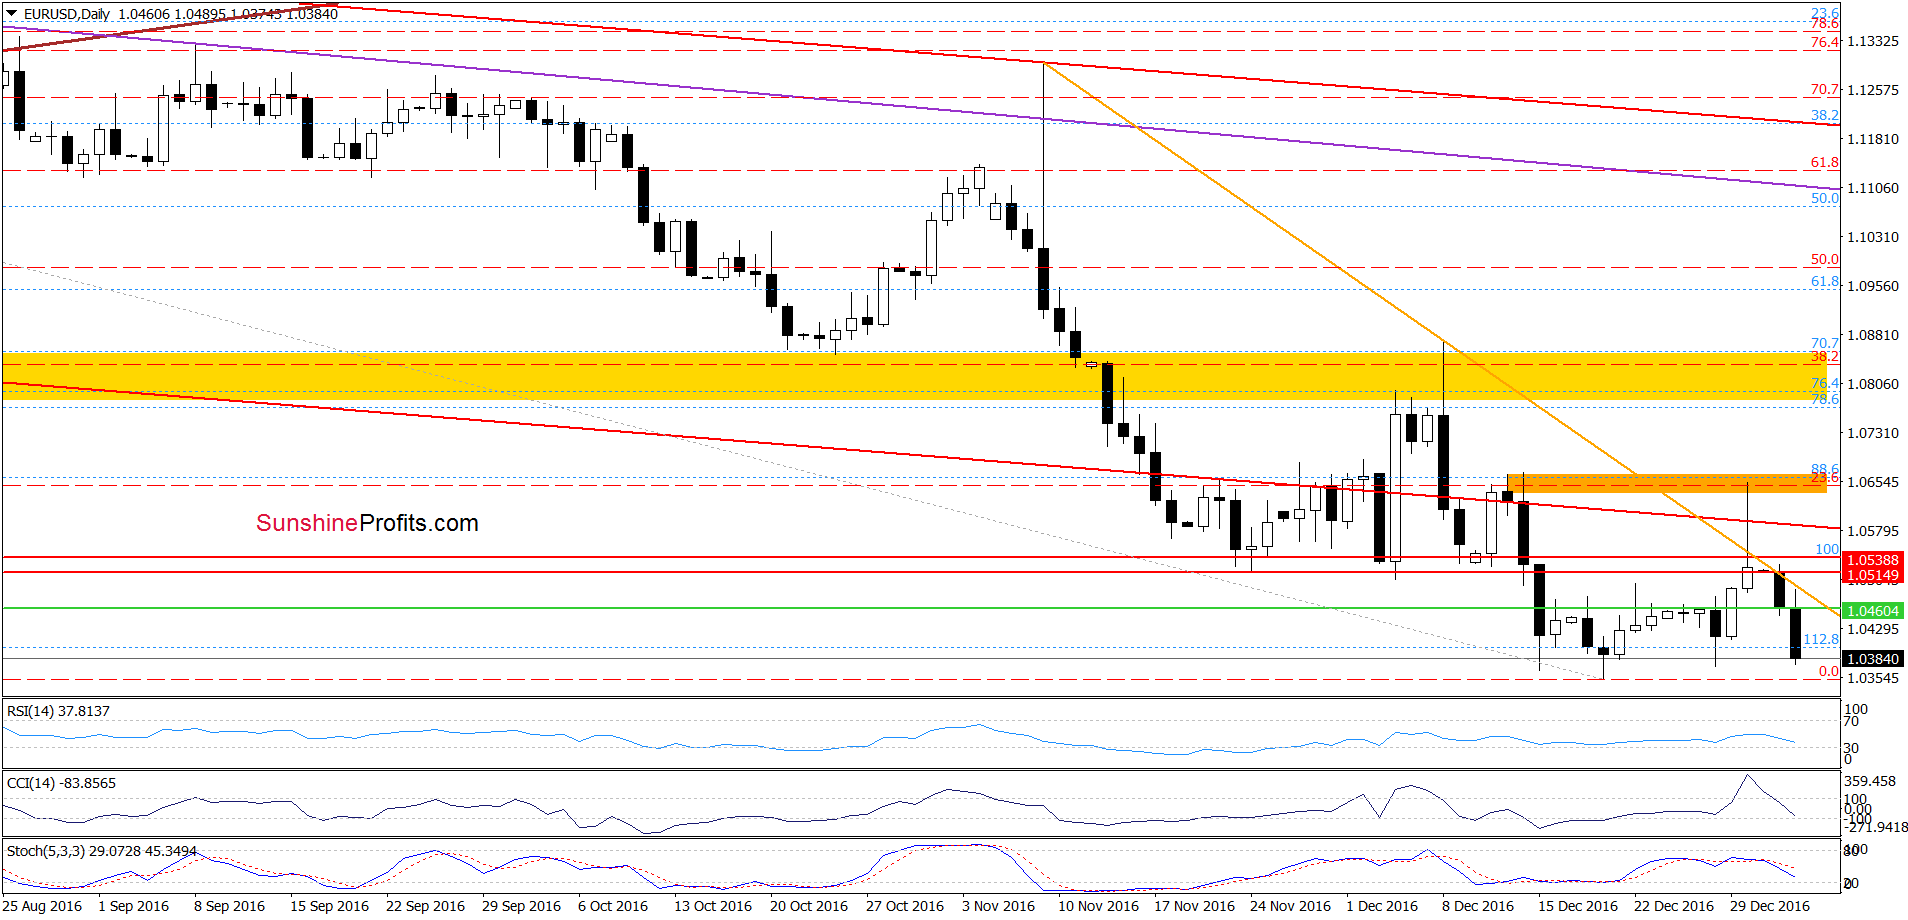
(…) the exchange rate climbed above the orange declining resistance based on the previous highs and the lower border of the red declining trend channel, reaching the orange resistance zone created by the mid-Dec highs and the 23.6% Fibonacci retracement. (…) in the following hours (…)the pair slipped under the lower border of the red declining trend channel, which looks like a verification of earlier breakdown (…) such price action doesn’t bode well for currency bulls (…), suggesting another attempt to move lower.
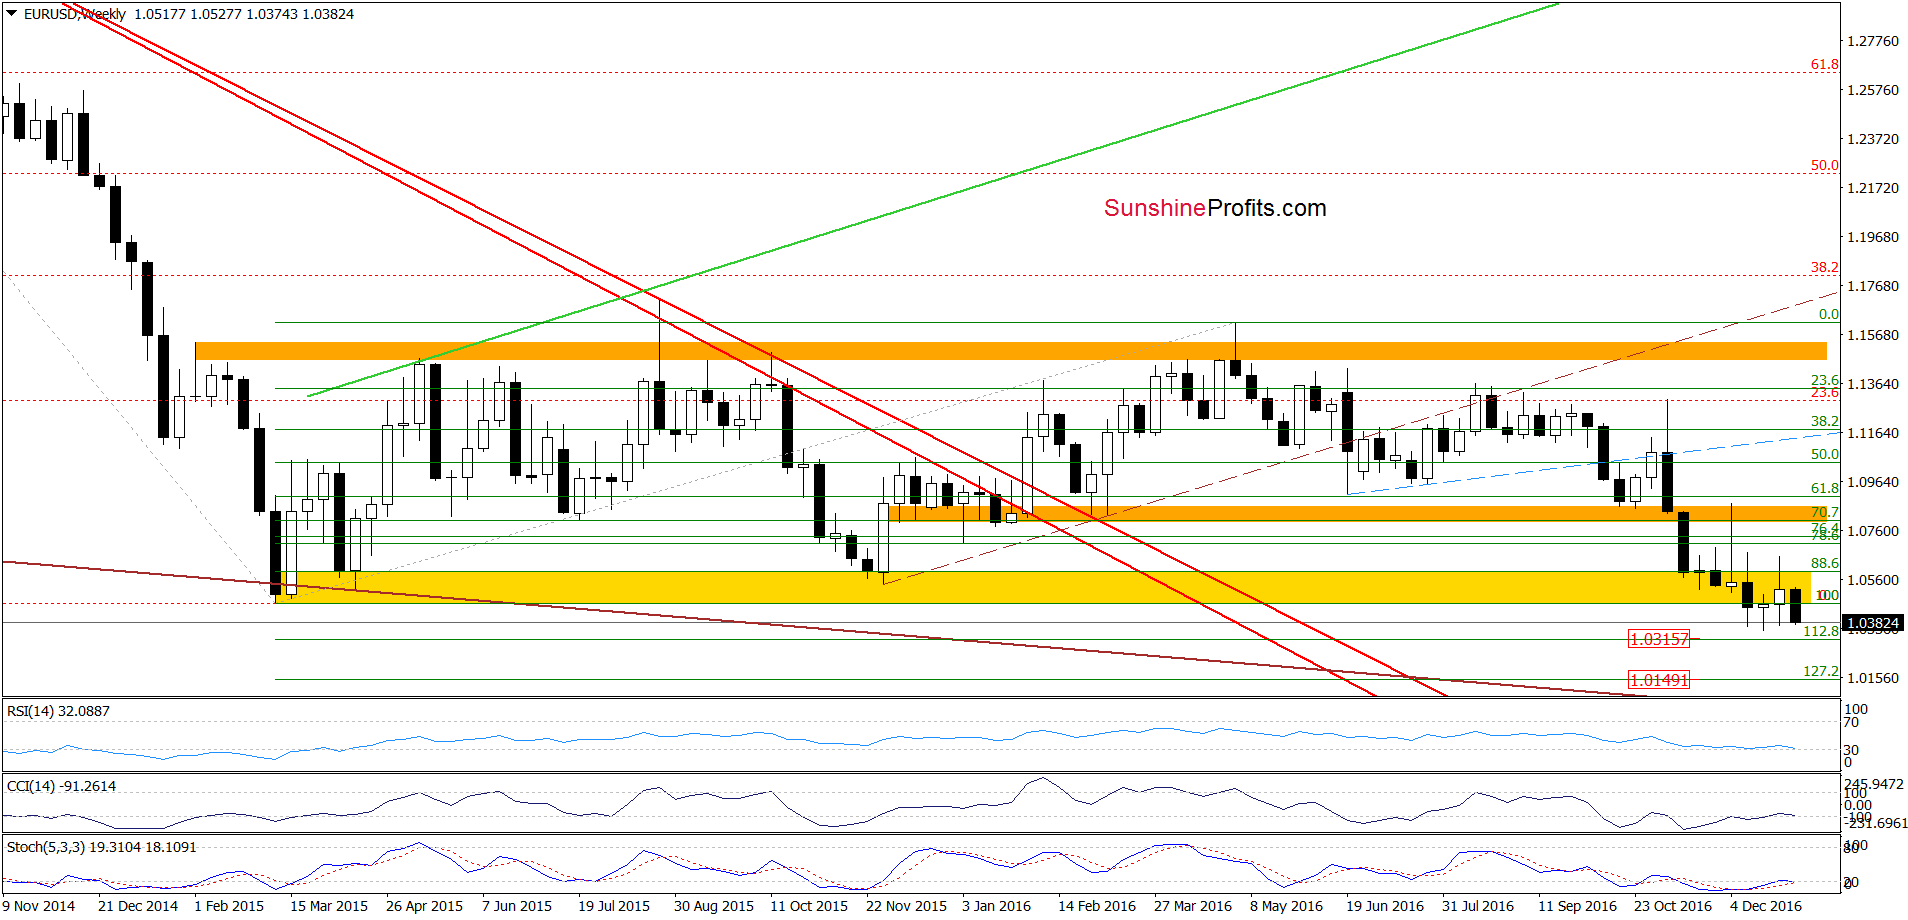
From today’s point of view, we see that the situation developed in line with the above scenario and currency bears pushed EUR/USD under the orange declining resistance line. As a result, the pair invalidated the earlier breakout, which triggered further deterioration this week. Additionally, the CCI and Stochastic Oscillator generated sell signals, supporting lower values of the exchange rate in the coming days.
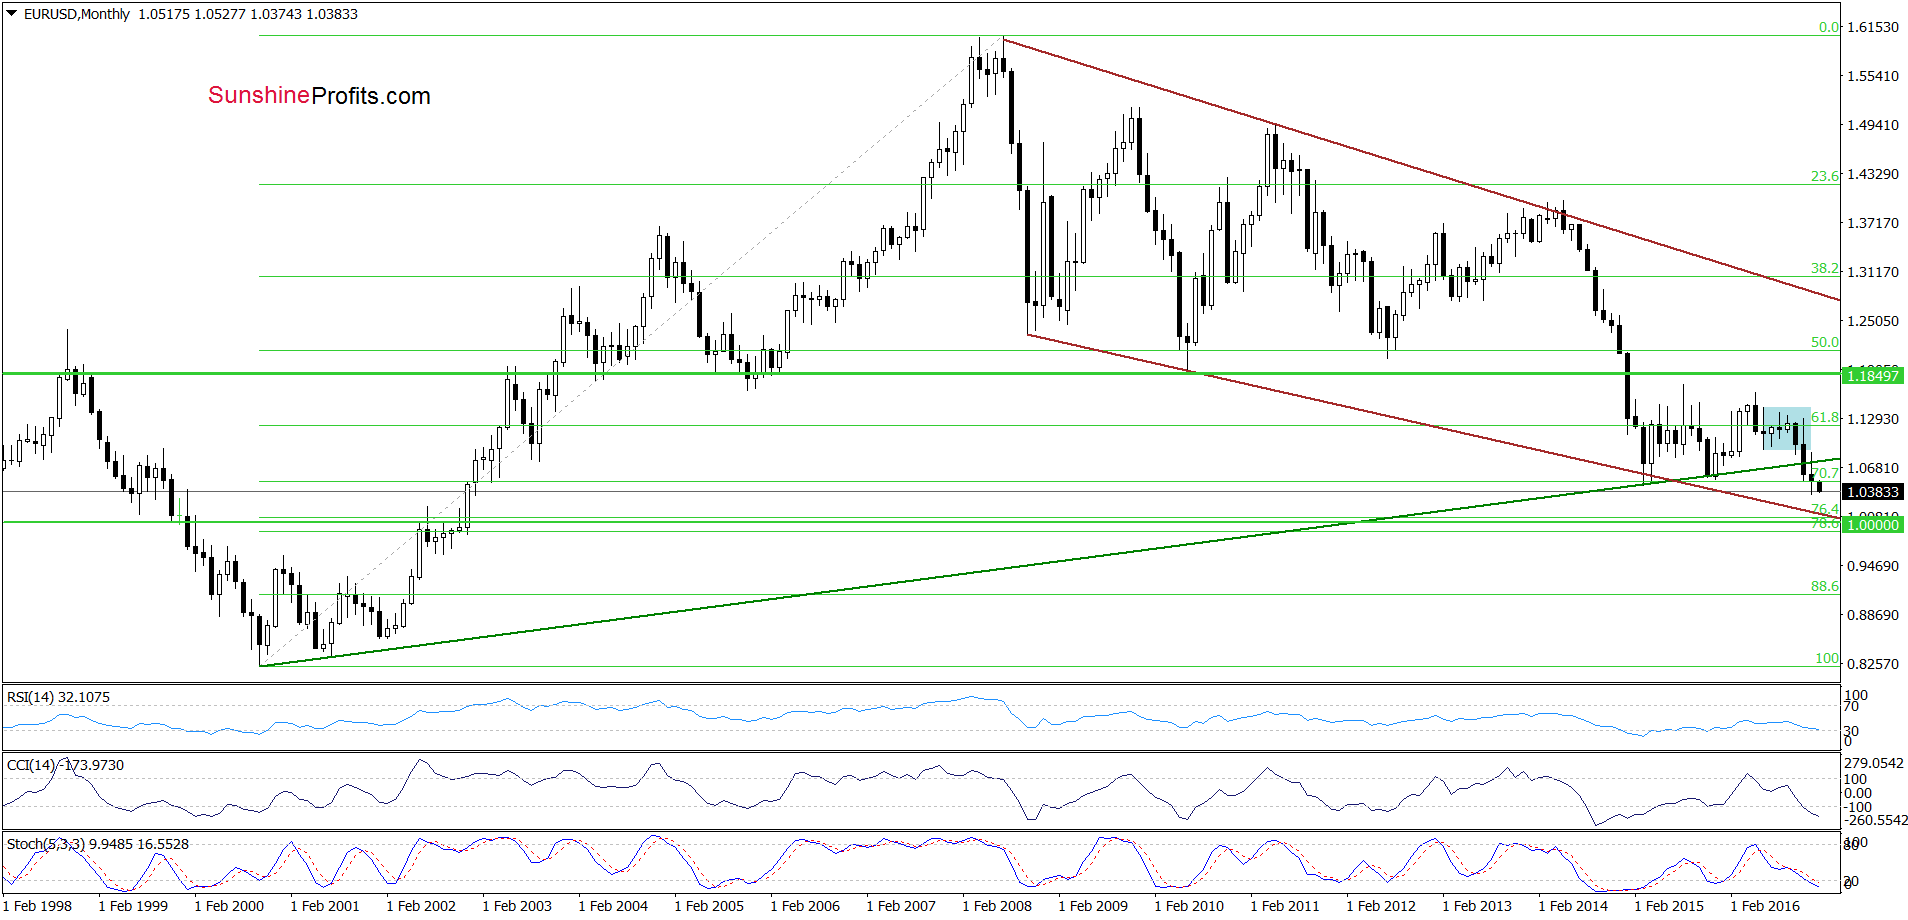
How low could EUR/USD go? If the pair drops under the December lows, we’ll likely see a decline to the 112.8%, 127.2% Fibonacci extension (both marked on the weekly chart) or even a test of the lower border of the long-term brown declining trend channel and the barrier of 1.0000 seen on the long-term chart below.
Very short-term outlook: mixed with bearish bias
Short-term outlook: mixed
MT outlook: mixed
LT outlook: mixed
Trading position (short-term; our opinion): No positions are justified from the risk/reward perspective. We will keep you informed should anything change, or should we see a confirmation/invalidation of the above.
GBP/USD
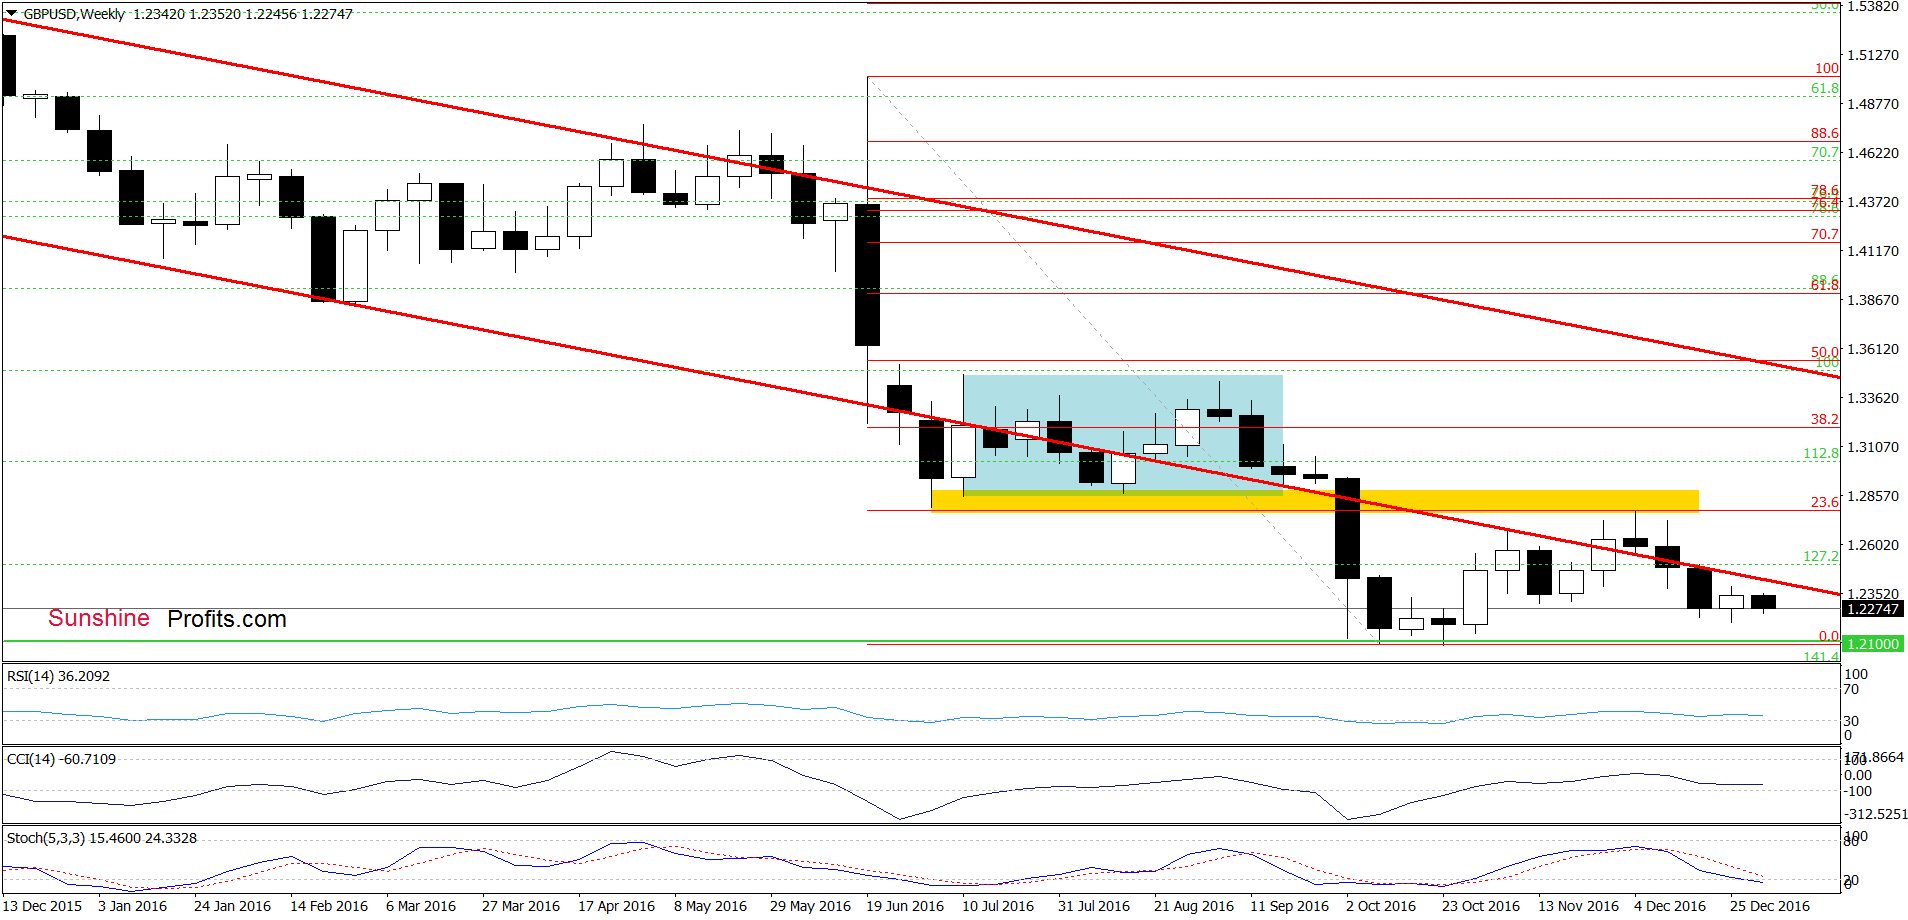
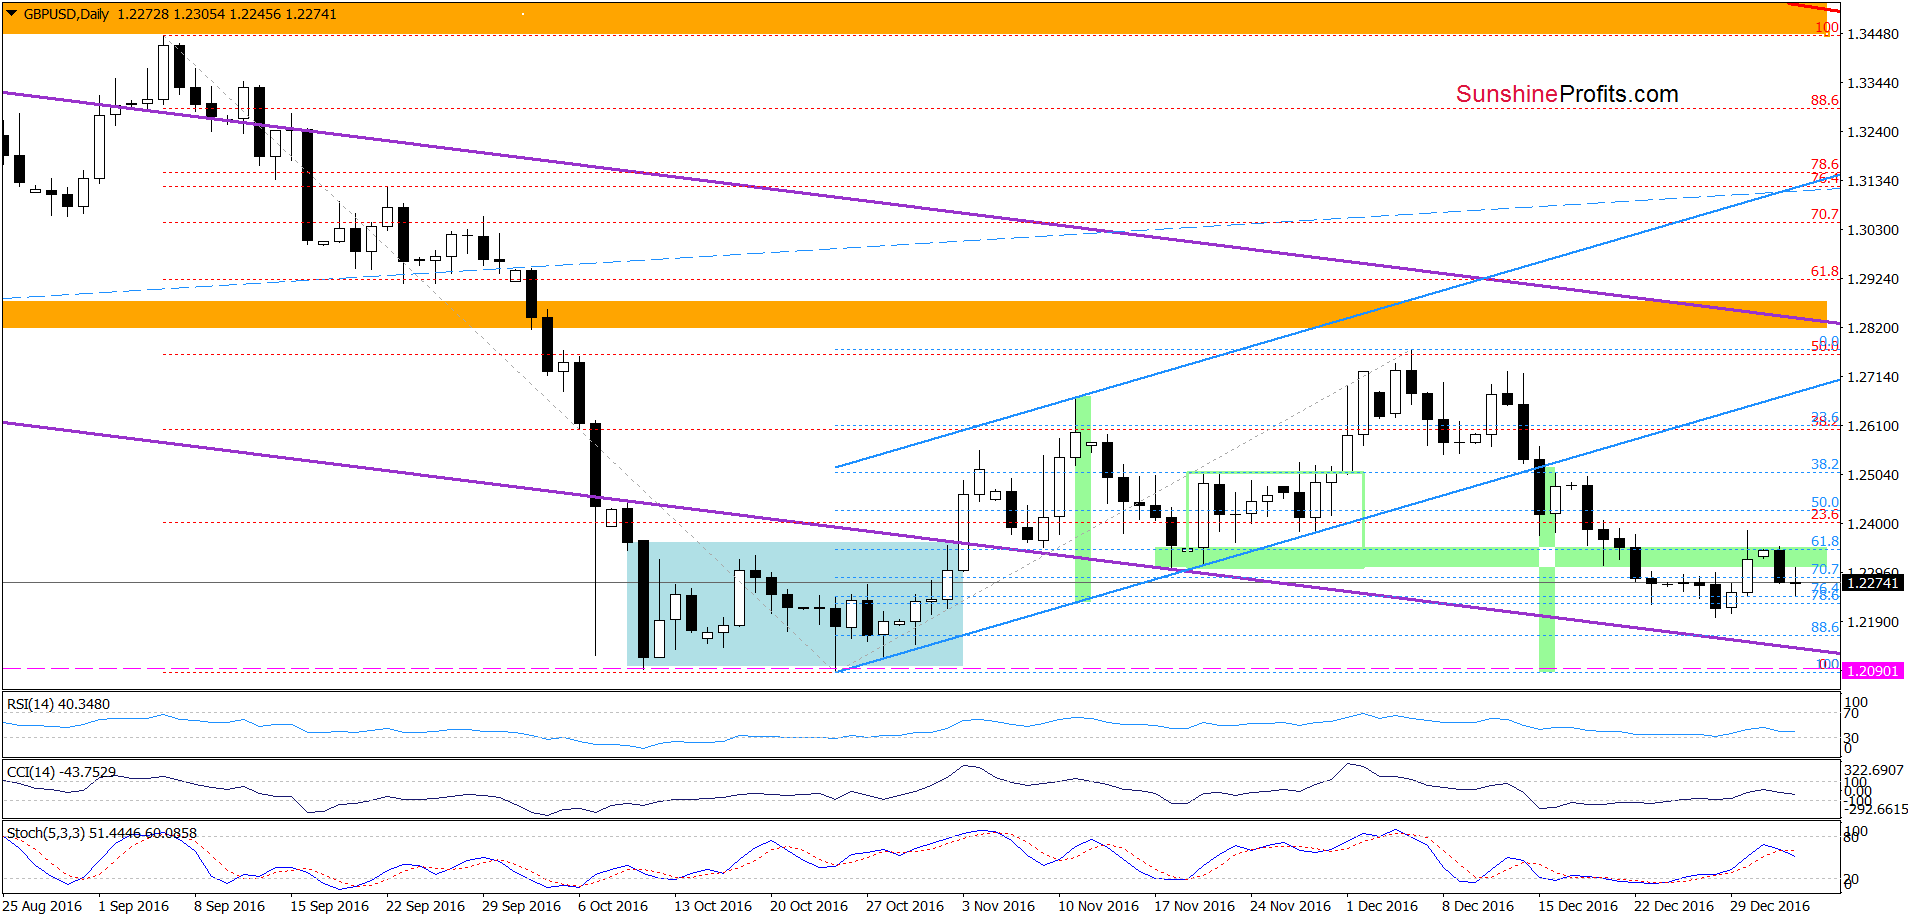
Although GBP/USD moved higher in the previous week, the exchange rate came back under the previously-broken green zone, which means that what we wrote a week ago about this currency pair is still valid:
(…) GBP/USD (…) invalidated earlier breakout above the lower border of the red declining trend channel – similarly to what we saw at the beginning of Oct. Such price action doesn’t bode well for currency bulls and suggests further deterioration. (…)
How low could the exchange rate go?
(…) the (…) decline pushed the pair below the lower border of the blue rising trend channel, which is a negative signal that suggests a drop to around 1.2090, where the size of the move would correspond to the height of the channel. In this area is also the October low and the barrier of 1.2000, which together could stop further deterioration once again.
Very short-term outlook: mixed with bearish bias
Short-term outlook: mixed
MT outlook: mixed
LT outlook: mixed
Trading position (short-term; our opinion): No positions are justified from the risk/reward perspective. We will keep you informed should anything change, or should we see a confirmation/invalidation of the above.
USD/JPY
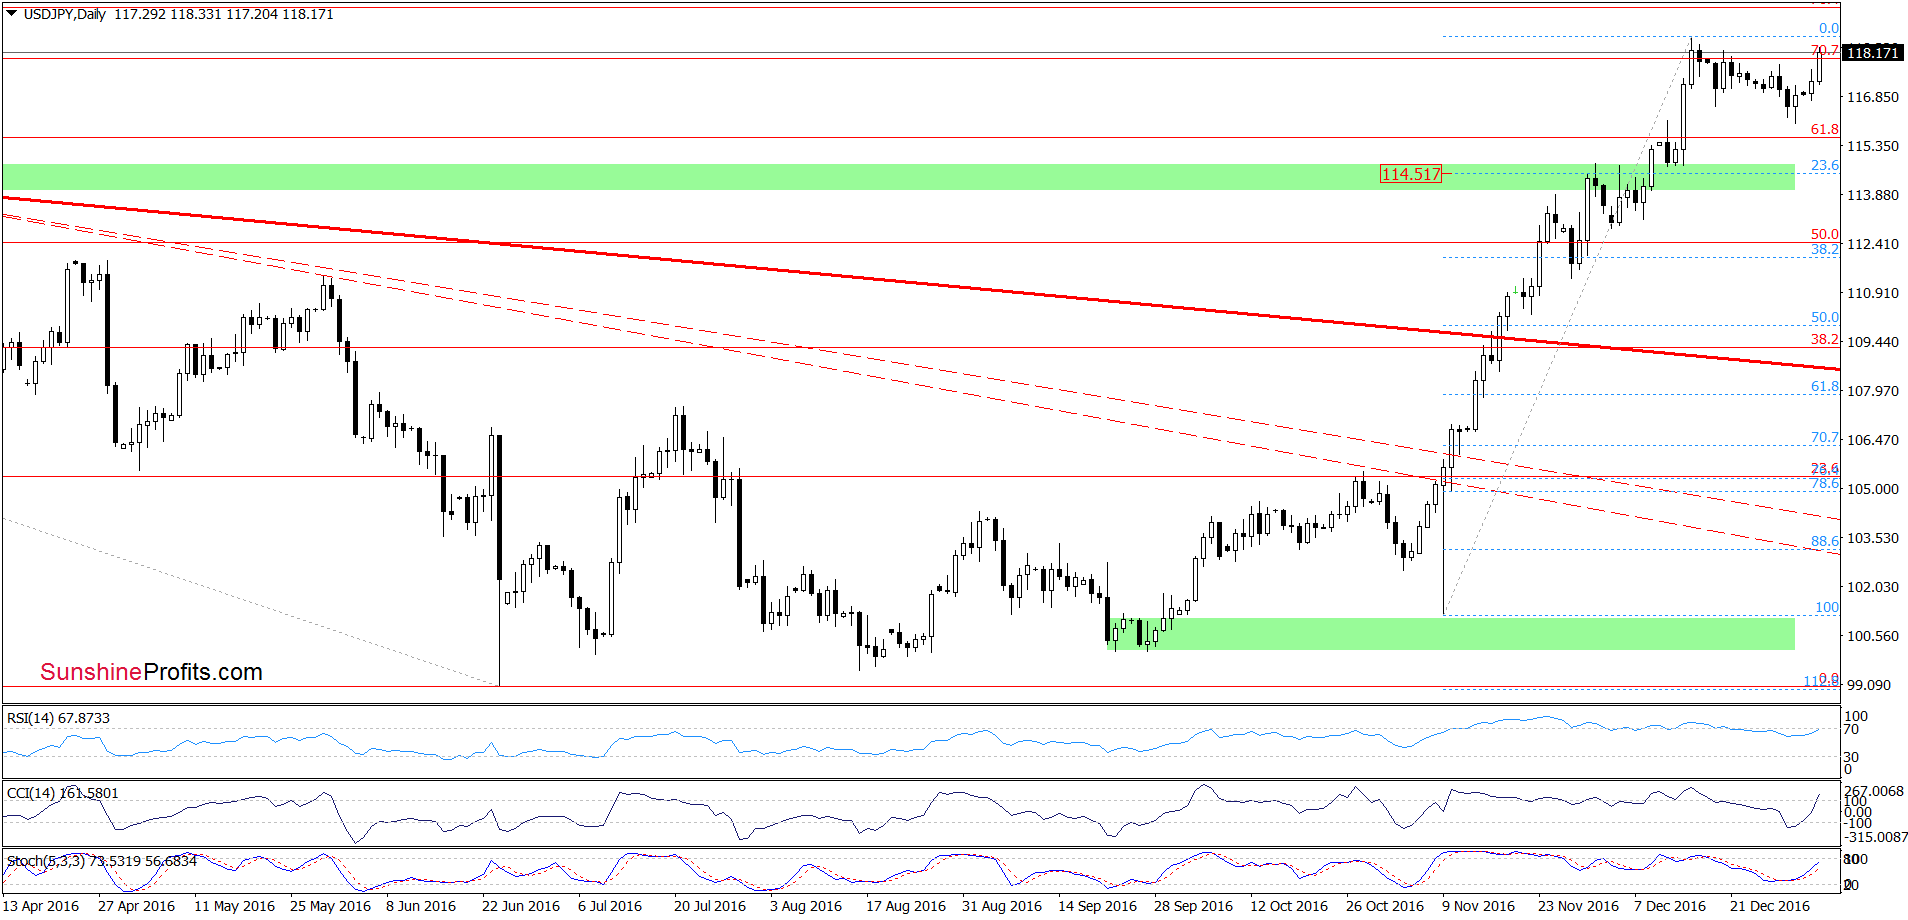
Looking at the daily chart, we see that USD/JPY reversed and approached the December high earlier today. Additionally, the CCI and Stochastic Oscillator generated buy signals, which suggests further improvement in the coming days.
Are there any technical factors that could hinder the realization of the above scenario? Let’s examine the weekly chart and find out.
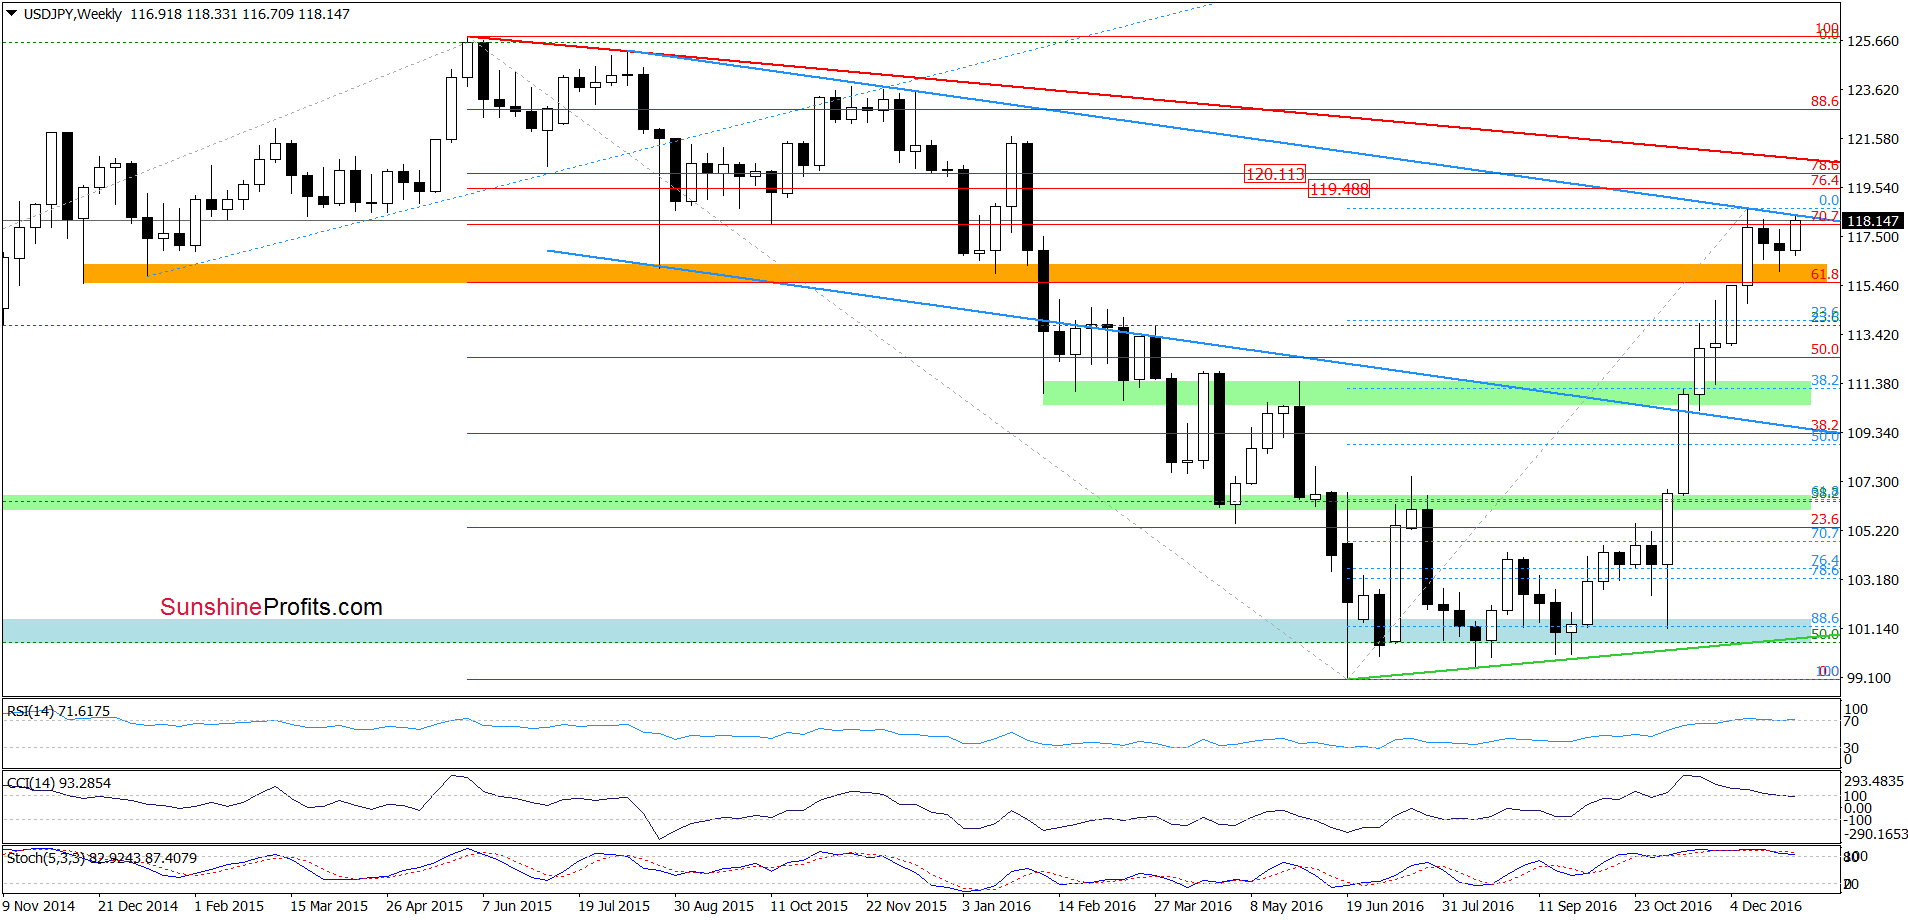
From the medium-term perspective, we see that the pair re-approached the blue declining resistance line, which could stop the appreciation in the coming week(s) – especially when we factor in the current position of the weekly indicators (the RSI remains in its overbought area, while the CCI and Stochastic Oscillator generated sell signals).
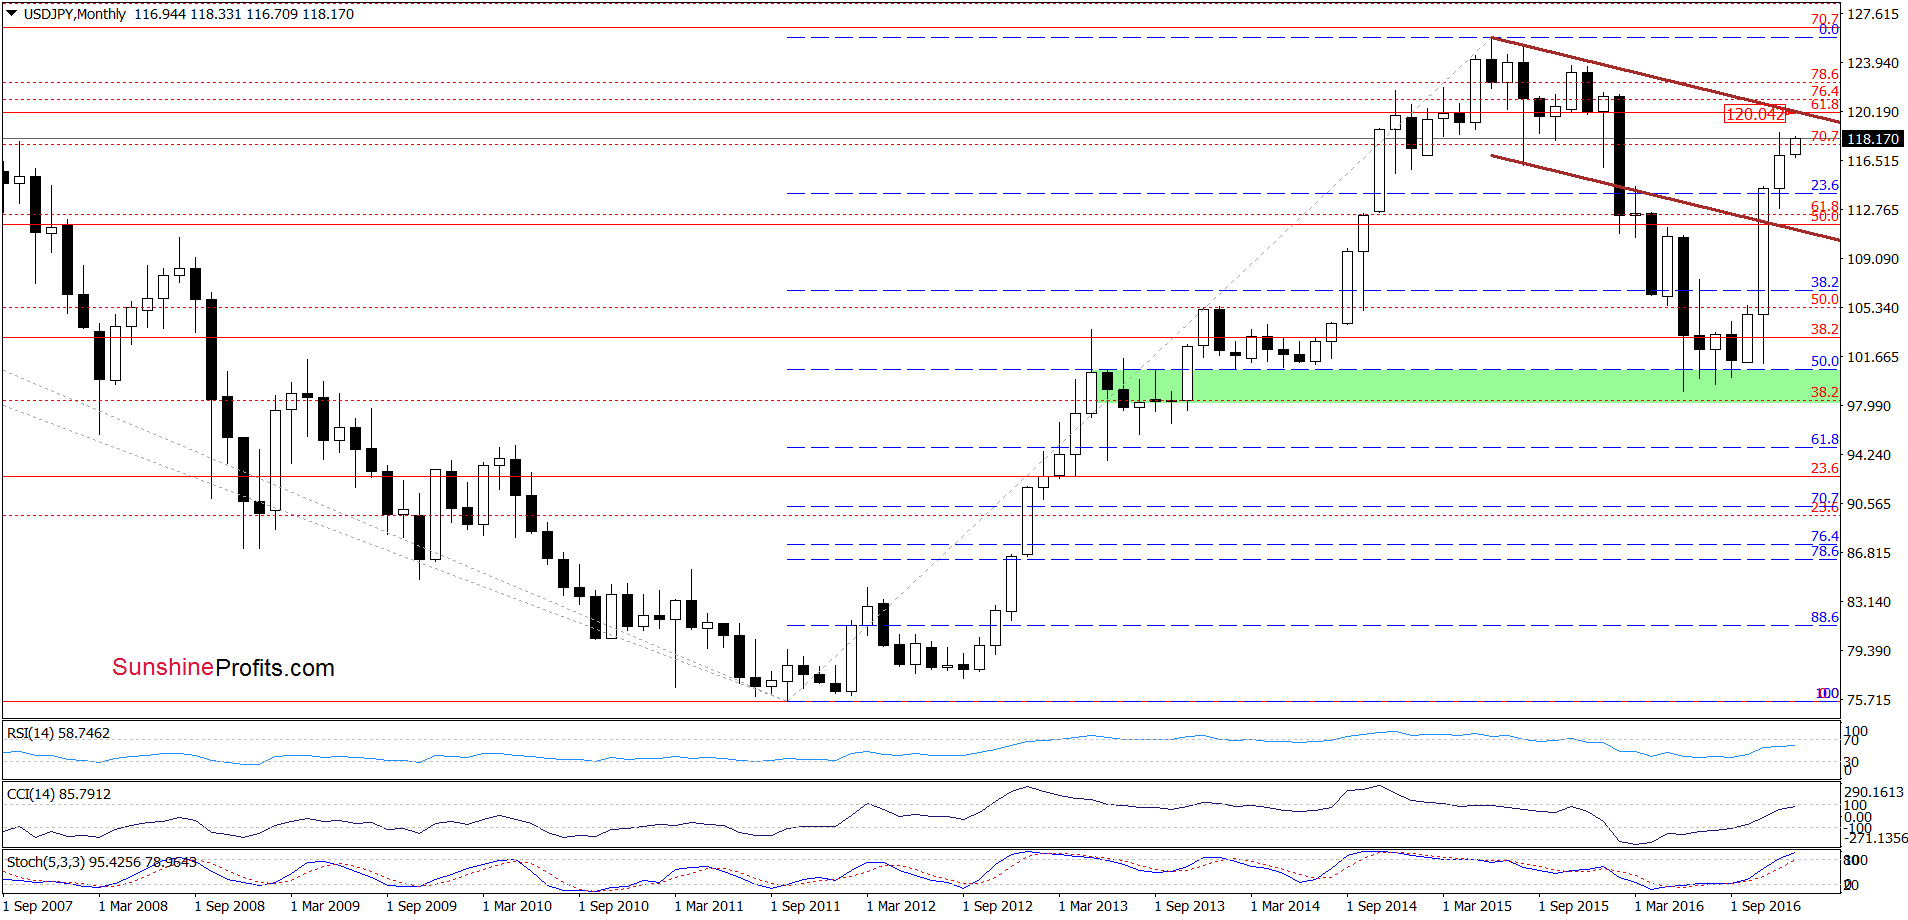
Nevertheless, if currency bulls manage to push the pair above this line, we may see a rally to around 119.48-120.11. Why here? Because the 76.4% and 78.6% Fibonacci retracements (based on the Jun 2015-Jun 2016 downward move) and the brown declining resistance line based on the June and August 2015 highs (we marked it on the chart below) are in this area.
Very short-term outlook: mixed
Short-term outlook: mixed
MT outlook: mixed
LT outlook: mixed
Trading position (short-term; our opinion): No positions are justified from the risk/reward perspective. We will keep you informed should anything change, or should we see a confirmation/invalidation of the above.
Thank you.
Nadia Simmons
Forex & Oil Trading Strategist
Przemyslaw Radomski, CFA
Founder, Editor-in-chief, Gold & Silver Fund Manager
Gold & Silver Trading Alerts
Forex Trading Alerts
Oil Investment Updates
Oil Trading Alerts

