

Earlier today, the USD Index extended yesterday’s drop as disappointing pending home sales report continued to weigh on investors’ sentiment. How did this downswing affect the euro, pound and yen?
In our opinion the following forex trading positions are justified - summary:
EUR/USD
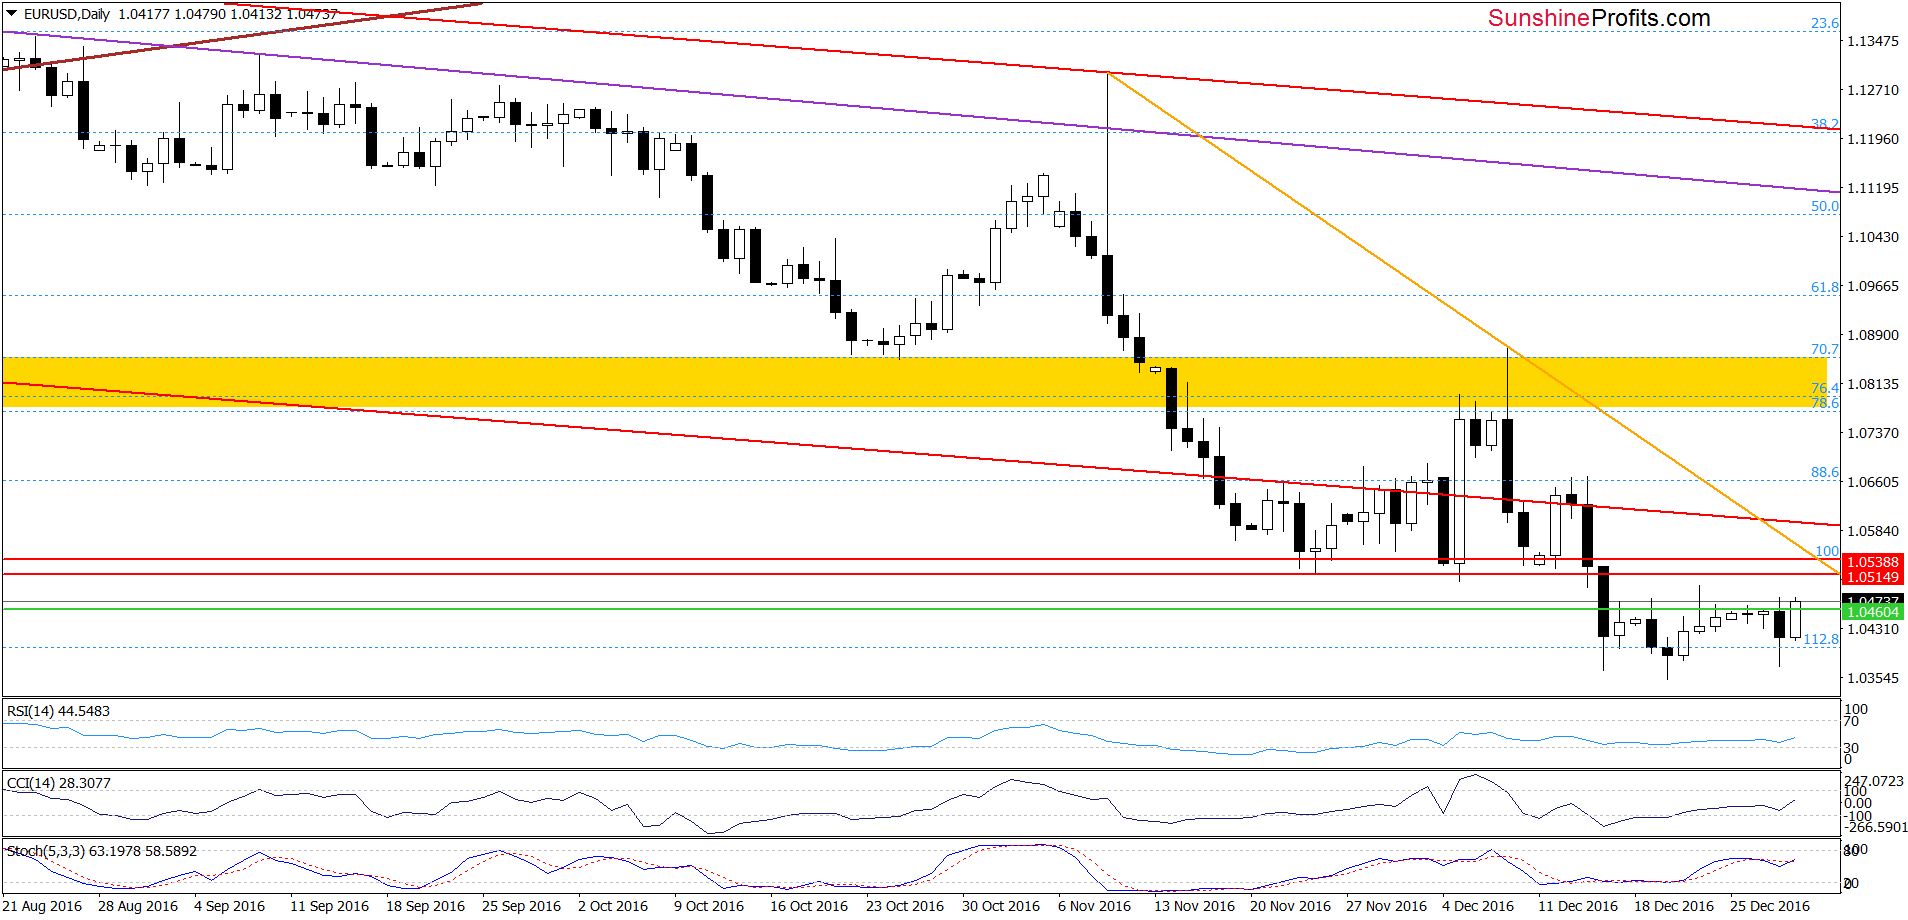
Looking at the daily chart, we see that EUR/USD rebounded and came back around the last week’s high earlier today. Despite this improvement, the exchange rate is still trading under the Nov and early Dec lows, which means that what we wrote in Thursday’s alert is up-to-date also today:
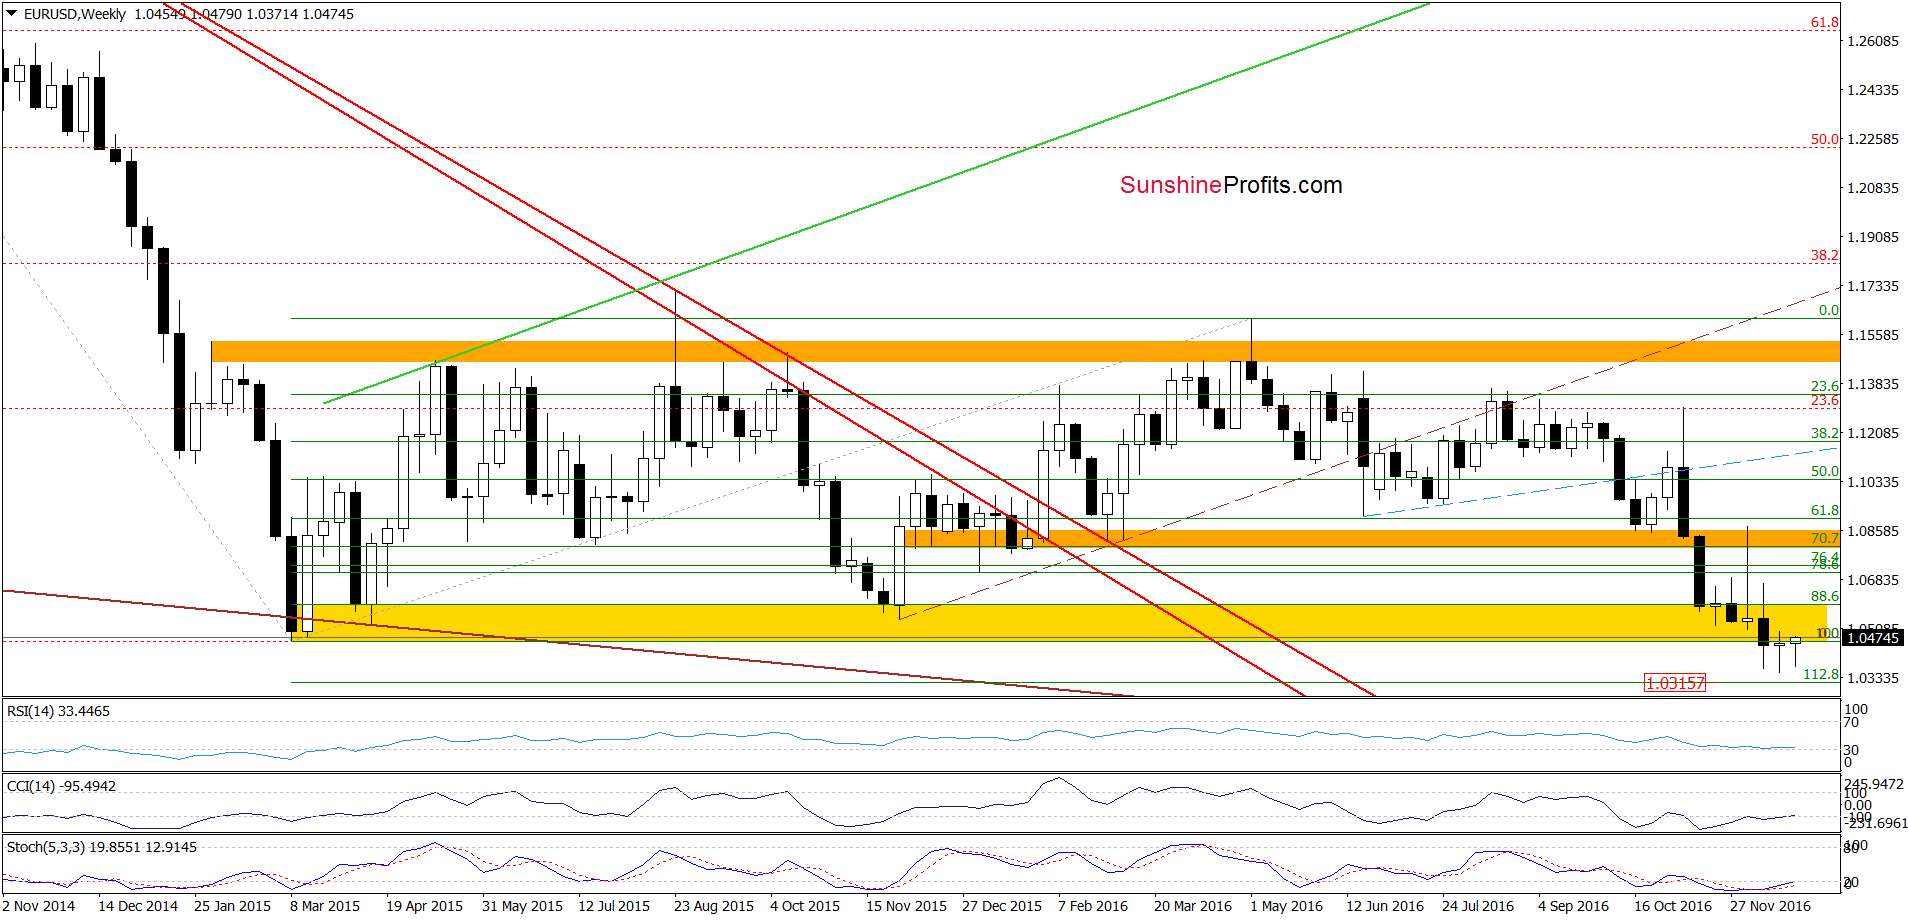
(…) in our opinion, as long as there won’t be an invalidation of the breakdown under the yellow zone marked on the weekly chart (created by the Apr and Nov 2015 lows) another bigger move to the upside is not likely to be seen and another attempt to move lower can’t be ruled out.
If we see a decline, downside targets from our previous alert would be in play:
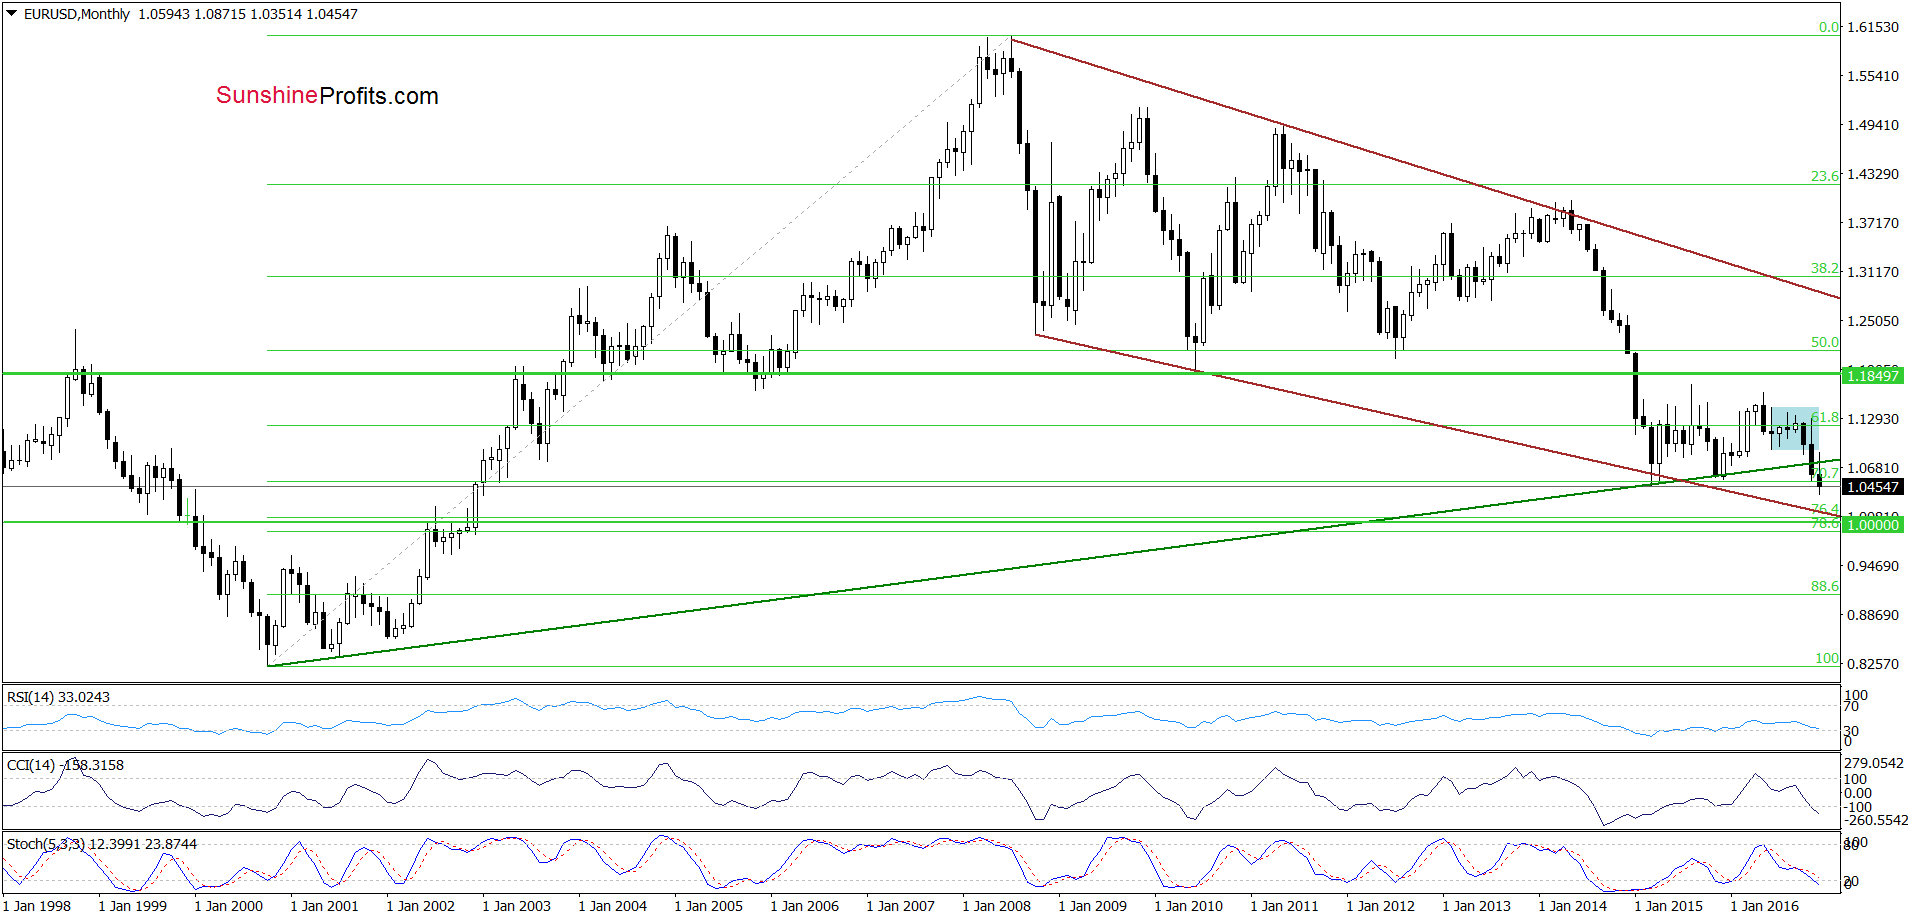
(…) a verification of a breakdown under the previously-broken Nov and early-Dec lows (…) suggests further deterioration to the 112.8%, 127.2% Fibonacci extension (both marked on the weekly chart) or even a test of the lower border of the long-term brown declining trend channel and the barrier of 1.0000 seen on the long-term chart below.
Very short-term outlook: mixed
Short-term outlook: mixed
MT outlook: mixed
LT outlook: mixed
Trading position (short-term; our opinion): No positions are justified from the risk/reward perspective. We will keep you informed should anything change, or should we see a confirmation/invalidation of the above.
GBP/USD
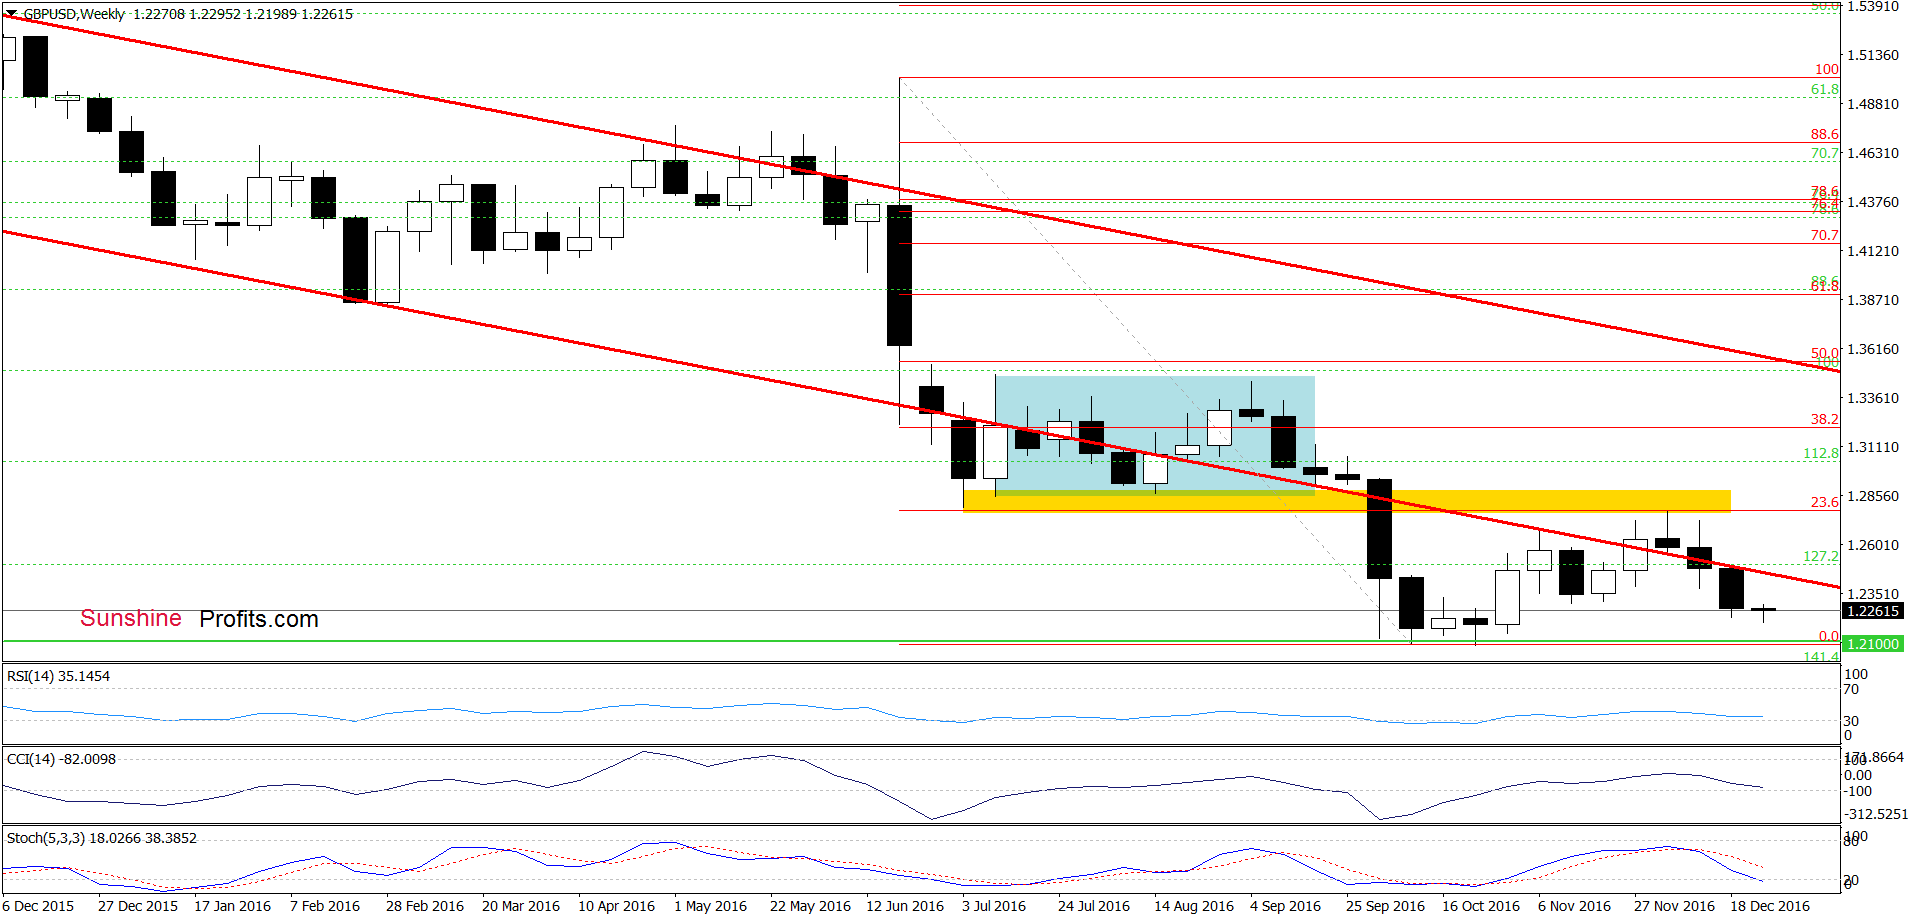
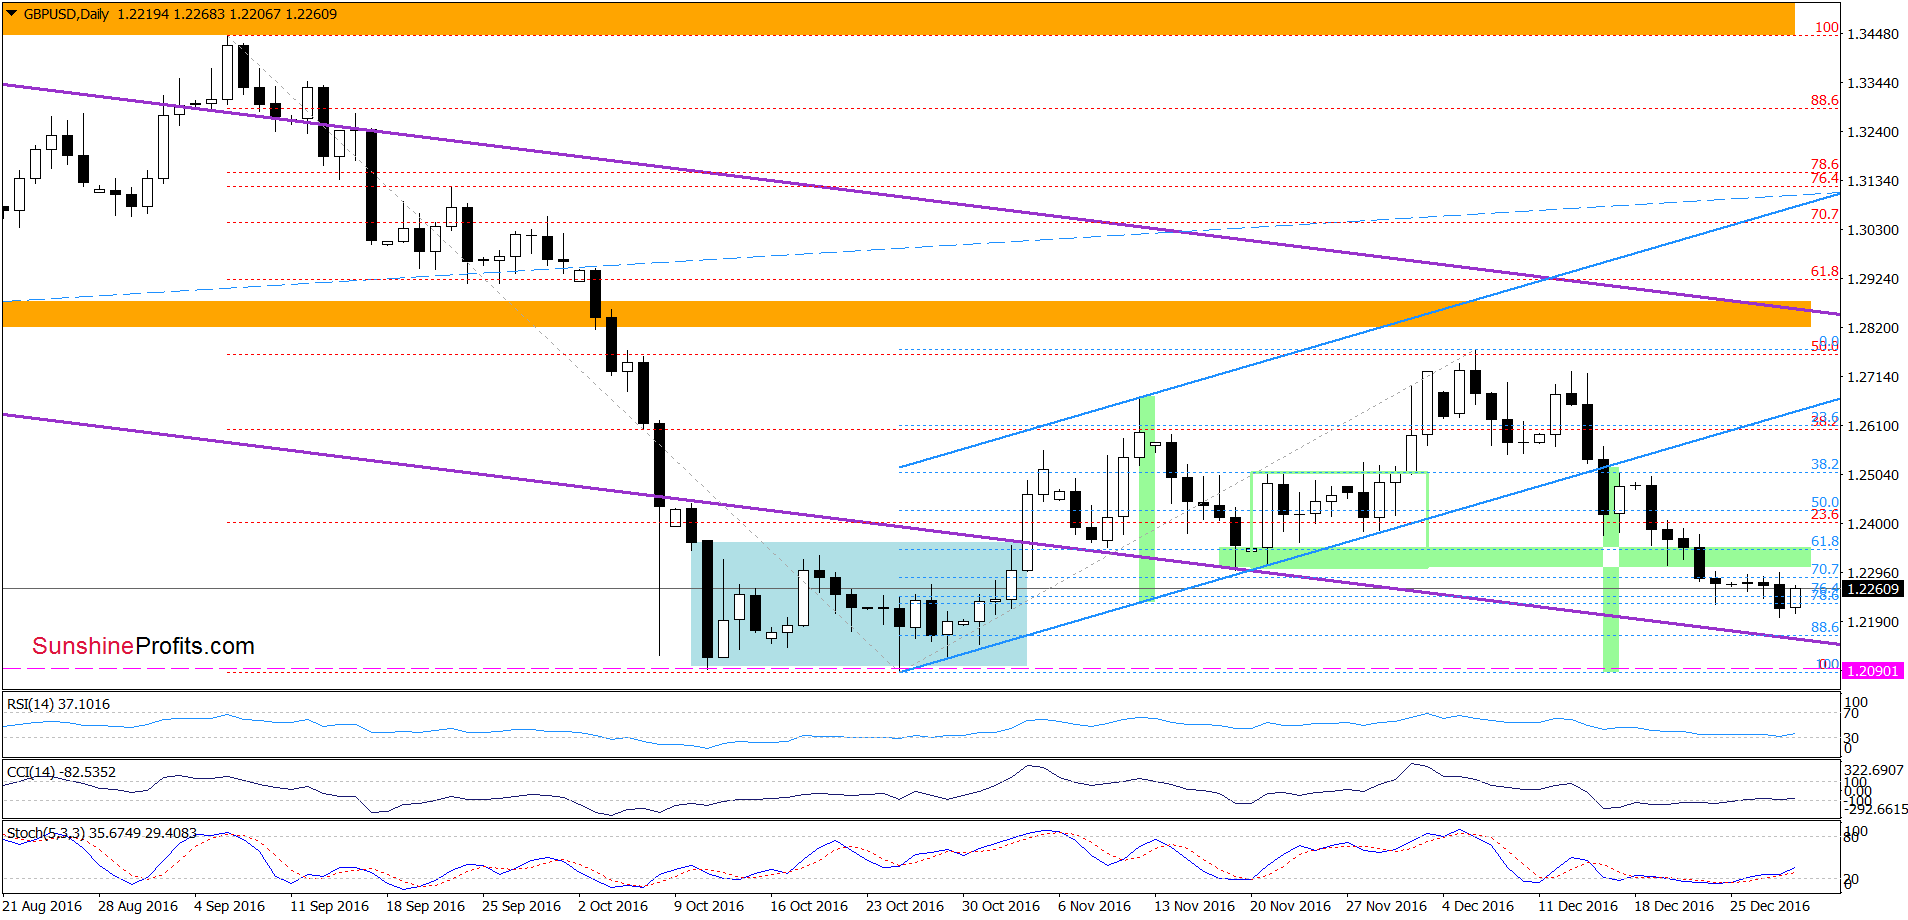
Although GBP/USD moved higher earlier today, the exchange rate is still trading under the previously-broken green zone, which suggests that what we wrote on Tuesday on this currency pair is still valid:
(…) GBP/USD moved lower and invalidated earlier breakout above the lower border of the red declining trend channel – similarly to what we saw at the beginning of Oct. Such price action doesn’t bode well for currency bulls and suggests further deterioration. This scenario is also reinforced by a sell signal generated by the Stochastic Oscillator.
How low could the exchange rate go?
(…) we should keep in mind that the last week’s decline pushed the pair below the lower border of the blue rising trend channel, which is a negative signal that suggests a drop to around 1.2090, where the size of the move would correspond to the height of the channel. In this area is also the Oct low and the barrier of 1.2000, which together could stop further deterioration once again.
Very short-term outlook: mixed with bearish bias
Short-term outlook: mixed
MT outlook: mixed
LT outlook: mixed
Trading position (short-term; our opinion): No positions are justified from the risk/reward perspective. We will keep you informed should anything change, or should we see a confirmation/invalidation of the above.
USD/JPY
On Dec 21, we wrote the following:
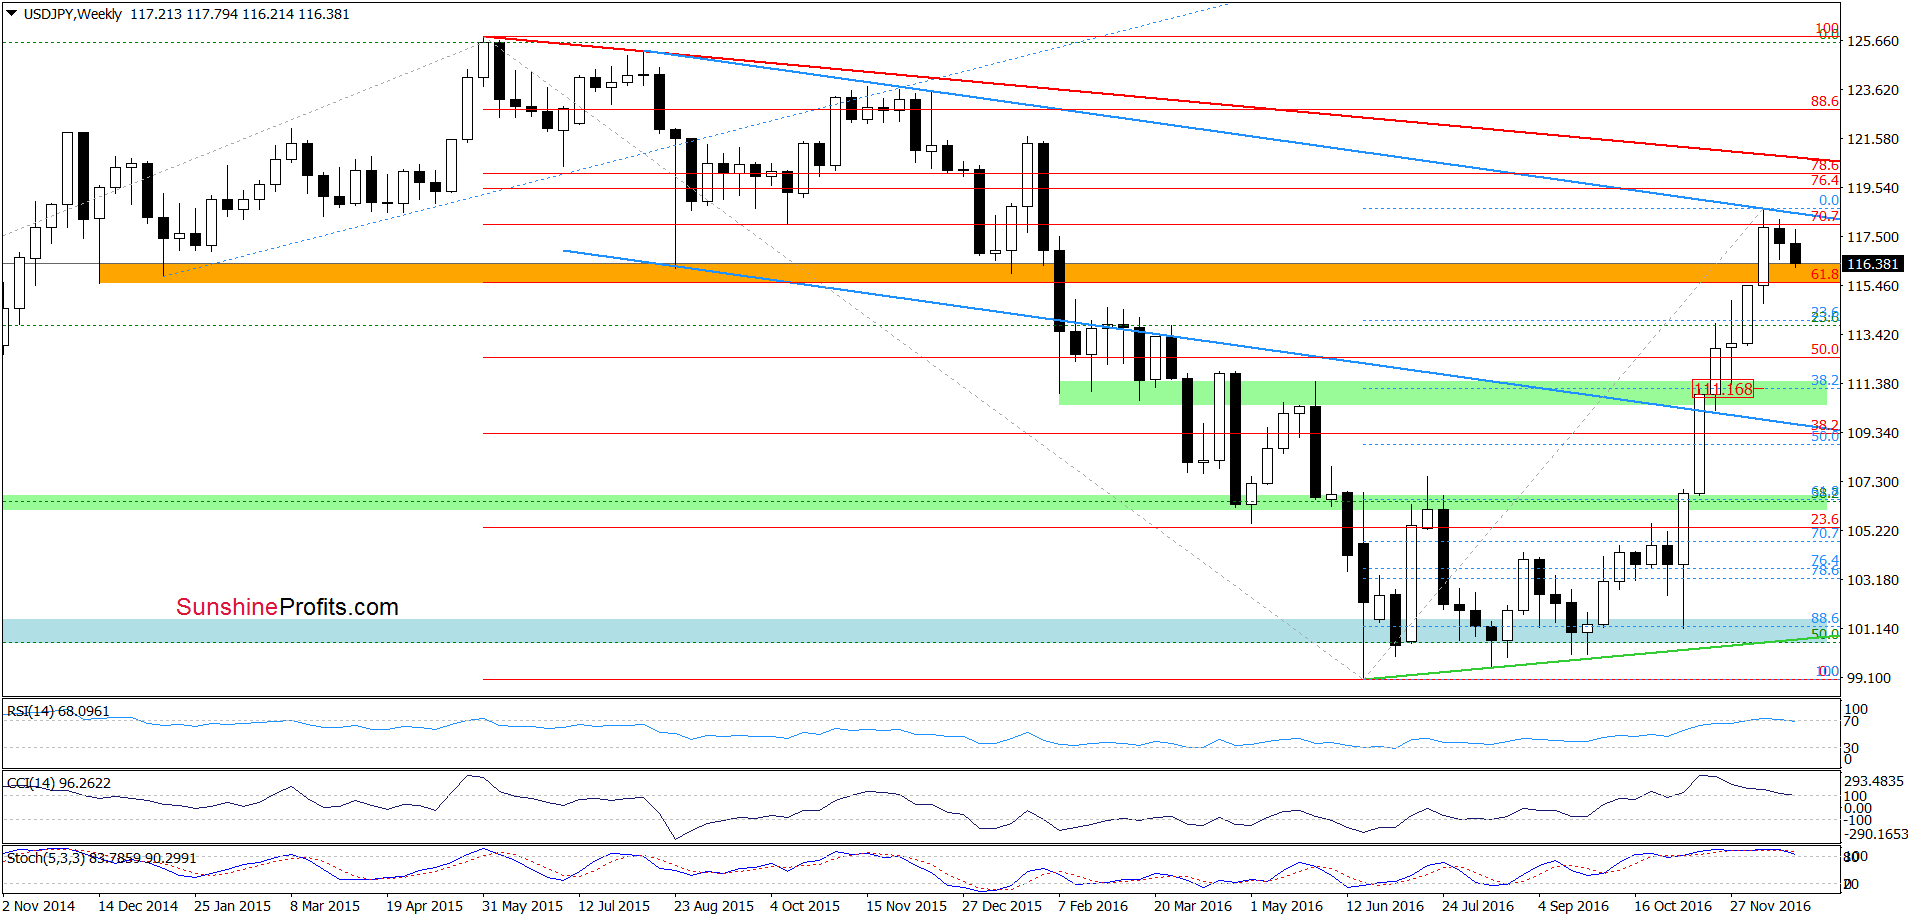
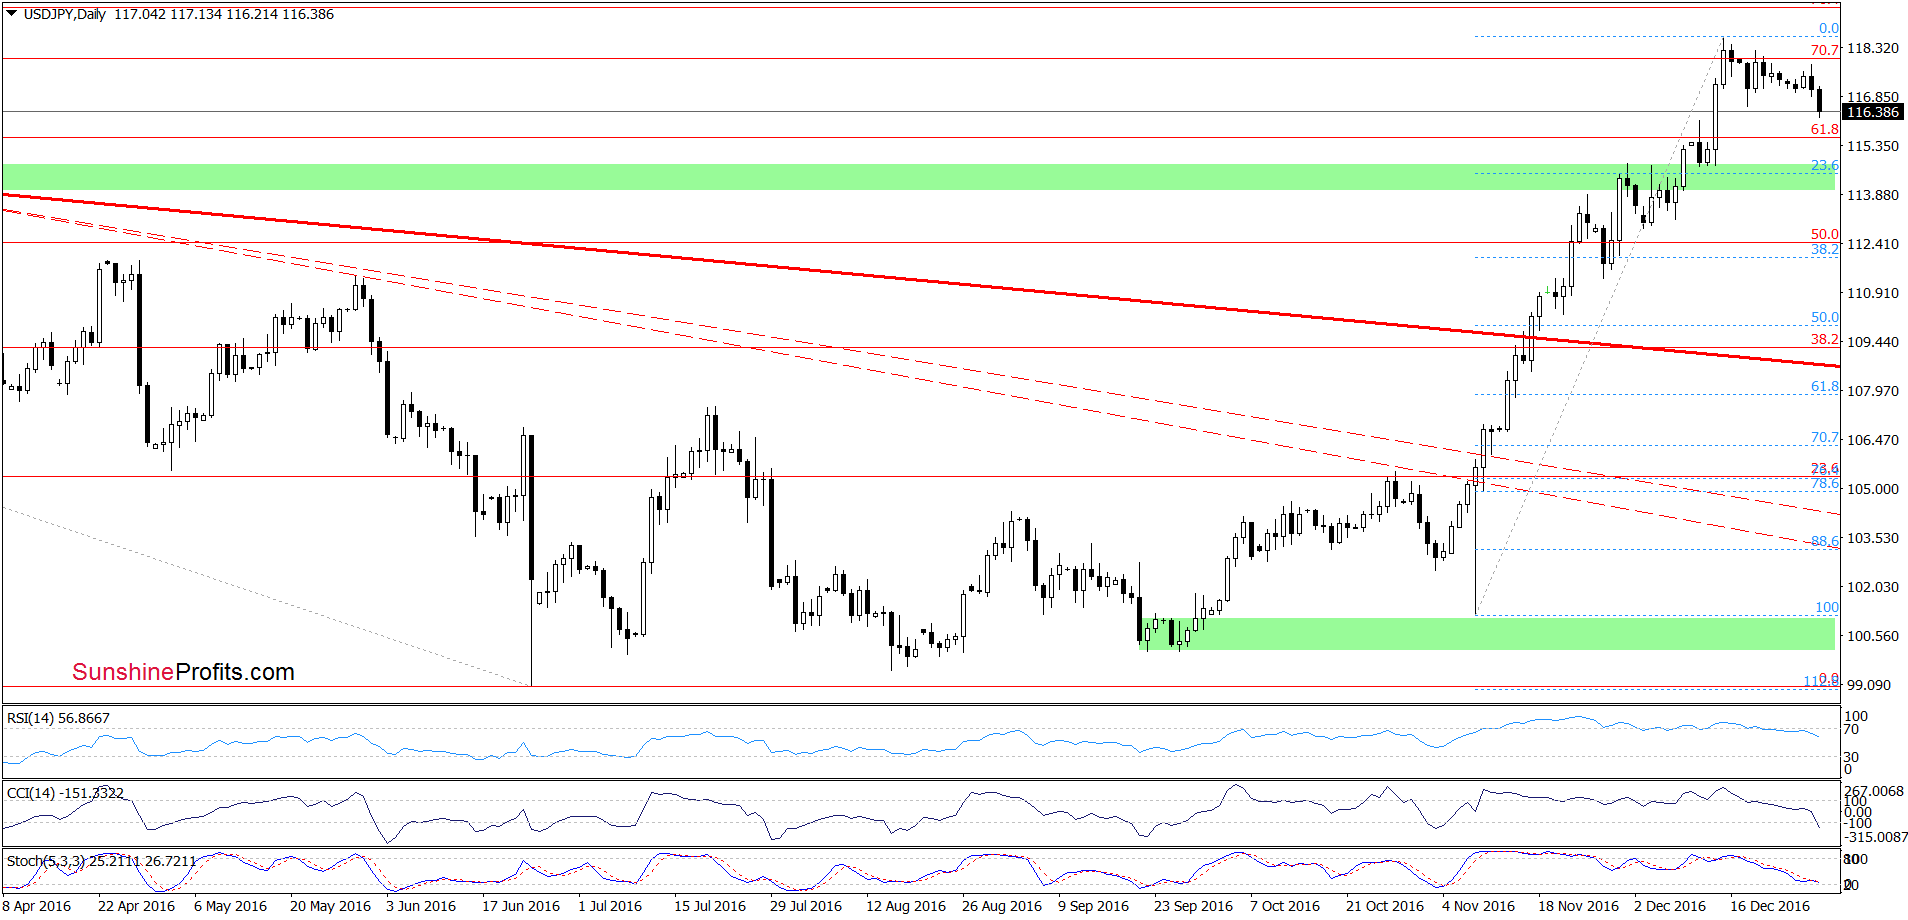
(…) USD/JPY (…) broke above the orange resistance zone, which took the exchange rate to the upper border of the blue declining trend channel. As you see, this area is also reinforced by the 70.7% Fibonacci retracement (…). Additionally, weekly and daily and weekly indicators are very close to generating sell signals, which increases the probability of further declines in the coming days.
From today’s point of view, we see that currency bears pushed USD/JPY lower as we had expected. With this drop, the pair slipped to the orange zone (marked on the weekly chart), which serves now as the nearest support. Although this area could pause declines, we think that as long as there won’t be buy signals generated by the daily indicators another attempt to move lower is likely. If this is the case, and the pair drops under the orange zone, we may see a decline to around 114.52-114.75, where the mid-Dec lows and the 23.6% Fibonacci retracement are.
Very short-term outlook: mixed
Short-term outlook: mixed
MT outlook: mixed
LT outlook: mixed
Trading position (short-term; our opinion): No positions are justified from the risk/reward perspective. We will keep you informed should anything change, or should we see a confirmation/invalidation of the above.
Thank you.
Nadia Simmons
Forex & Oil Trading Strategist
Przemyslaw Radomski, CFA
Founder, Editor-in-chief, Gold & Silver Fund Manager
Gold & Silver Trading Alerts
Forex Trading Alerts
Oil Investment Updates
Oil Trading Alerts

