

Yesterday, EUR/USD rebounded sharply after the outcome of Italian referendum, but will we see a continuation of the rally in the coming days?
In our opinion the following forex trading positions are justified - summary:
EUR/USD
On Wednesday, we wrote the following:
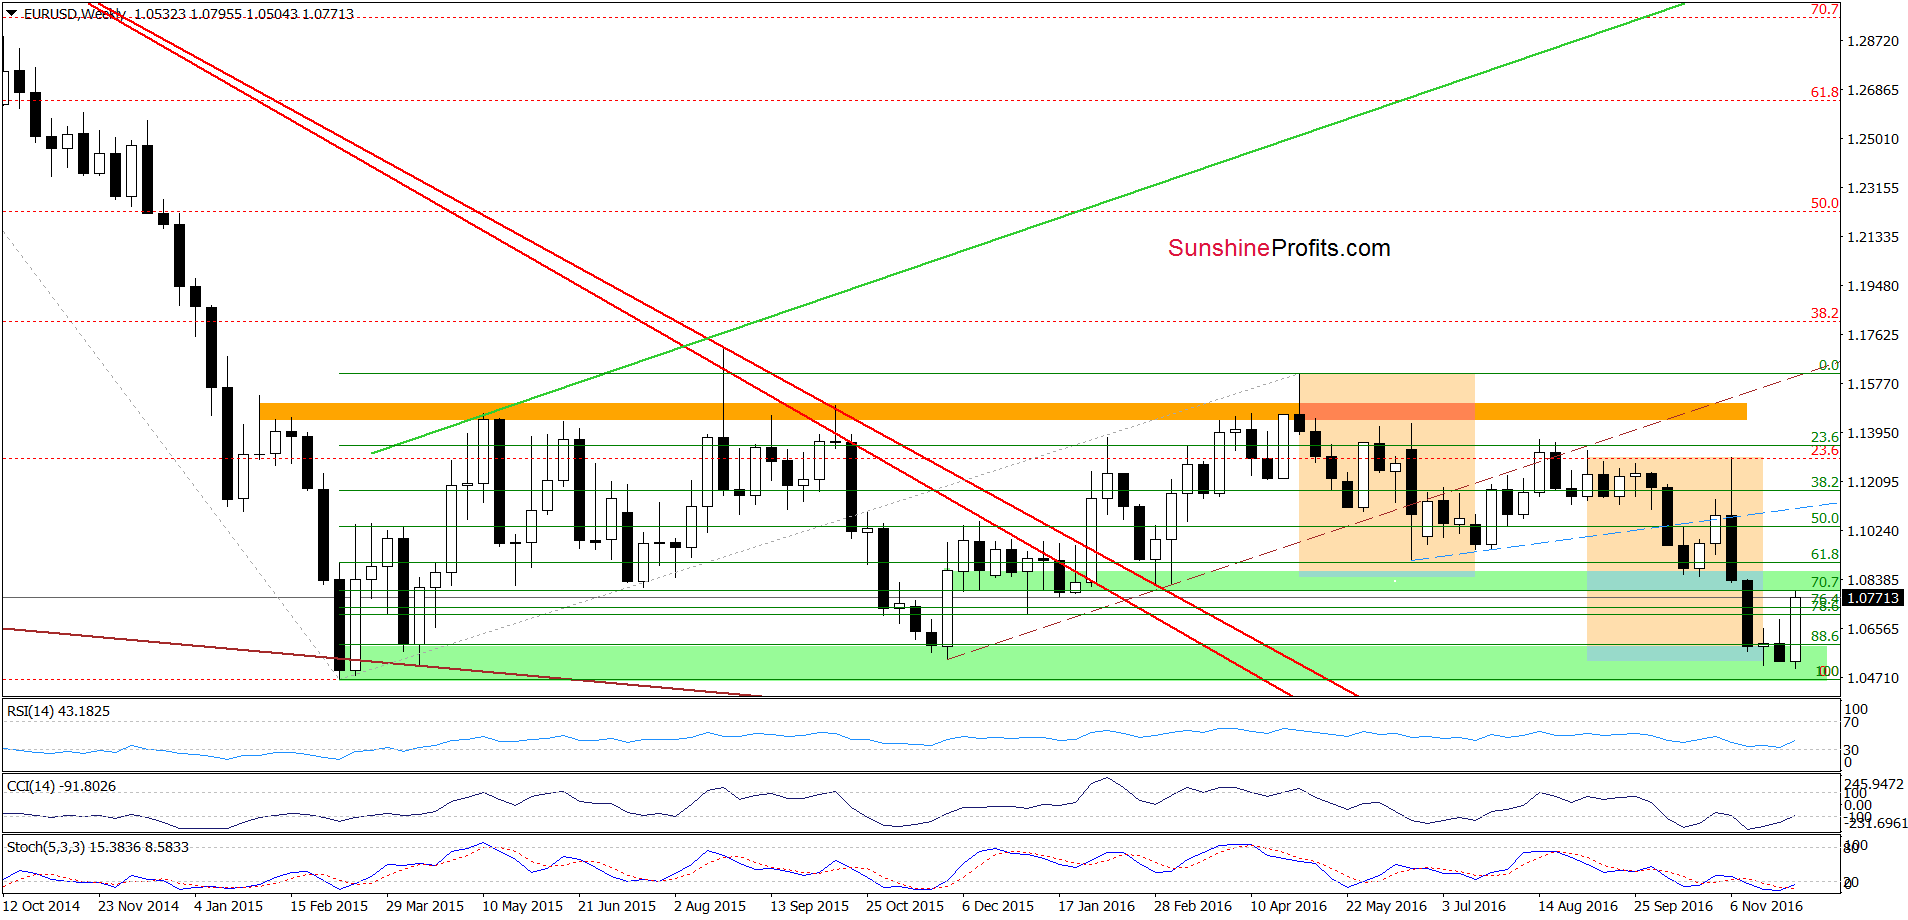
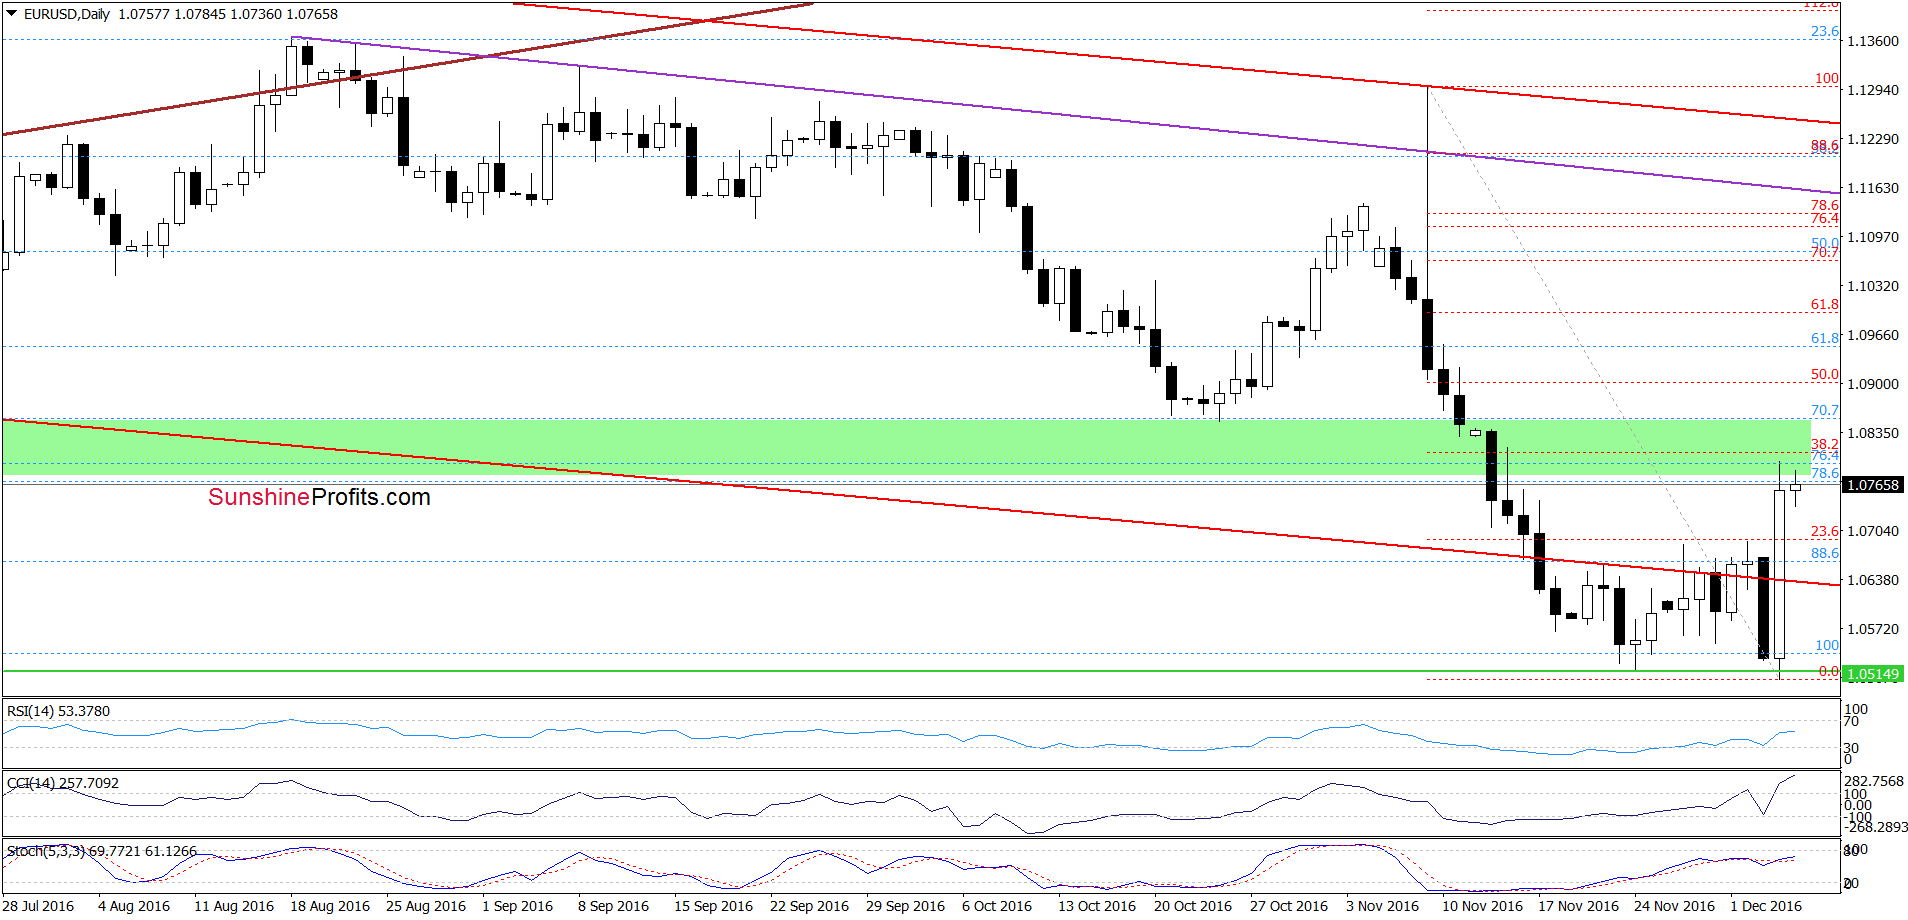
(…) the exchange rate remains under the Monday’s high and the 23.6% Fibonacci retracement, which means that further improvement would be more likely and reliable only if the pair climbs and closes today’s session (or one of the following) above these levels. In this case, the next target for currency bulls would be the previously-broken green zone (around Nov low), which serves as the nearest stronger resistance.
From today’s point of view, we see that currency bulls pushed the exchange rate higher as we had expected and EUR/USD climbed to our initial upside target. What’s next? Taking into account the green resistance zone and the 38.2% Fibonacci retracement, it we think that that the pair will reverse and correct yesterday’s rally in very near future. However, as long as buy signals generated by the indicators remain in place another attempt to move higher and a test of the upper border of the green zone (around 1.0850) or even the next retracement (50% around 1.0900) can’t be ruled out.
Very short-term outlook: mixed
Short-term outlook: mixed
MT outlook: mixed
LT outlook: mixed
Trading position (short-term; our opinion): No positions are justified from the risk/reward perspective. We will keep you informed should anything change, or should we see a confirmation/invalidation of the above.
GBP/USD
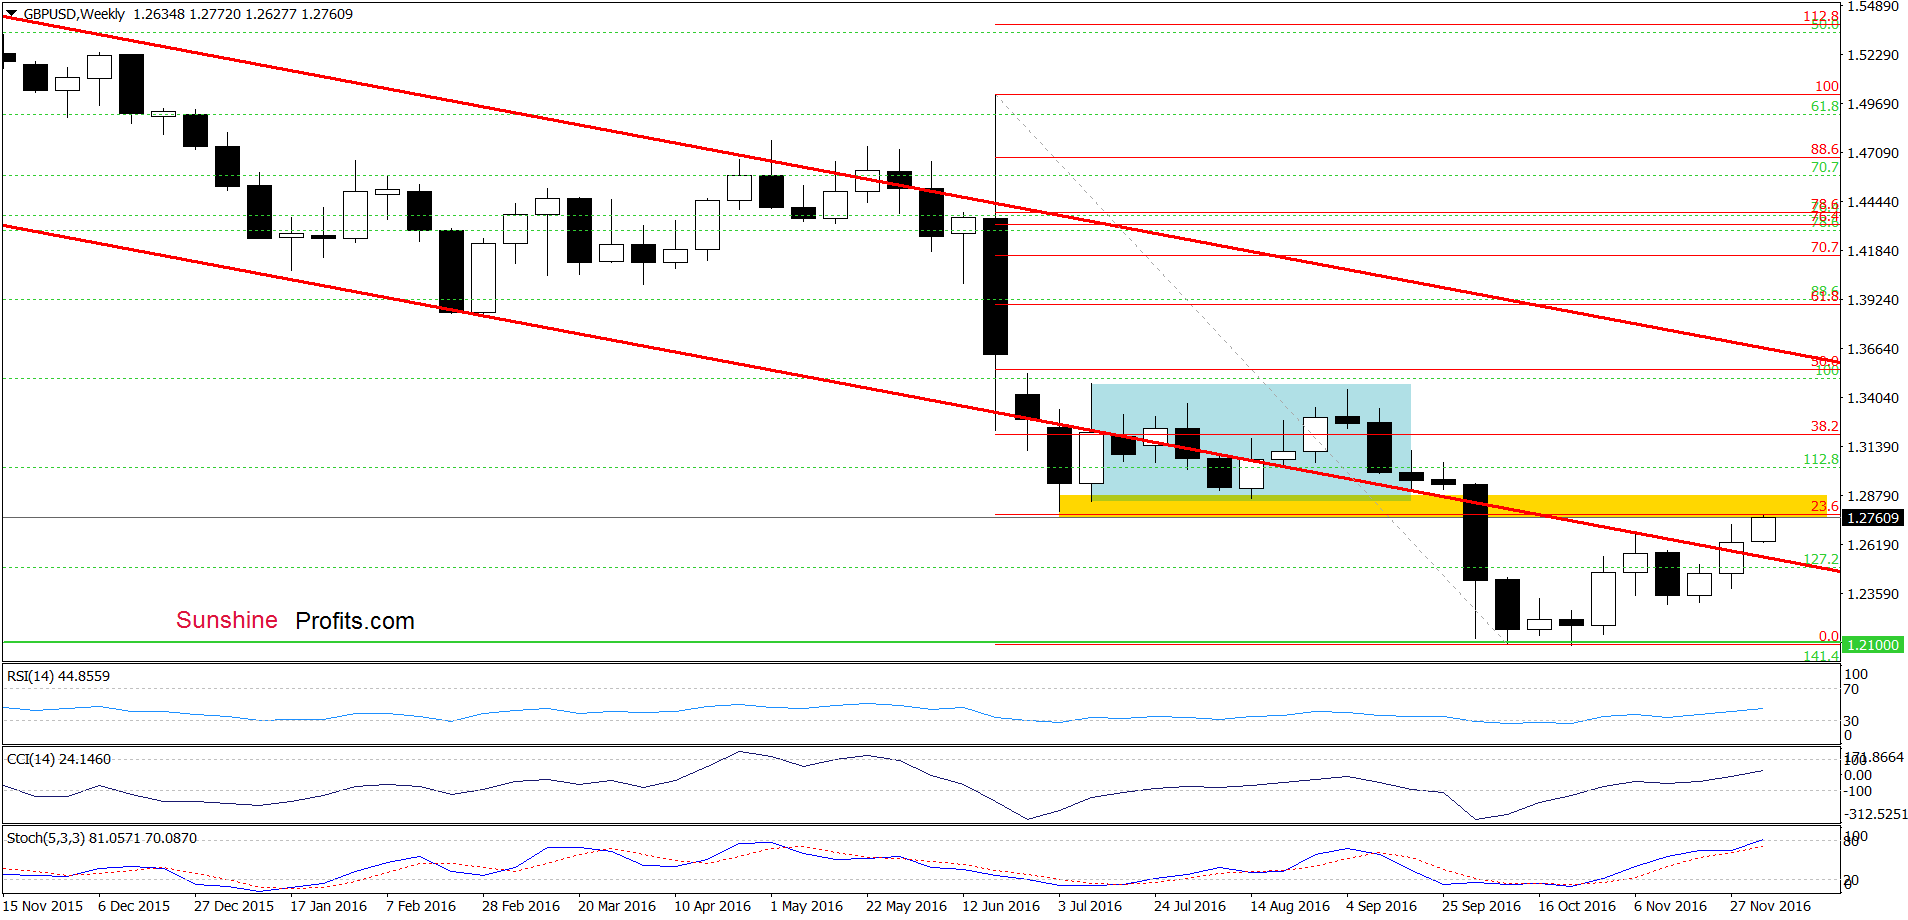
The first thing that catches the eye on the weekly chart is an invalidation of the breakdown under the lower border of the red declining trend channel.
How did this event affect the very short-term chart? Let’s check.
On Friday, we wrote the following:
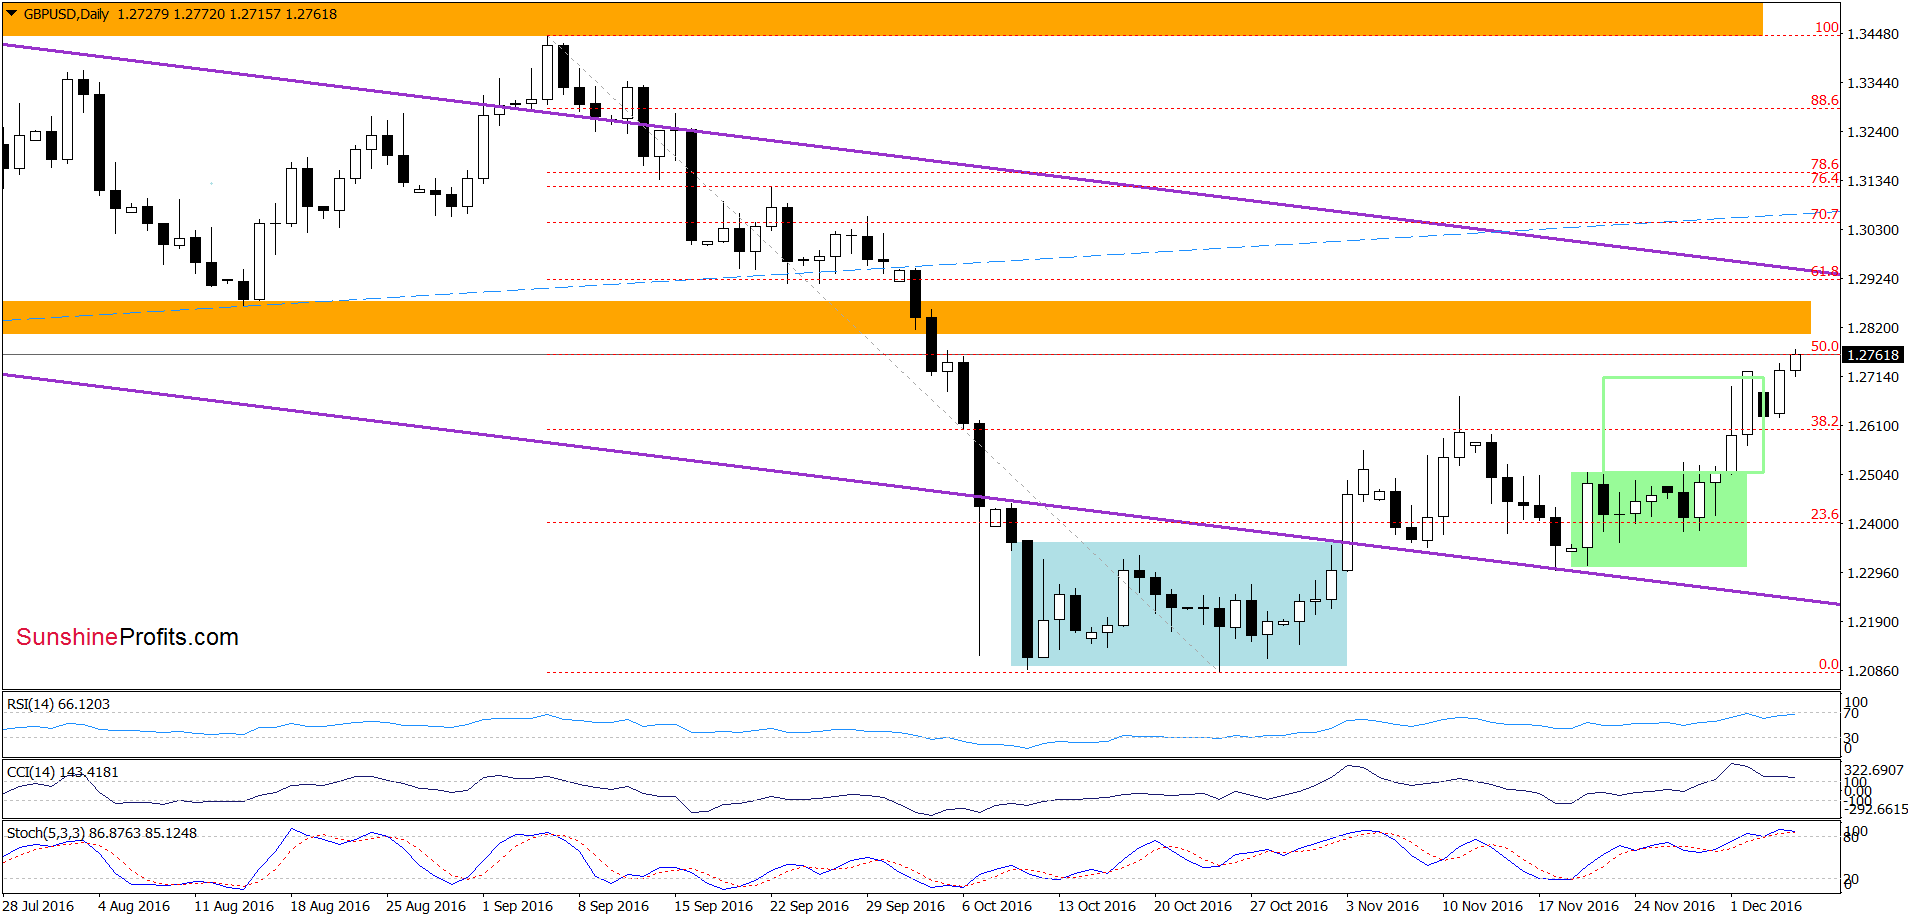
(…) GBP/USD increased (…) above the mid-Nov high and the 38.2% Fibonacci retracement. Additionally, the Stochastic Oscillator re-generated a buy signal, which suggests further improvement and a test of the 50% retracement or even the orange resistance zone.
From this perspective, we see that GBP/USD moved higher once again and reached our first upside target. Taking this fact into account, and combining it with the proximity to the orange resistance zone and the current position of the indicators (there are negative divergences between the RSI, CCI and the exchange rate), we think that reversal is just around the corner. If this is the case, and the pair moves lower from current levels, the initial downside target would be the previously-broken upper border of the green consolidation (around 1.2510-1.2530). If this area is broken, the next target for currency bears would be around 1.2310, where the lower line of the formation is.
Very short-term outlook: mixed
Short-term outlook: mixed
MT outlook: mixed
LT outlook: mixed with bearish bias
Trading position (short-term; our opinion): No positions are justified from the risk/reward perspective. We will keep you informed should anything change, or should we see a confirmation/invalidation of the above.
USD/JPY
The overall situation in USD/JPY hasn’t changed much since yesterday, which means that our previous commentary on this currency pair is up-to-date also today:
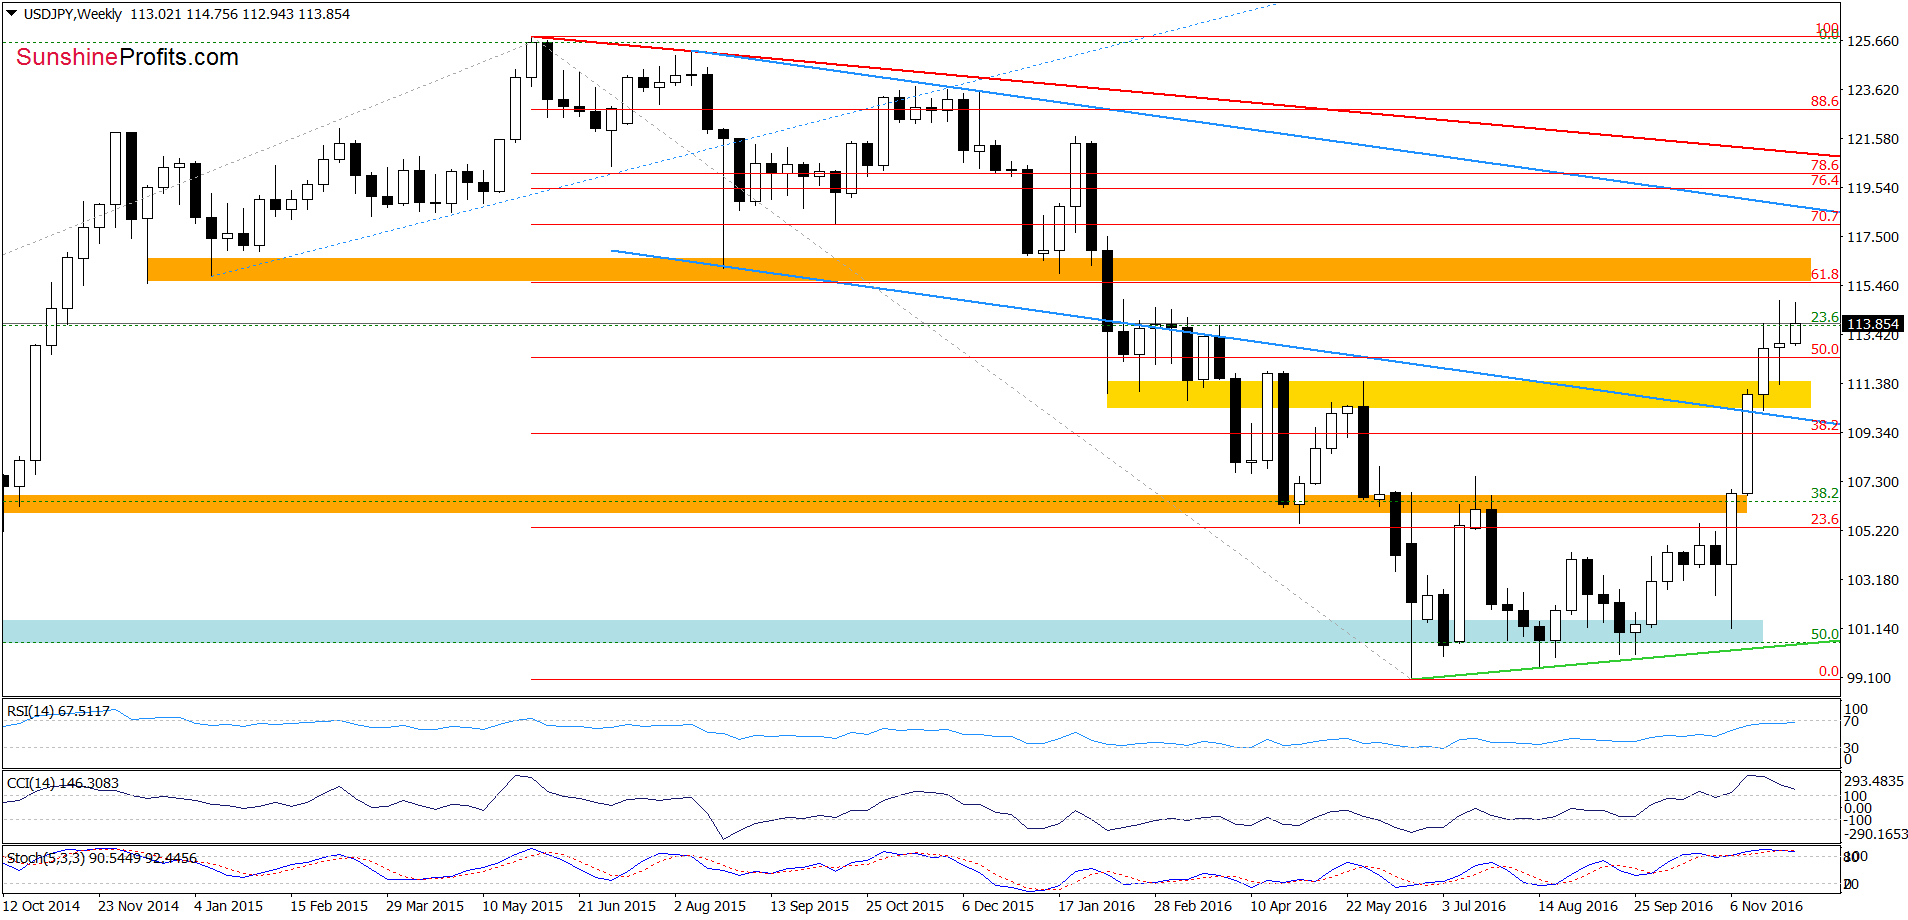
On the weekly chart, we see that although USD/JPY moved lower in the previous week, currency bulls didn’t give up and pushed the exchange rate higher, erasing almost all earlier losses, which is a positive signal that suggests further improvement and a test of the orange resistance zone in the coming days.
Will the very short-term picture confirm this scenario? Let’s check.
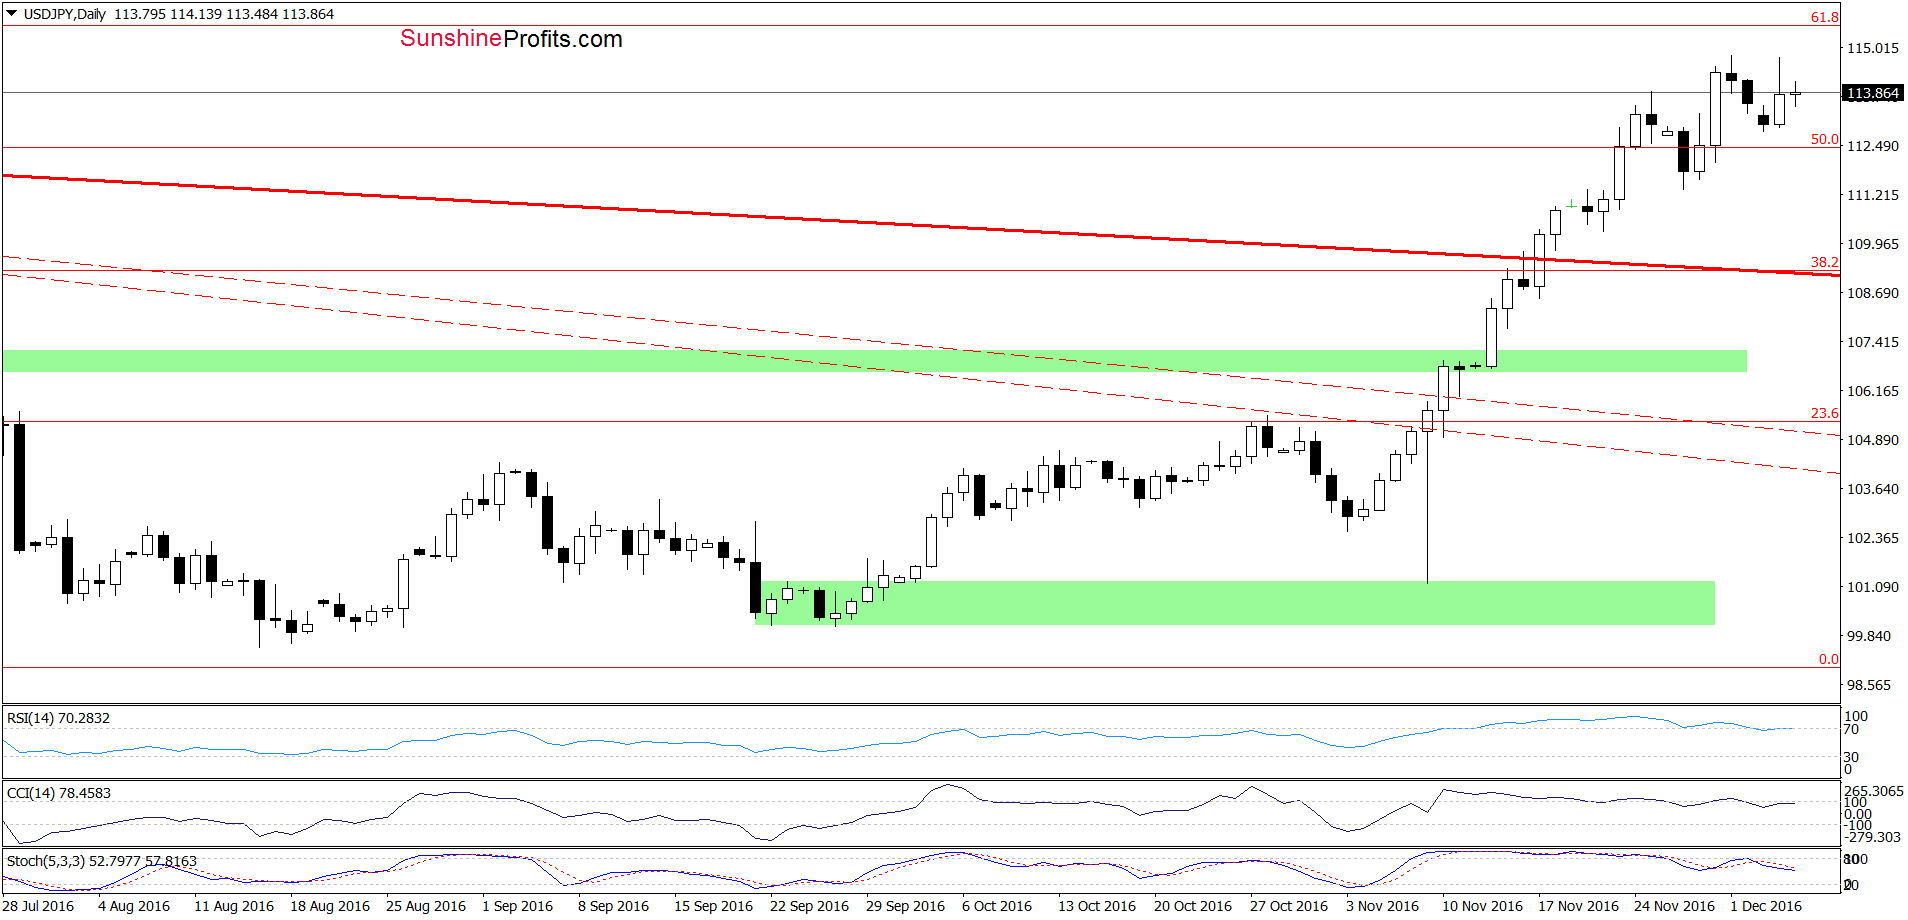
From this perspective, we see that the CCI invalidated earlier sell signal, while the Stochastic Oscillator generated a buy signal, which will likely support currency bulls and result in a test of the 61.8% Fibonacci retracement in near future. Nevertheless, there are negative divergences between indicators and the exchange rate, which increases the probability of reversal in the coming days.
Very short-term outlook: mixed
Short-term outlook: mixed
MT outlook: mixed
LT outlook: mixed
Trading position (short-term; our opinion): No positions are justified from the risk/reward perspective. We will keep you informed should anything change, or should we see a confirmation/invalidation of the above.
USD/CAD
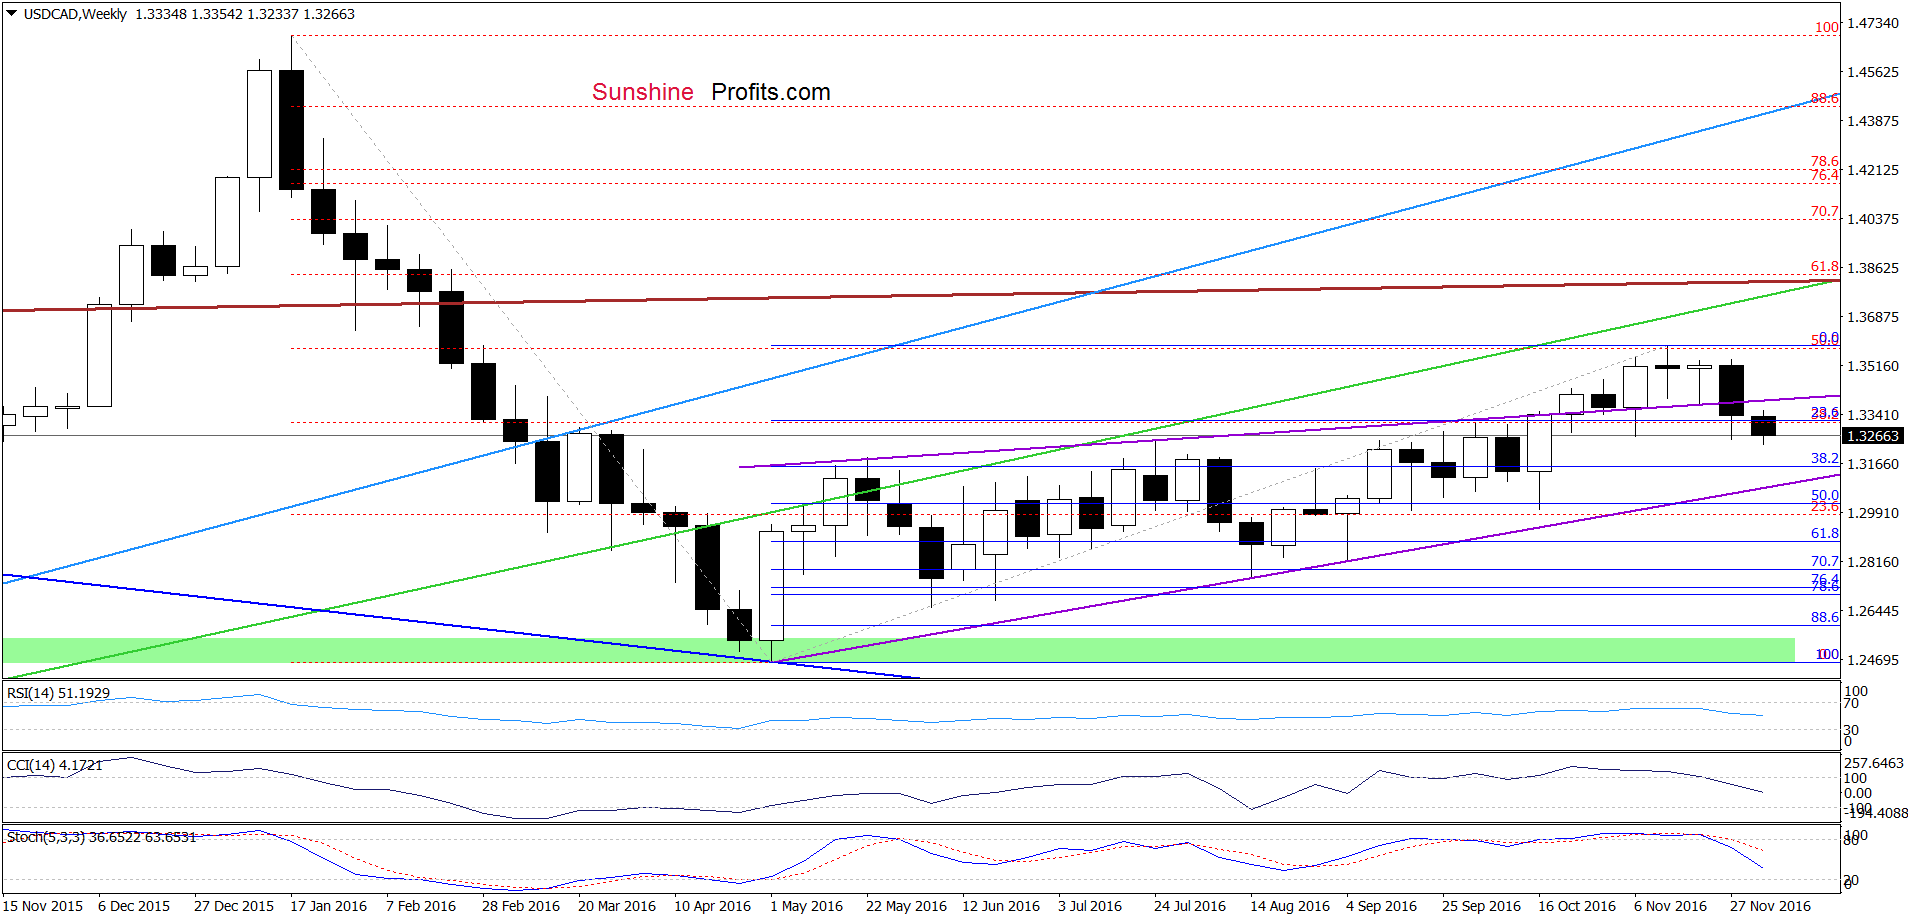
The situation in the medium term has deteriorated after USD/CAD broke below the upper border of the purple rising wedge, which opened the way to lower levels. What impact did this drop have on the very short-term chart? Let’s check.
On Thursday, we wrote the following:
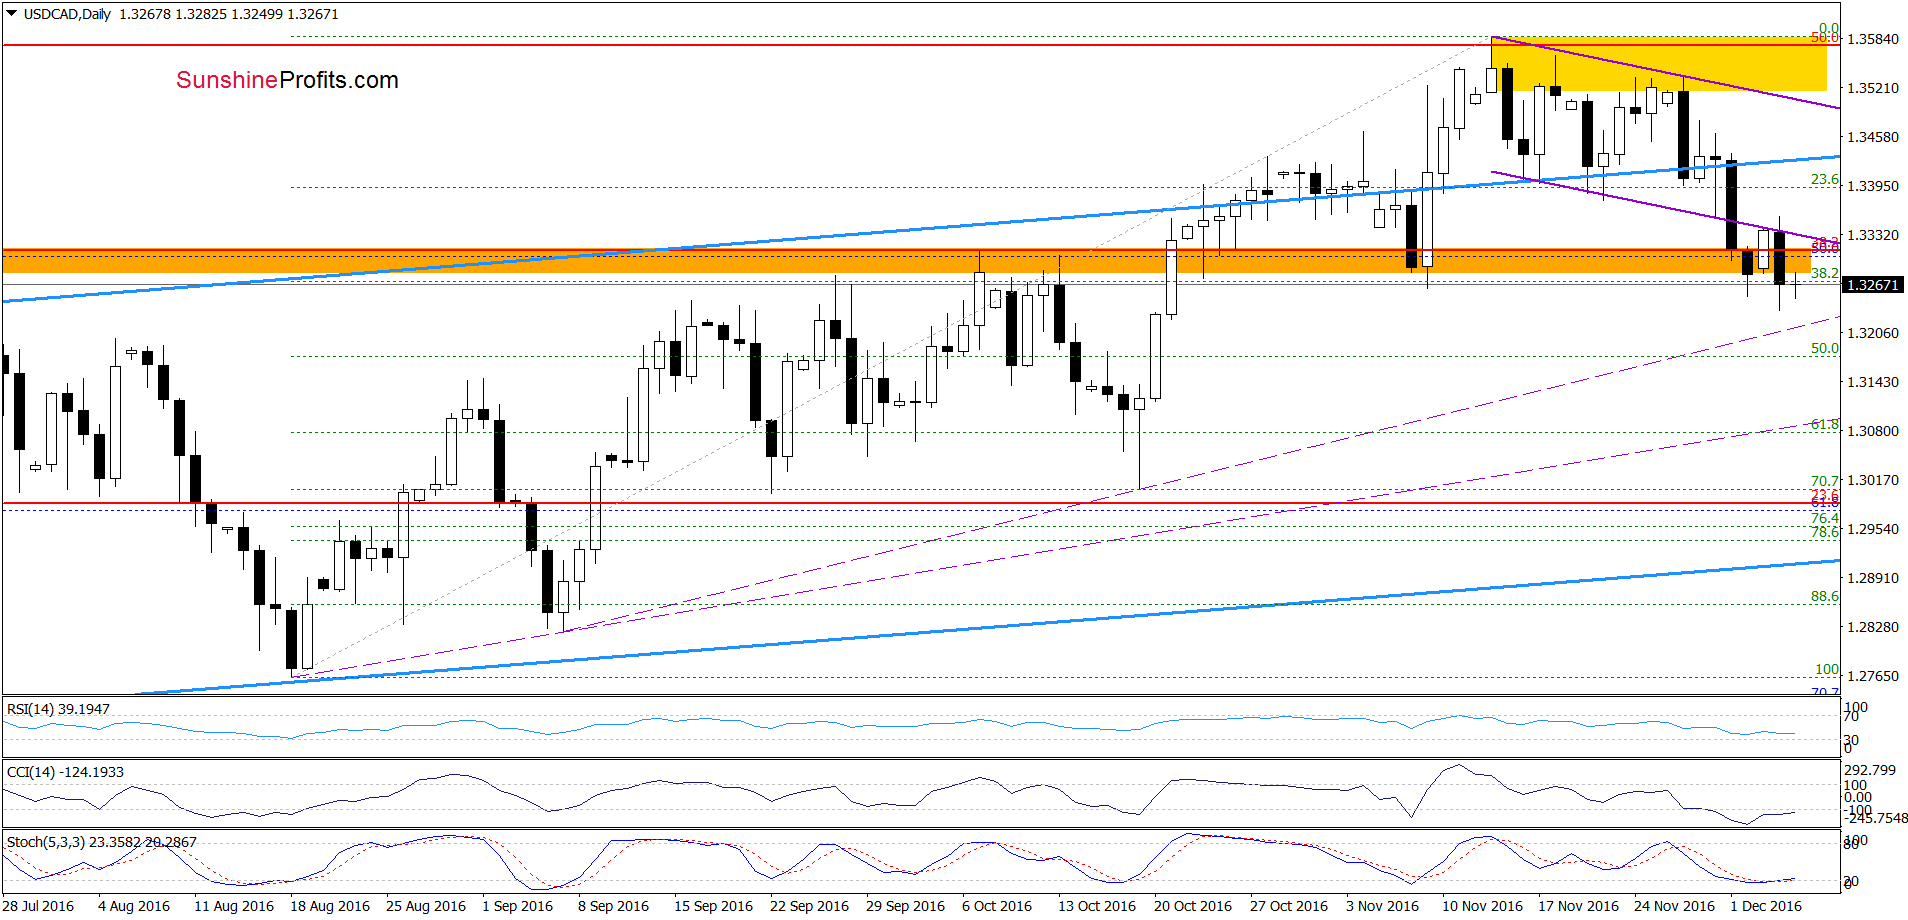
(…) USD/CAD slipped below the upper border of the blue rising trend channel one again earlier today, which in combination with sell signals generated by the indicators suggests a re-test of the lower line of the very short-term purple declining trend channel. If this support is broken, currency bears will test the orange support zone, reinforced by the Nov 9 low and the 38.2% Fibonacci retracement in the following days.
On the daily chart, we see that the situation developed in line with the above scenario and USD/CAD declined to our initial downside target yesterday. Although the pair rebounded slightly earlier today, we think that as long as there won’t be a comeback above the lower line of the very short-term purple declining trend channel another attempt to move lower is likely. If this is the case, the next downside target for currency bears would be the purple, dashed support line based on the Sep and Oct lows (currently around 1.3207) or even the 50% Fibonacci retracement around 1.3174.
Very short-term outlook: mixed with bearish bias
Short-term outlook: mixed
MT outlook: mixed
LT outlook: mixed
Trading position (short-term; our opinion): No positions are justified from the risk/reward perspective. We will keep you informed should anything change, or should we see a confirmation/invalidation of the above.
USD/CHF
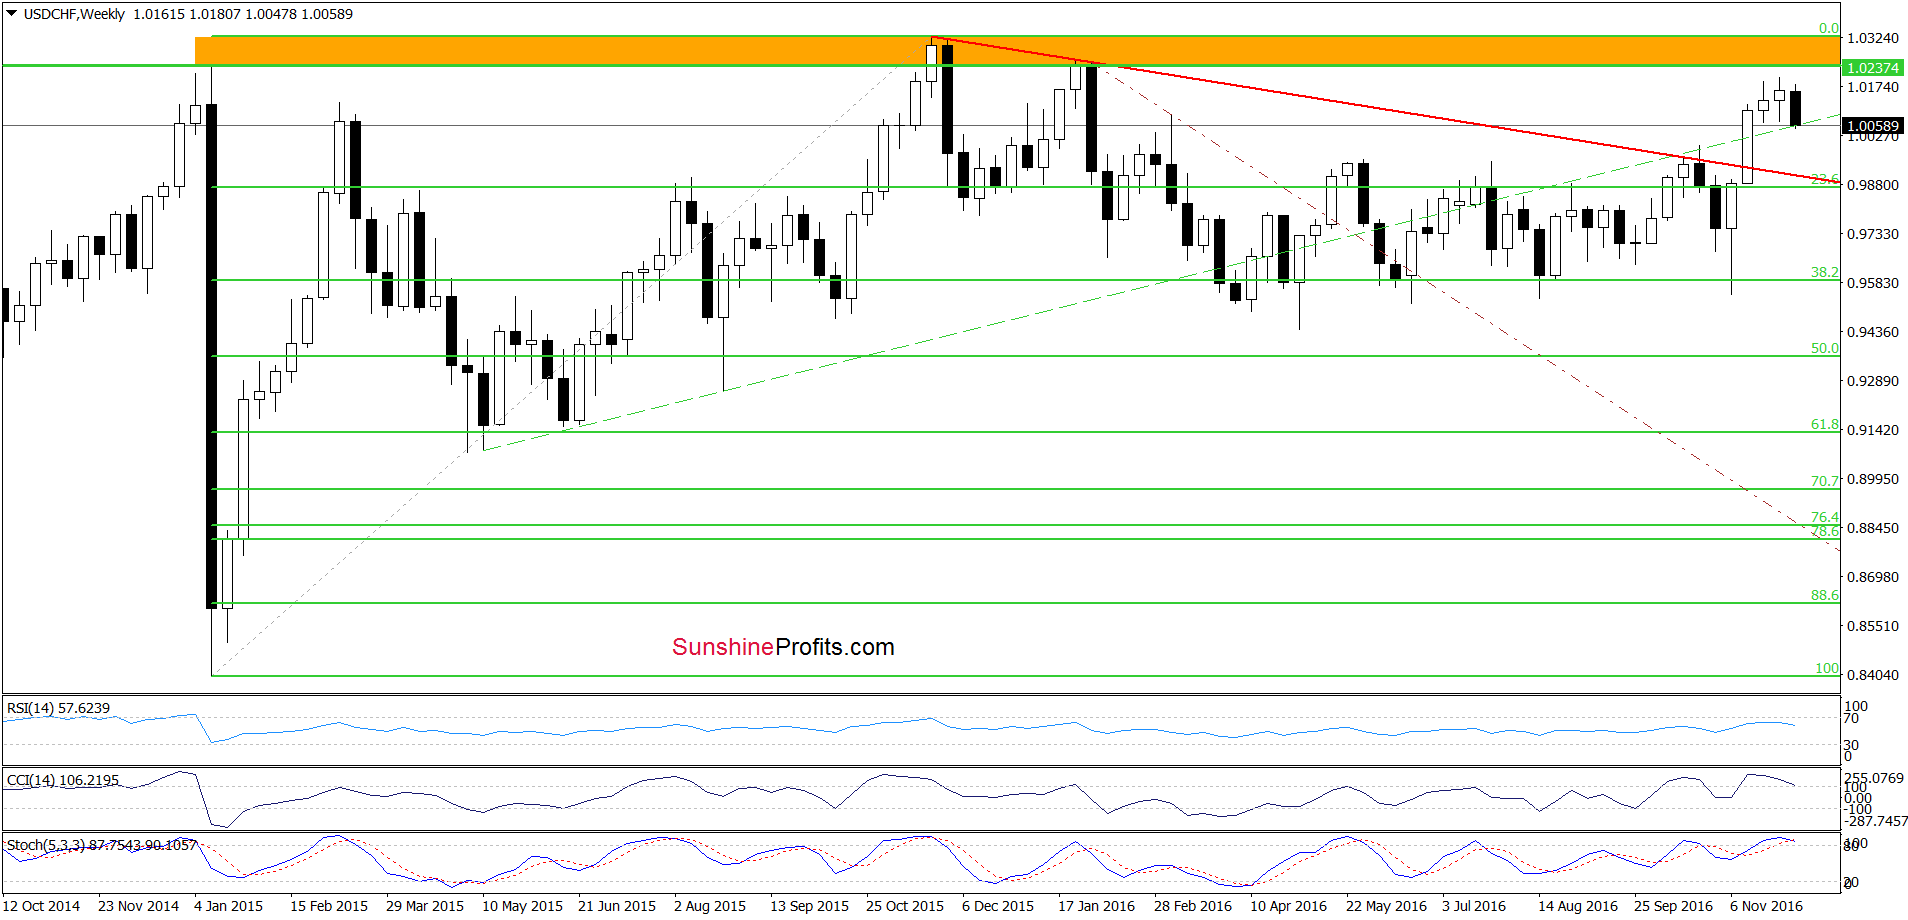
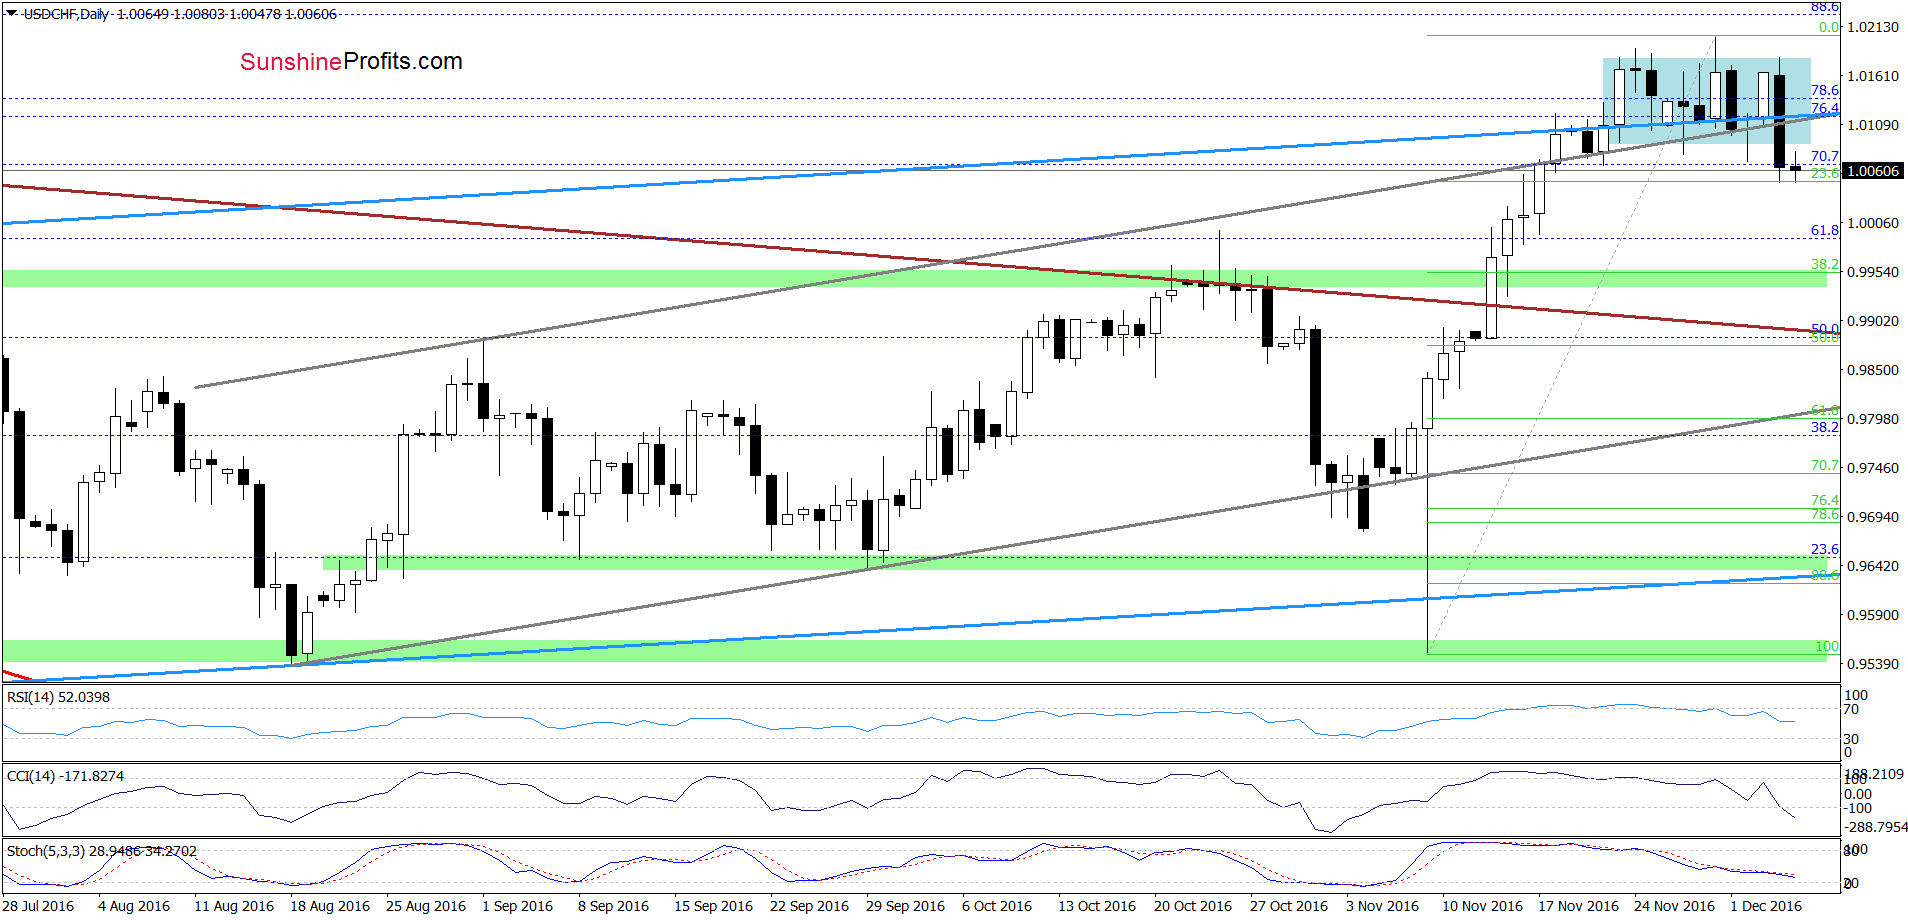
Quoting our yesterday’s alert:
(…) currency bears (…) pushed the exchange rate lower, which resulted in a decline under the previously-broken upper border of the grey rising trend channel. This is a negative signal, which suggests further deterioration. However, in our opinion, lower values of USD/CHF would be more if the pair closes today’s or one of the following days below the grey support/resistance line.
As you see USD/CHF declined sharply and closed yesterday’s session under the upper border of the grey rising trend channel, which doesn’t bode well for the exchange rate – especially when we factor in sell signals generated by the indicators. However, with Monday’s drop the pair slipped to the first Fibonacci retracement (23.6%), which could trigger a rebound to the previously-broken upper lines of rising trend channels in the coming day(s). Nevertheless, as long as there won’t be a comeback above them all upswings would be nothing more than a verification of yesterday’s breakdowns. If this is the case, we’ll likely see further deterioration - even to the green support line based on the May, Jun and Oct highs and reinforced by the 38.2% Fibonacci retracement based on the recent rally.
Very short-term outlook: mixed with bearish bias
Short-term outlook: mixed
MT outlook: mixed
LT outlook: mixed
Trading position (short-term; our opinion): No positions are justified from the risk/reward perspective. We will keep you informed should anything change, or should we see a confirmation/invalidation of the above.
AUD/USD

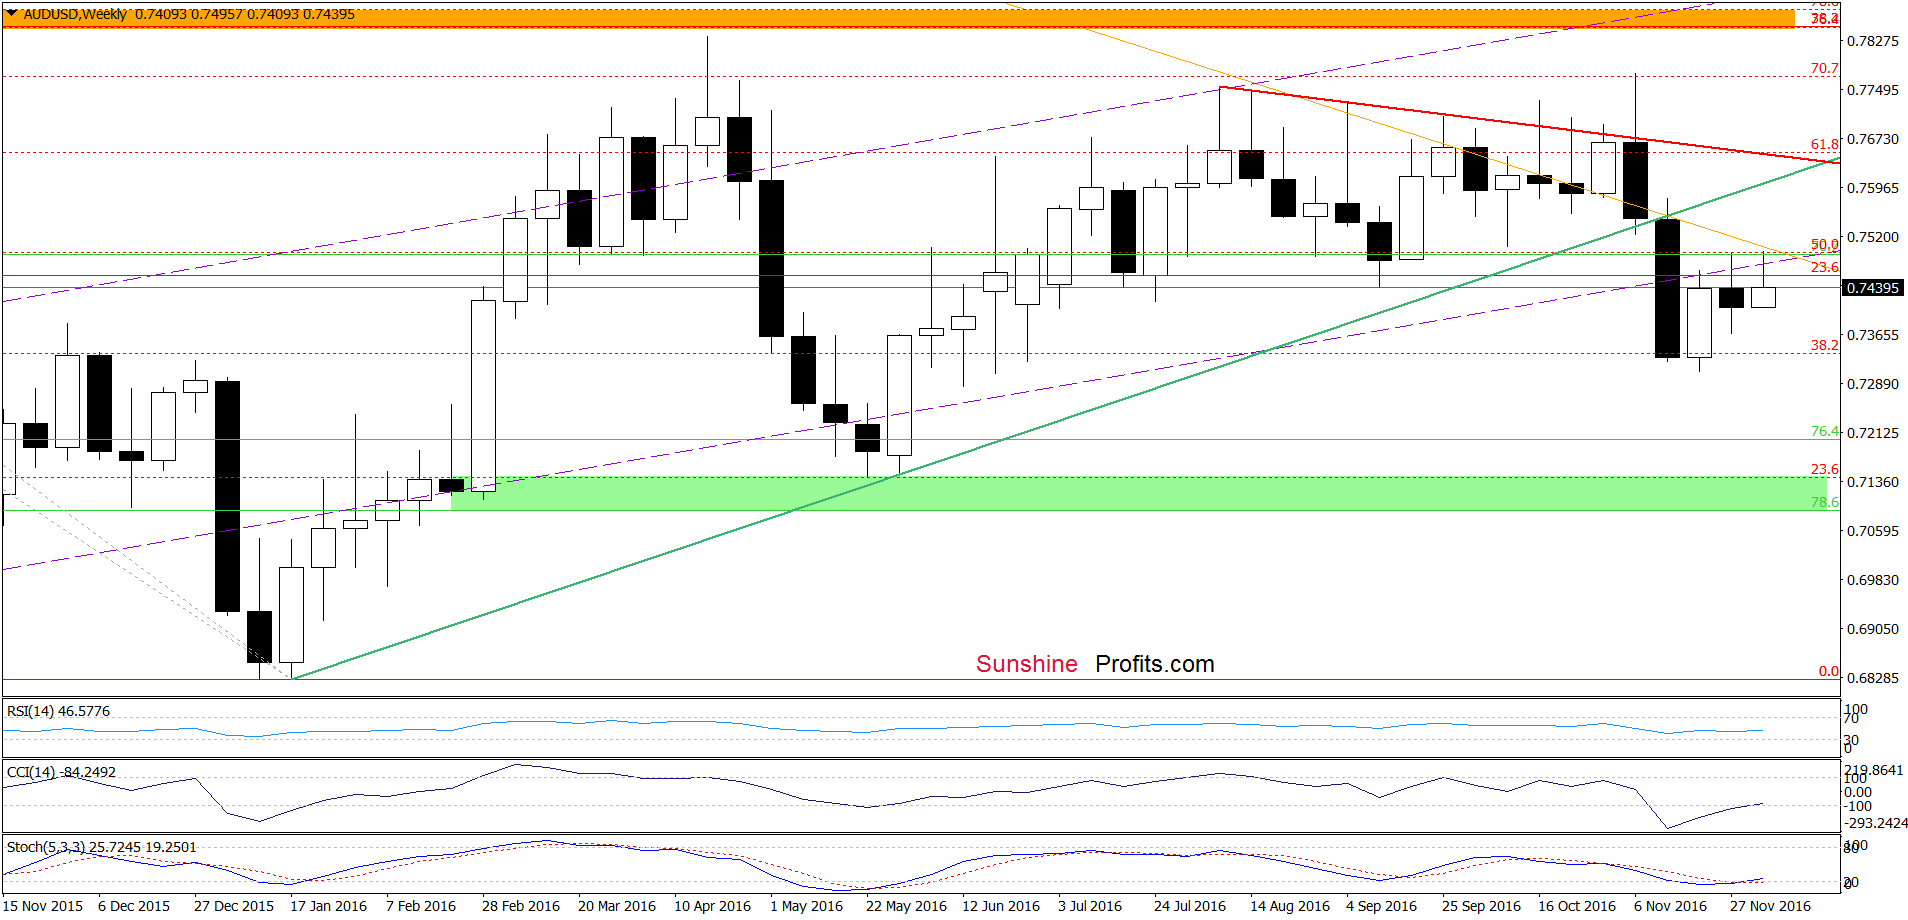
On Friday, we wrote:
(…) currency bears pushed AUD/USD sharply lower, which approached the exchange rate to our downside target. Despite Wednesday’s decline, the pair rebounded and erased most of this move, which suggests a re-test of the recent highs in the coming days.
From today’s point of view we see that AUD/USD extended gains and reached the recent highs as we had expected. Although this is a positive signal, the 38.2% Fibonacci retracement stopped further improvement three times in the previous week, which suggests that we may see a similar price action in very near future (especially if the Stochastic Oscillator generates a sell signal). In this case, AUD/USD will likely move lower once again and re-test the green support zone (based on the previous lows, which is currently reinforced by the red declining support line) in the coming day(s).
Very short-term outlook: mixed with bearish bias
Short-term outlook: mixed
MT outlook: mixed
LT outlook: mixed
Trading position (short-term; our opinion): No positions are justified from the risk/reward perspective. We will keep you informed should anything change, or should we see a confirmation/invalidation of the above.
Thank you.
Nadia Simmons
Forex & Oil Trading Strategist
Przemyslaw Radomski, CFA
Founder, Editor-in-chief, Gold & Silver Fund Manager
Gold & Silver Trading Alerts
Forex Trading Alerts
Oil Investment Updates
Oil Trading Alerts

