

Earlier today, the USD Index extended losses below the level of 99, which pushed USD/CHF under important resistance line and resulted in an invalidation of earlier breakout. What does it mean for the exchange rate?
In our opinion the following forex trading positions are justified - summary:
- EUR/USD: none
- GBP/USD: none
- USD/JPY: none
- USD/CAD: none
- USD/CHF: short (a stop-loss order at 1.0000; initial downside target at 0.9841)
- AUD/USD: short (a stop-loss order at 0.7769; initial downside target at 0.7542)
EUR/USD
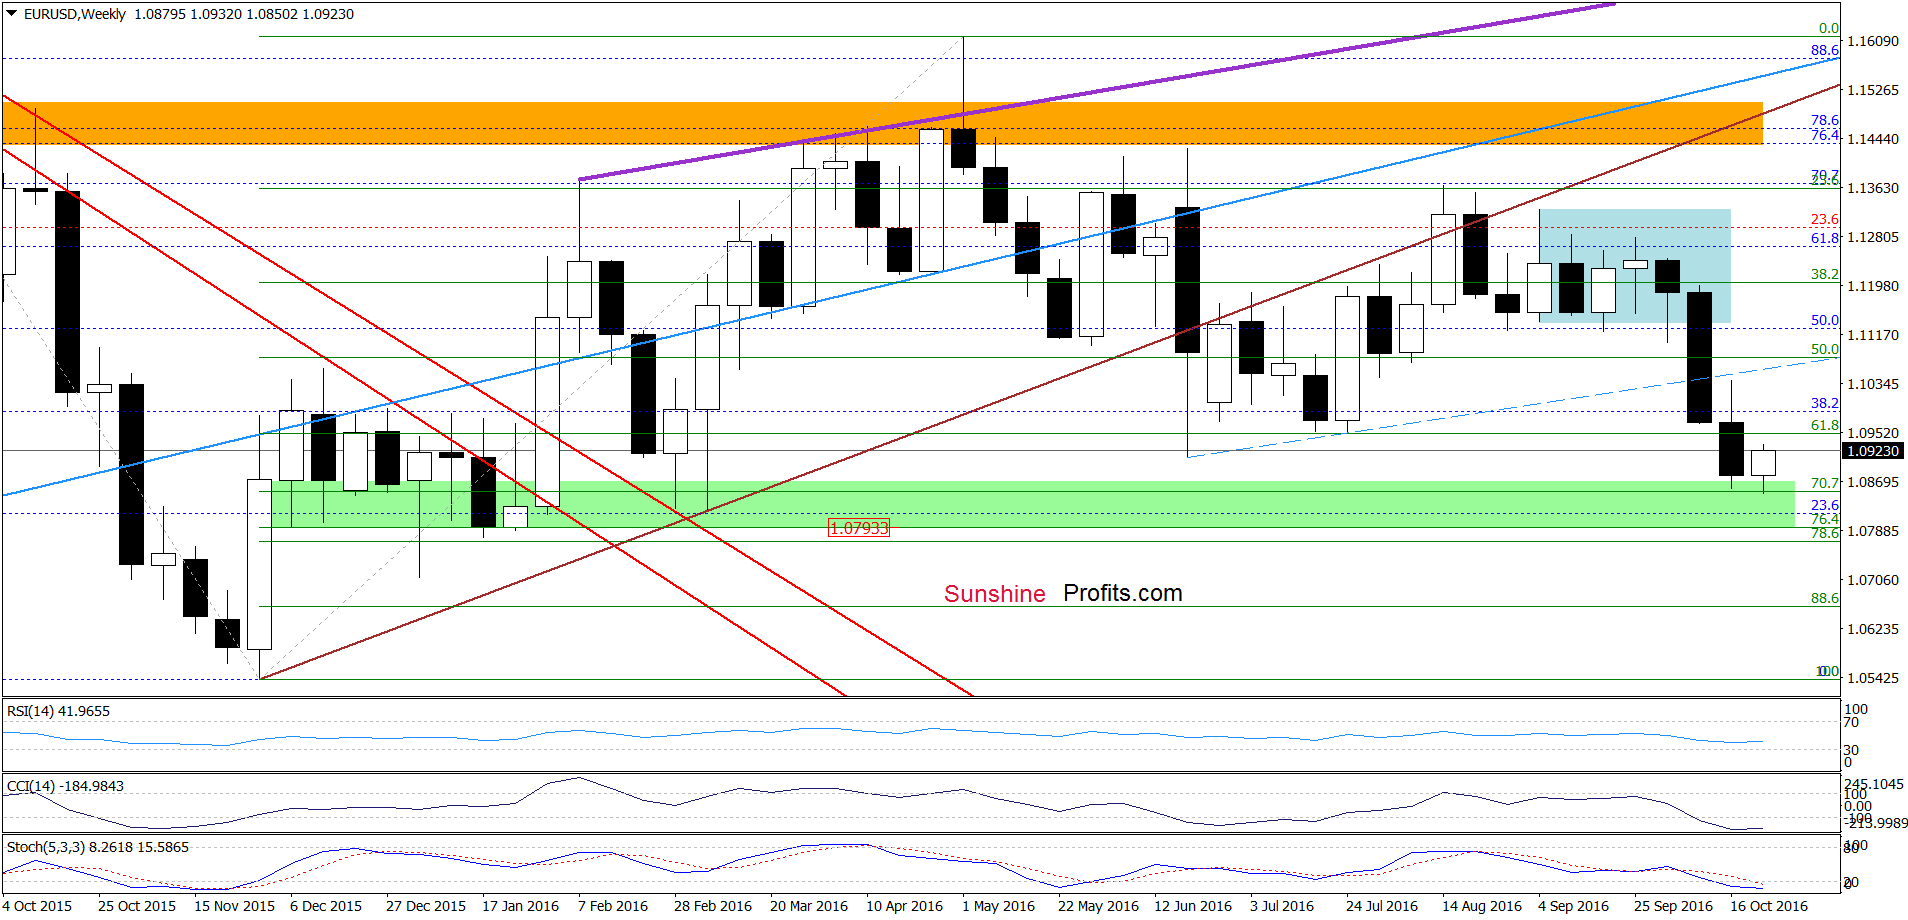
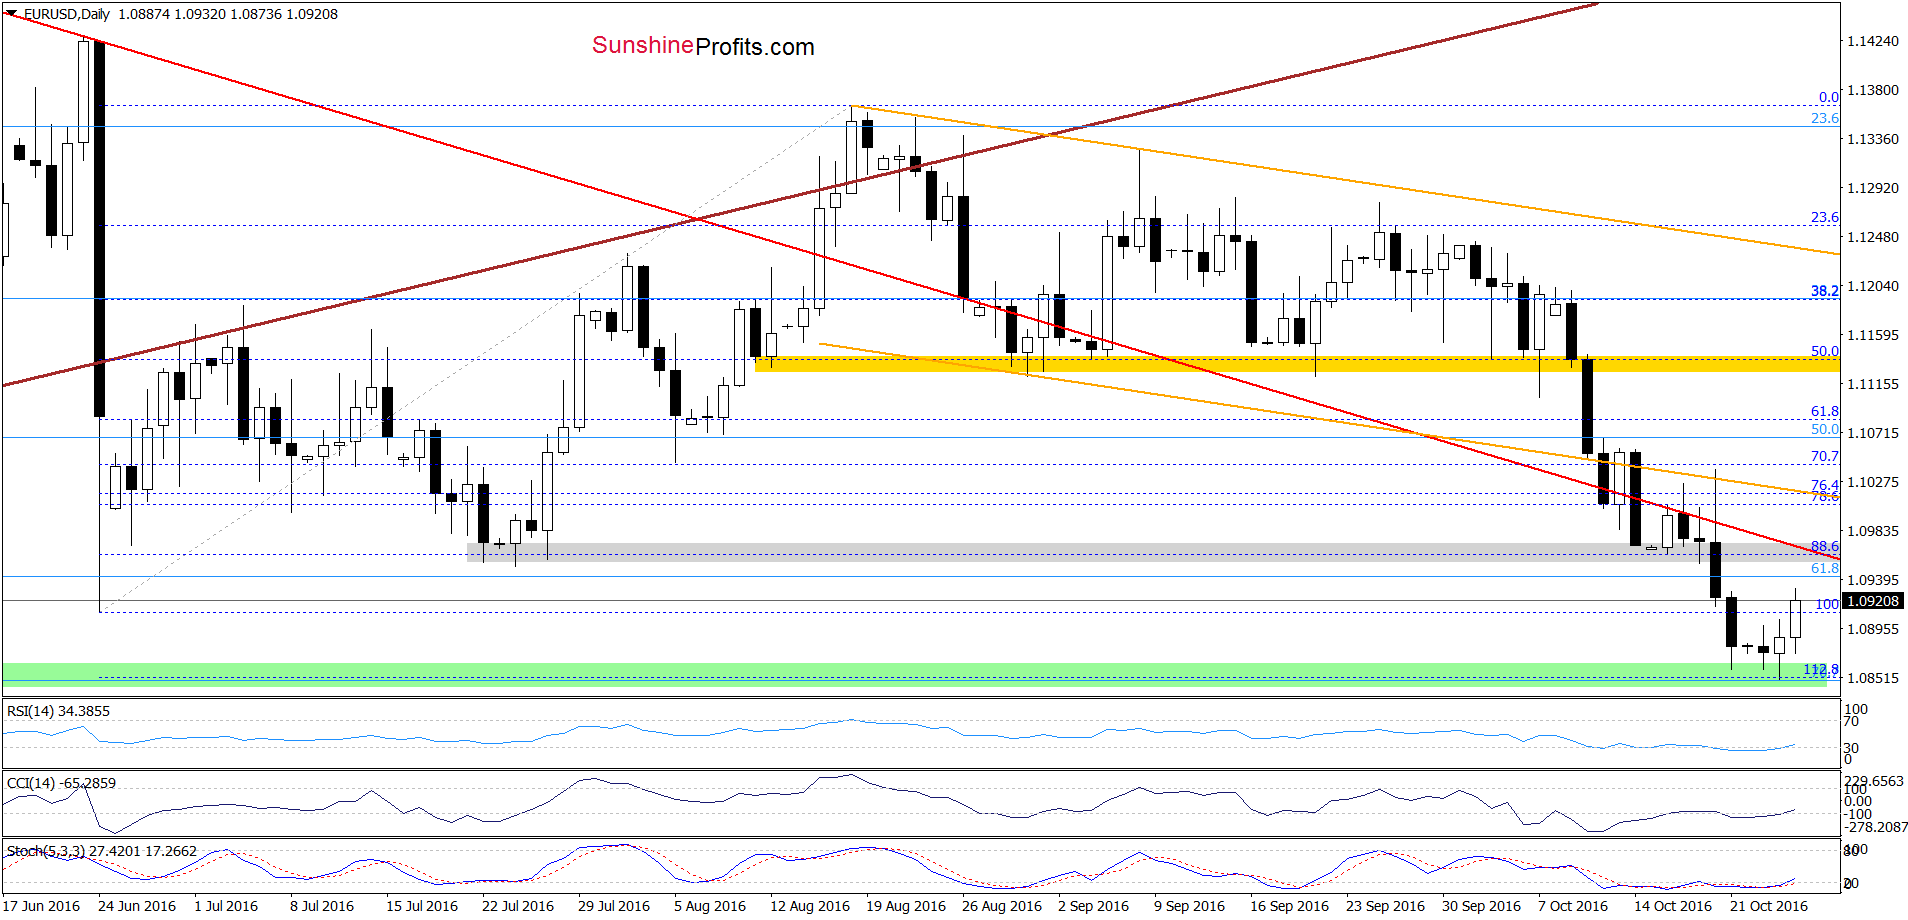
Looking at the daily chart, we see that the green support zone in combination with buy signals generated by all daily indicators encouraged currency bulls to act, which resulted in a rebound above 1.0900. Taking these facts into account, we think that the pair will extend gains and climb to the previously-broken grey zone and the red declining resistance line in the coming days.
Very short-term outlook: bullish
Short-term outlook: mixed
MT outlook: mixed
LT outlook: mixed
Trading position (short-term; our opinion): No positions are justified from the risk/reward perspective. We will keep you informed should anything change, or should we see a confirmation/invalidation of the above.
GBP/USD
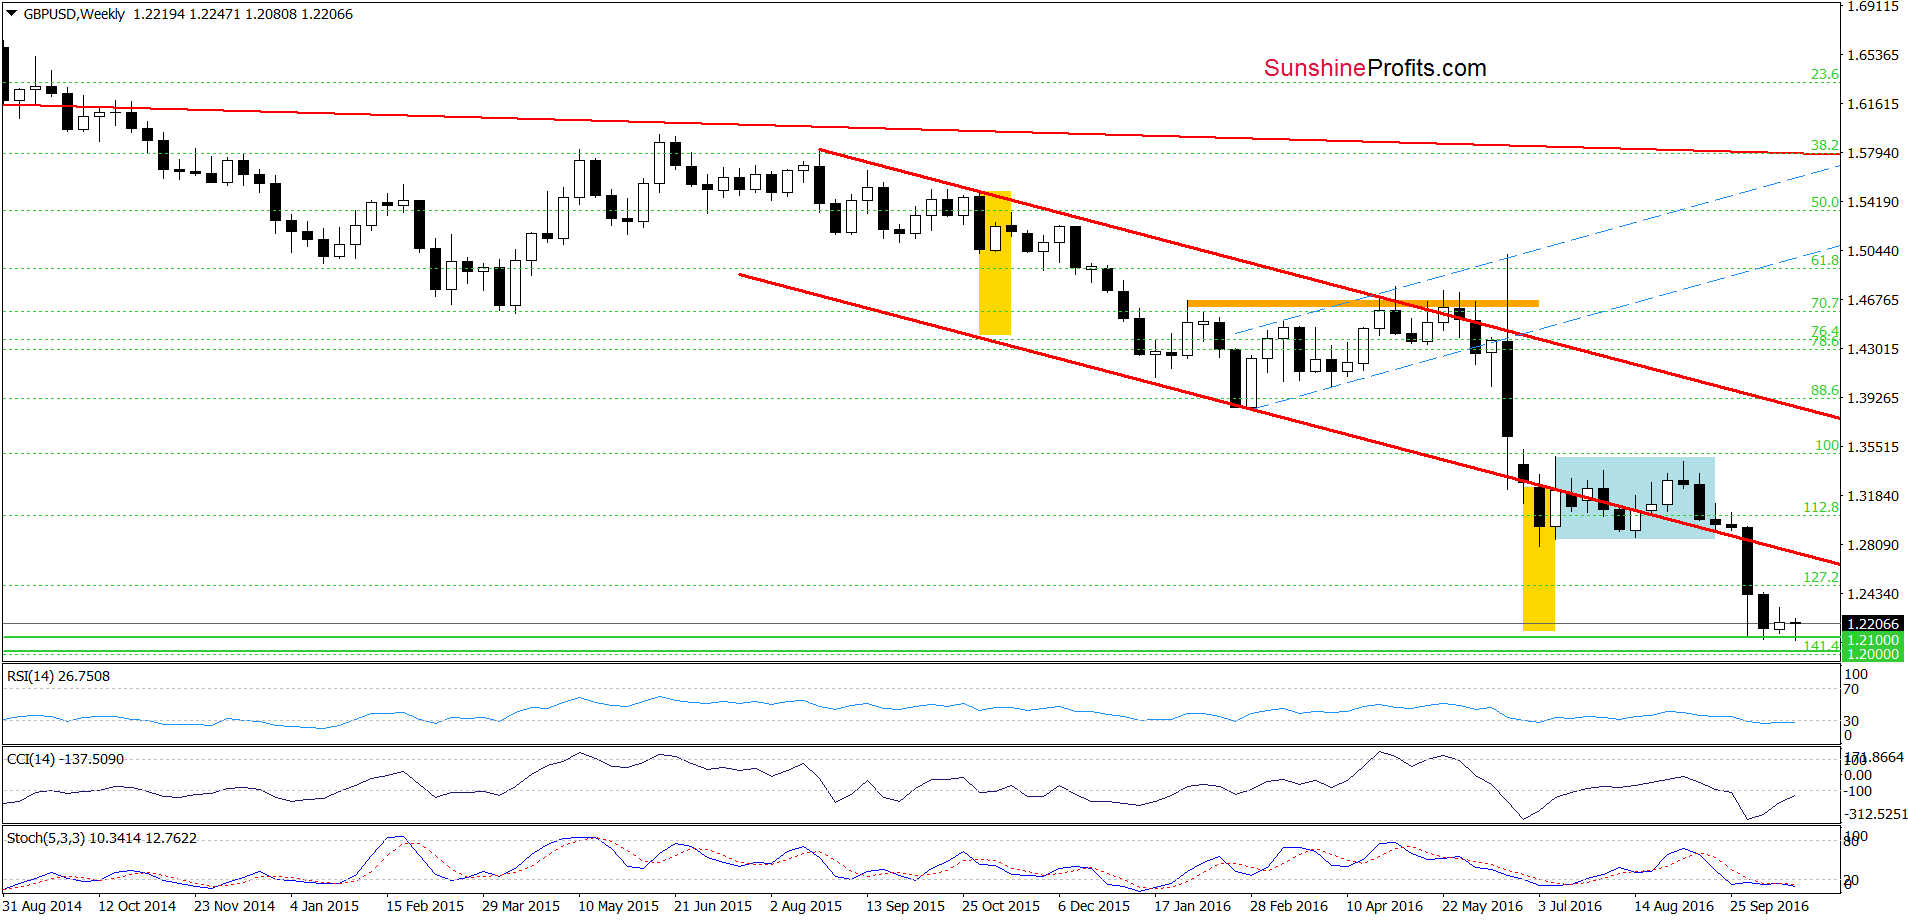
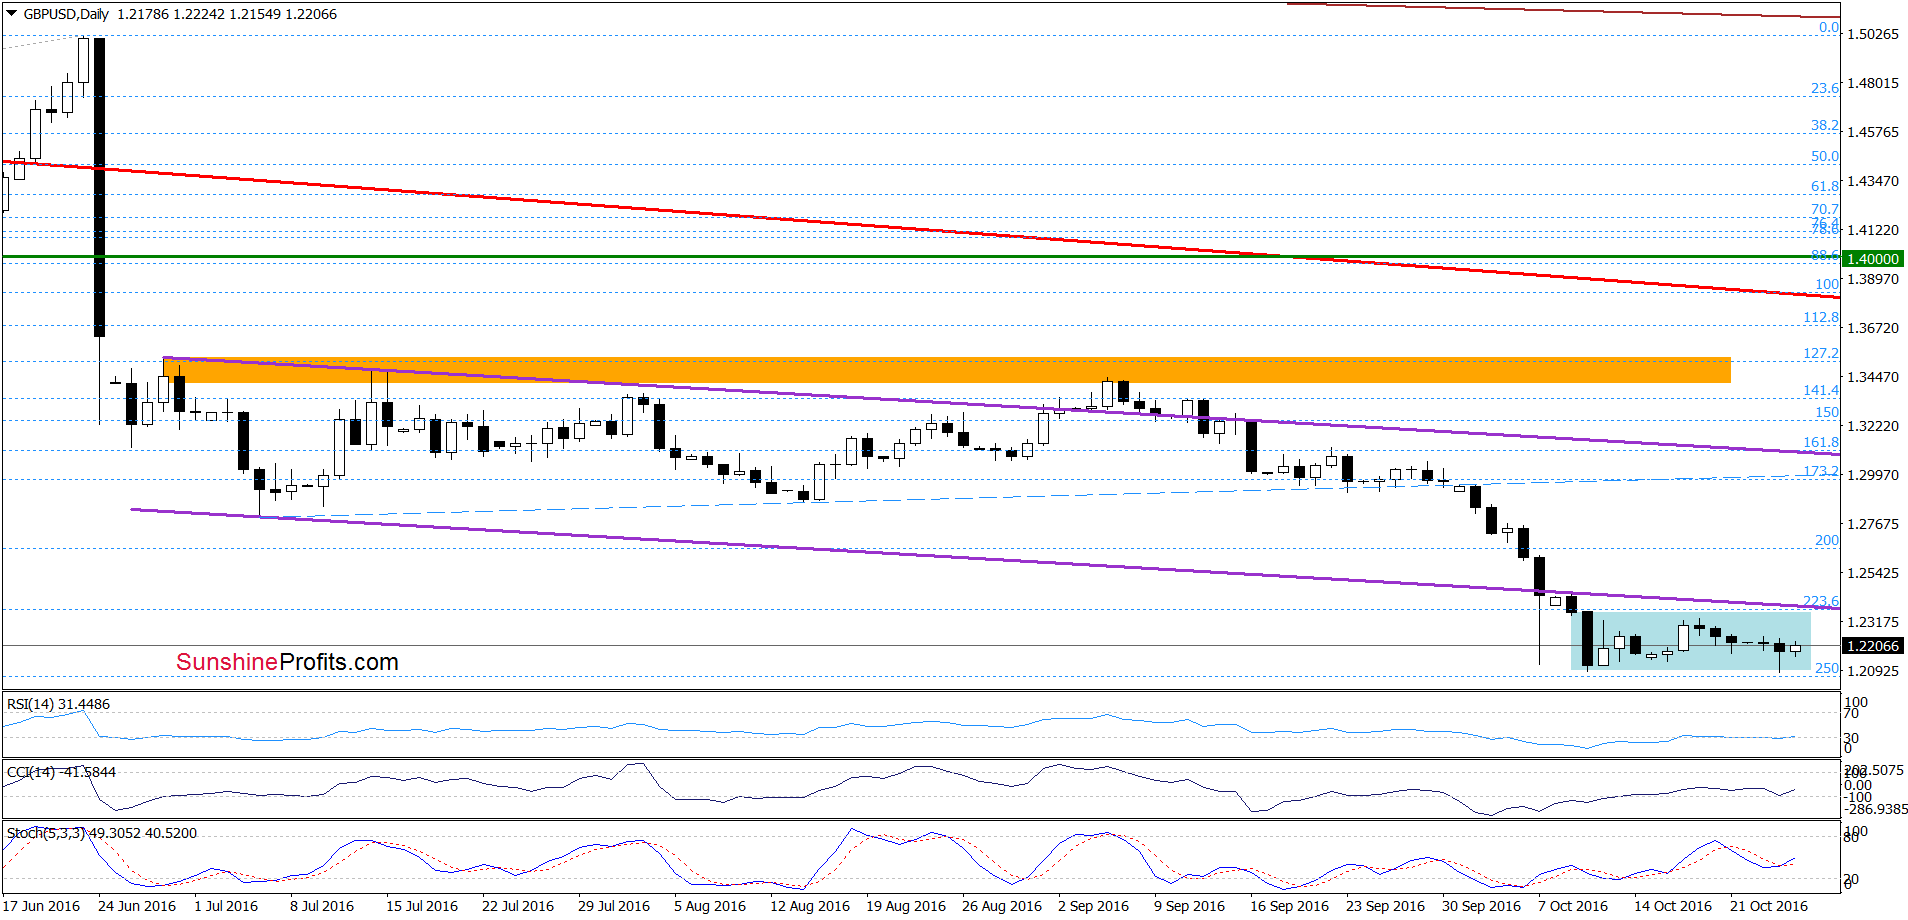
On the daily chart, we see that GBP/USD bounced off the Oct 11 low yesterday, which resulted in further improvement earlier today. Additionally, all daily indicators generated buy signal, which suggests further improvement (and a test of the purple resistance line) in the coming days. Nevertheless, the exchange rate is still trading in a blue consolidation under the previously-broken lower border of the purple declining trend channel, which means that as long as there won’t be a breakout above the upper line of the formation or a breakdown under the lower line, another bigger move is not likely to be seen.
Very short-term outlook: mixed with bullish bias
Short-term outlook: mixed
MT outlook: mixed
LT outlook: bearish
Trading position (short-term; our opinion): No positions are justified from the risk/reward perspective. We will keep you informed should anything change, or should we see a confirmation/invalidation of the above.
USD/CHF
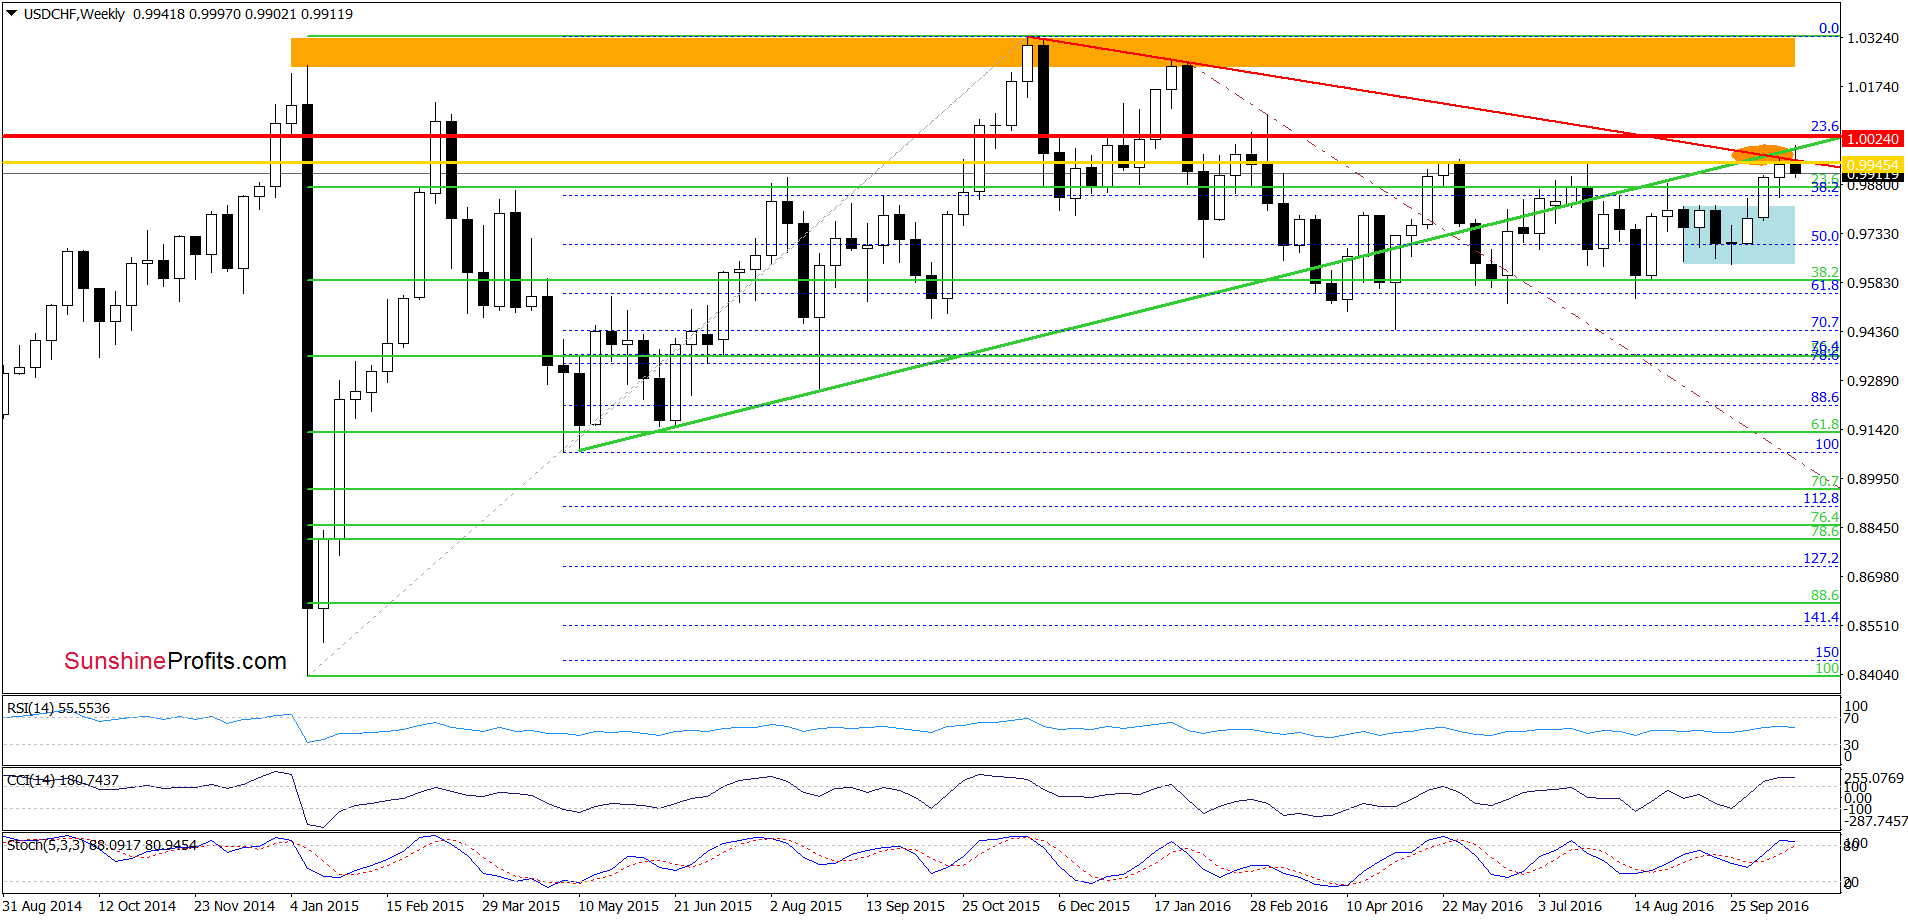
Looking at the weekly chart, we see that the key resistance zone created by the long-term red declining resistance line based on the Nov and Feb highs, the green rising line based on the May and Aug 2015 lows and May and Jul highs (marked with orange ellipse) encouraged currency bears to act, which resulted in a pullback.
How did this move affect the very short-term picture? Let’s check.
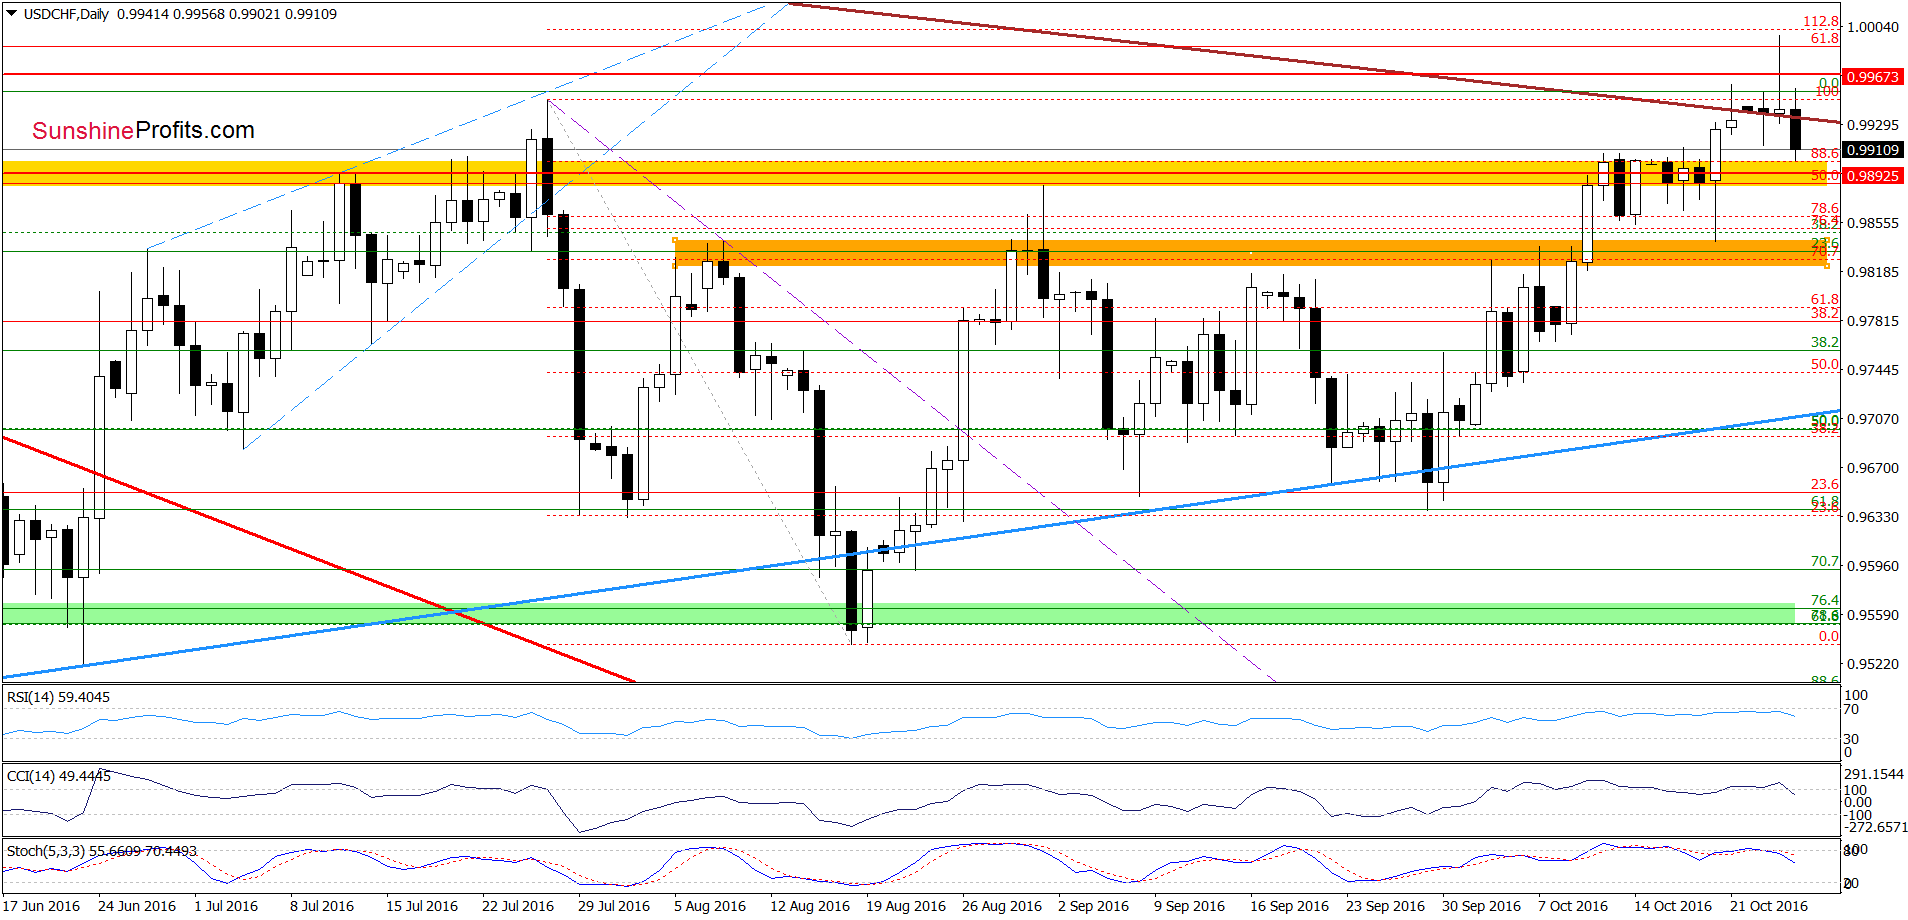
Looking at the daily chart, we see that although USD/CHF moved sharply higher and broke above the brown resistance line (the red resistance line seen on the weekly chart), this improvement was only temporary and the exchange rate came back under this line earlier today, invalidating yesterday’s breakout. Additionally, the CCI and Stochastic Oscillator generated sell signals, which in combination with the above and the medium-term picture suggests further deterioration in the coming week. Therefore, if the pair moves lower from current levels the initial downside target would be around 0.9841, where the last Thursday’s low is.
Very short-term outlook: bearish
Short-term outlook: mixed with bearish bias
MT outlook: mixed
LT outlook: mixed
Trading position (short-term; our opinion): Short positions (with a stop-loss order at 1.0000 and initial downside target at 0.9841) are justified from the risk/reward perspective. We will keep you informed should anything change, or should we see a confirmation/invalidation of the above.
Thank you.
Nadia Simmons
Forex & Oil Trading Strategist
Przemyslaw Radomski, CFA
Founder, Editor-in-chief, Gold & Silver Fund Manager
Gold & Silver Trading Alerts
Forex Trading Alerts
Oil Investment Updates
Oil Trading Alerts

