

Although official data showed that the German Ifo Business Climate Index increased to 110.5 in Oct, beating analysts’ forecasts, EUR/USD remains around its seven-month lows as hopes for a U.S. rate hike before the end of the year kept the U.S. currency around recent highs. Where will the exchange rate head next?
In our opinion the following forex trading positions are justified - summary:
- EUR/USD: none
- GBP/USD: none
- USD/JPY: short (a stop-loss order at 104.84; initial downside target at 101.02)
- USD/CAD: none
- USD/CHF: short (a stop-loss order at 1.0000; initial downside target at 0.9841)
- AUD/USD: short (a stop-loss order at 0.7769; initial downside target at 0.7542)
EUR/USD
Quoting our previous alert:
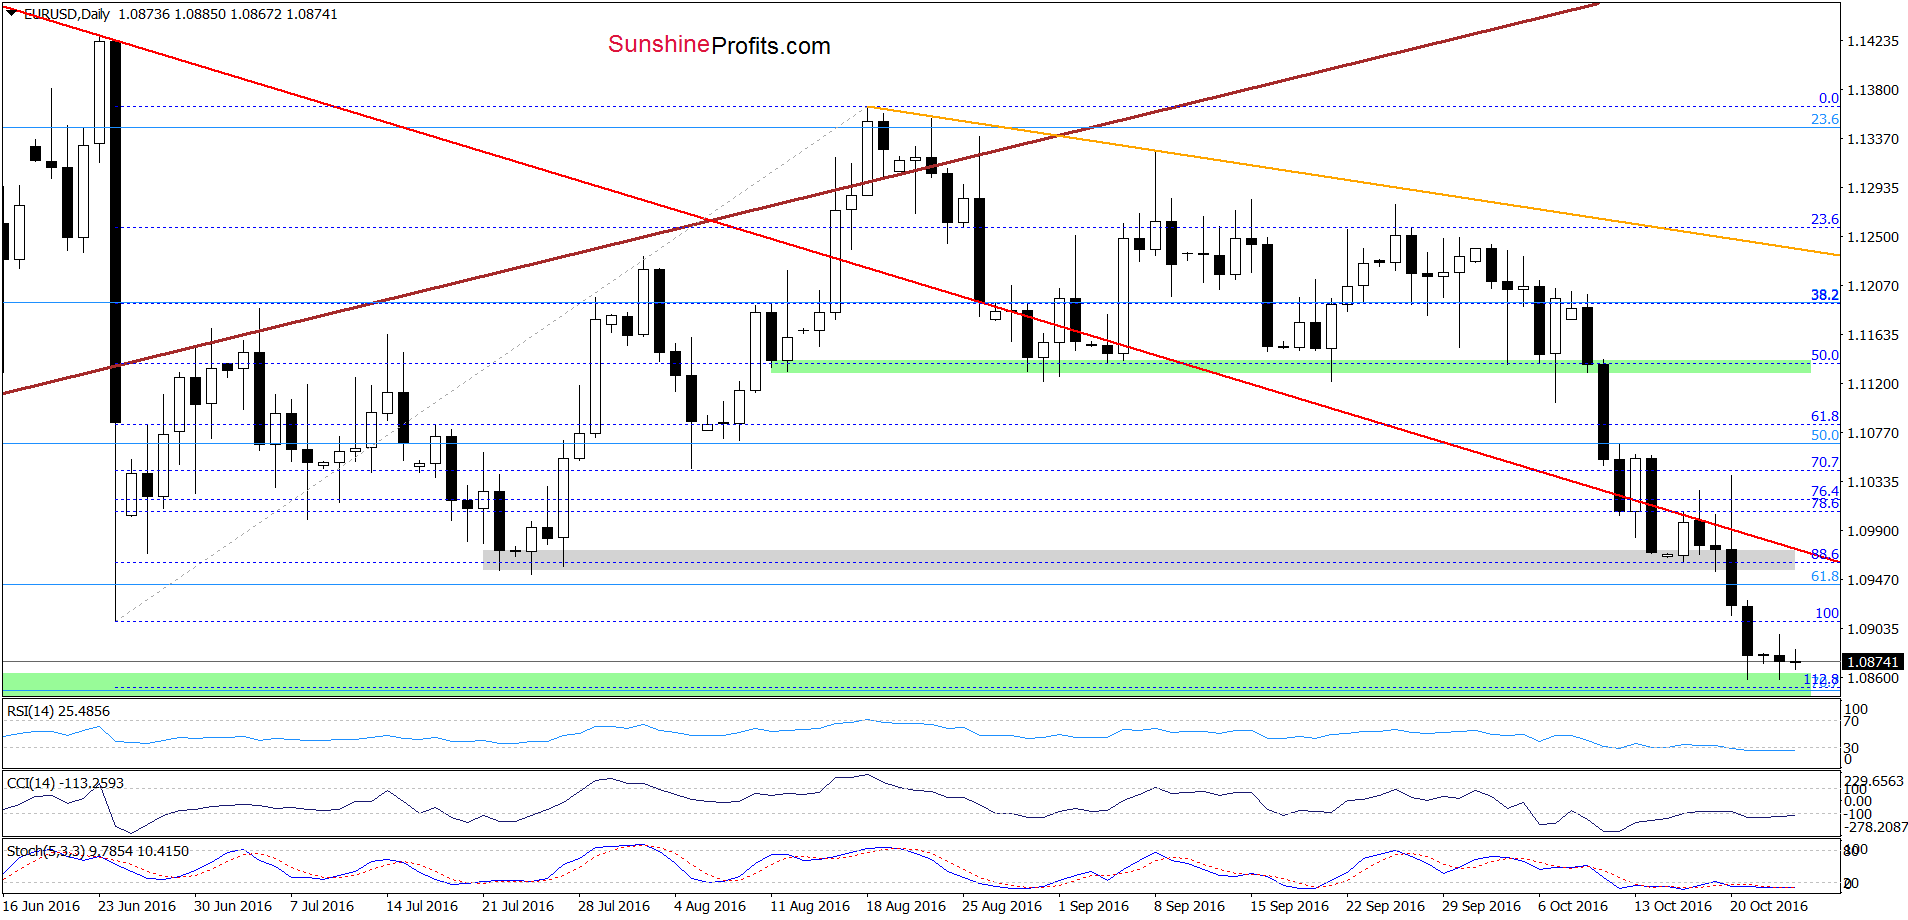
(…) as long as the exchange rate is trading under the grey zone (marked on the daily chart, which serves as the nearest resistance) another attempt to move lower and a re-test of the green zone can’t be ruled out (especially when we factor in the fact that there are no buy signals at the moment of writing these words).
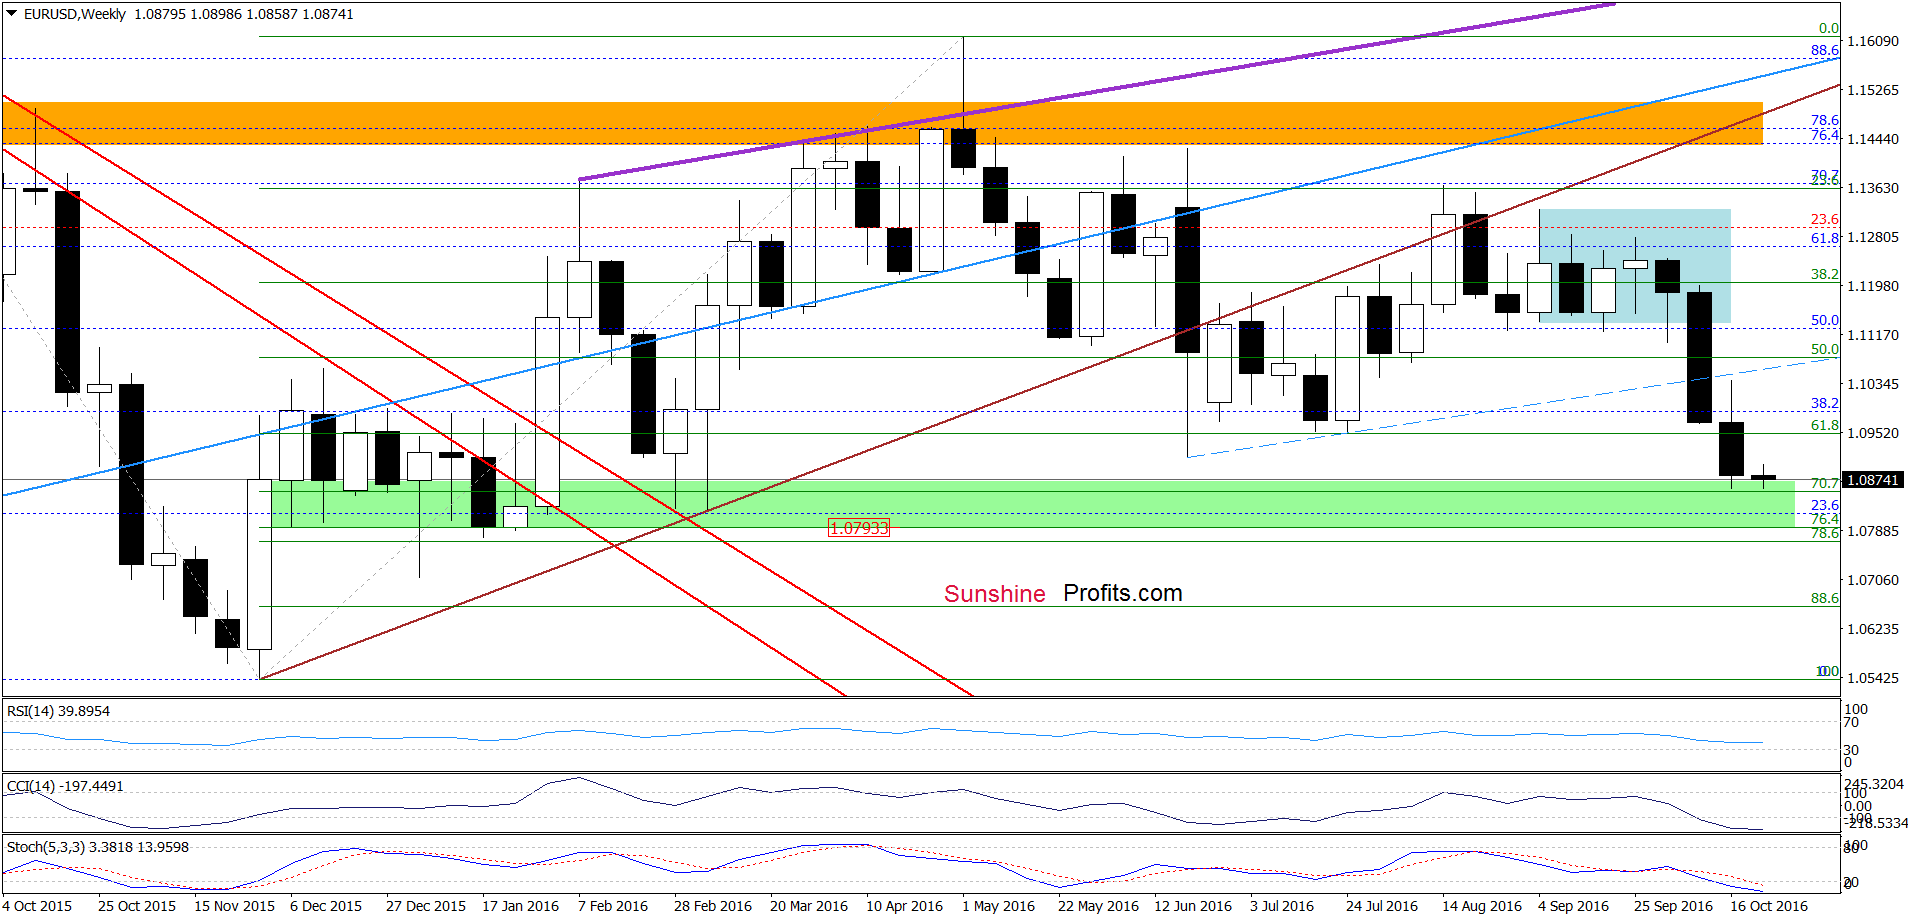
Looking at the daily chart, we see that although EUR/USD rebounded slightly yesterday, this improvement was very temporary and currency bears pushed the pair lower once again. Earlier today, the situation hasn’t changed much as the exchange rate is trading around yesterday’s closing price. This means that another downswing and a test of the late-Feb and Mar lows (or even the lower border of the green zone around 1.0793 marked on the weekly chart) are likely (nevertheless, the current position of the daily indicators suggests that the space for declines may be limited and reversal later this week should not surprise us).
At this point it is also worth mentioning what could happen if the green zone is broken:
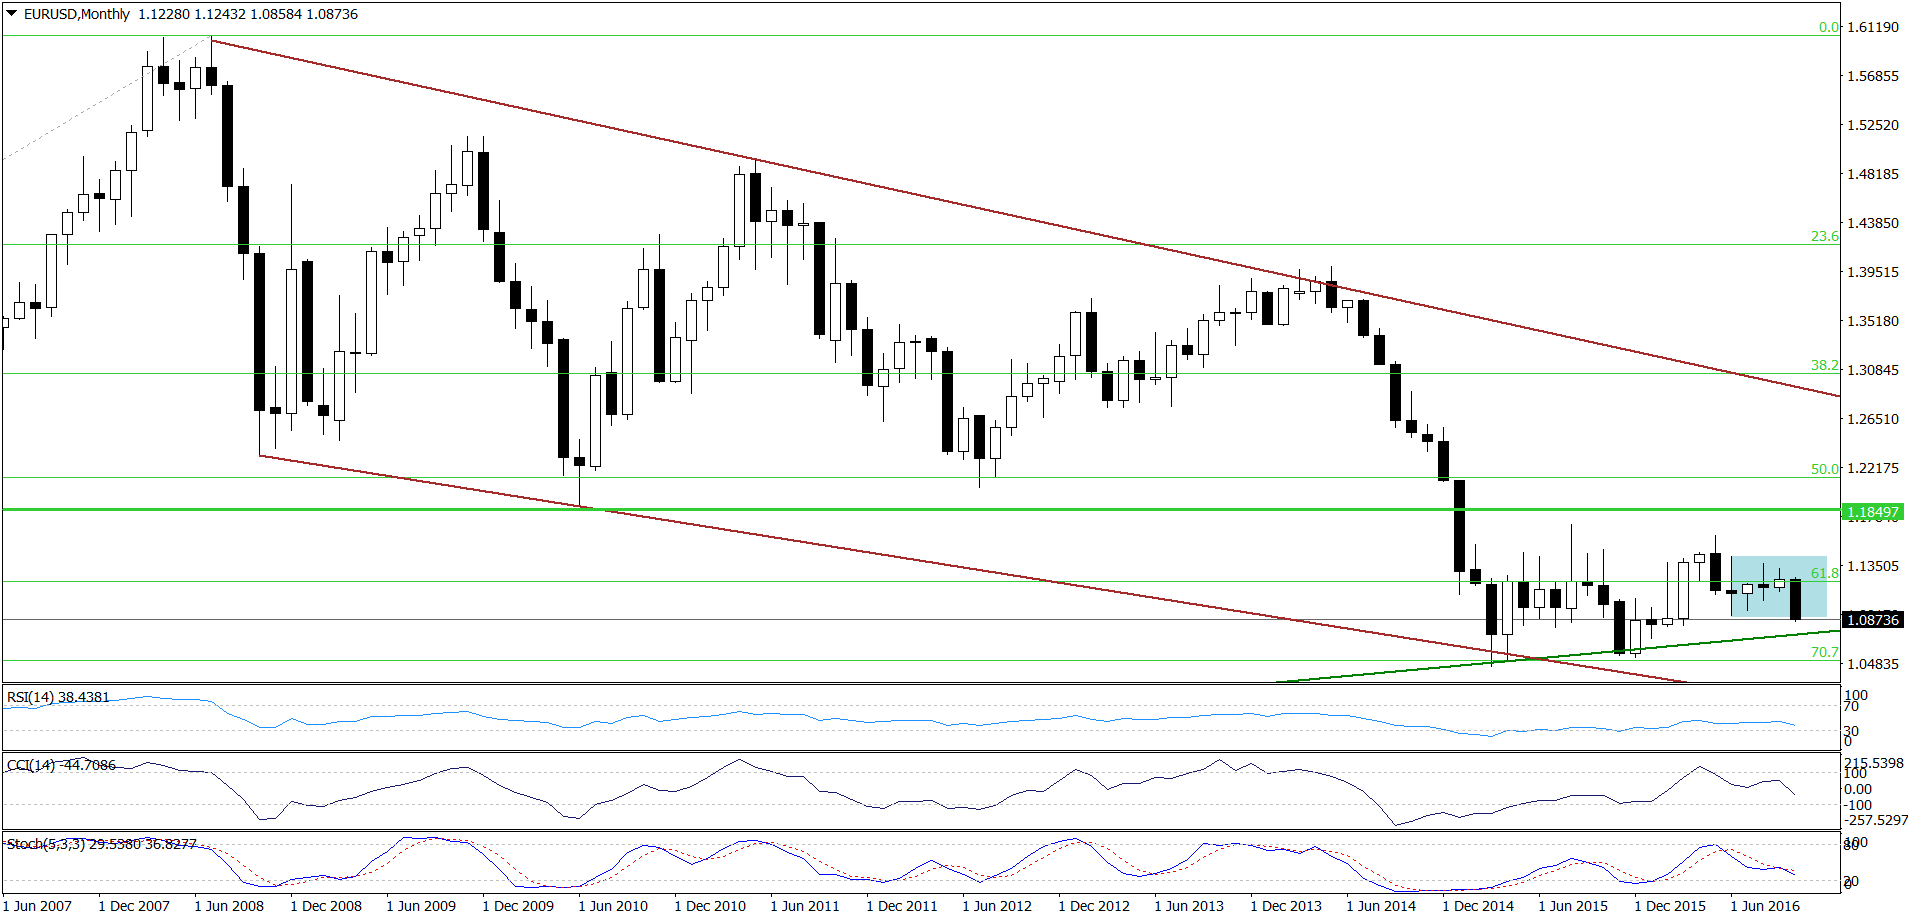
(…) EUR/USD will likely re-test the strength of the long-term green support line (…) this key support line was strong enough to stop currency bears in Mar, Apr, Nov and Dec 2015, which suggests that we may see similar price action in the coming week.
Very short-term outlook: mixed
Short-term outlook: mixed
MT outlook: mixed
LT outlook: mixed
Trading position (short-term; our opinion): No positions are justified from the risk/reward perspective. We will keep you informed should anything change, or should we see a confirmation/invalidation of the above.
USD/JPY
The situation in the long- and medium term hasn’t changed much as the exchange rate remains above the green support zone and the green support line based on the Jun and Aug lows. Today, we’ll focus on the very short-term changes.
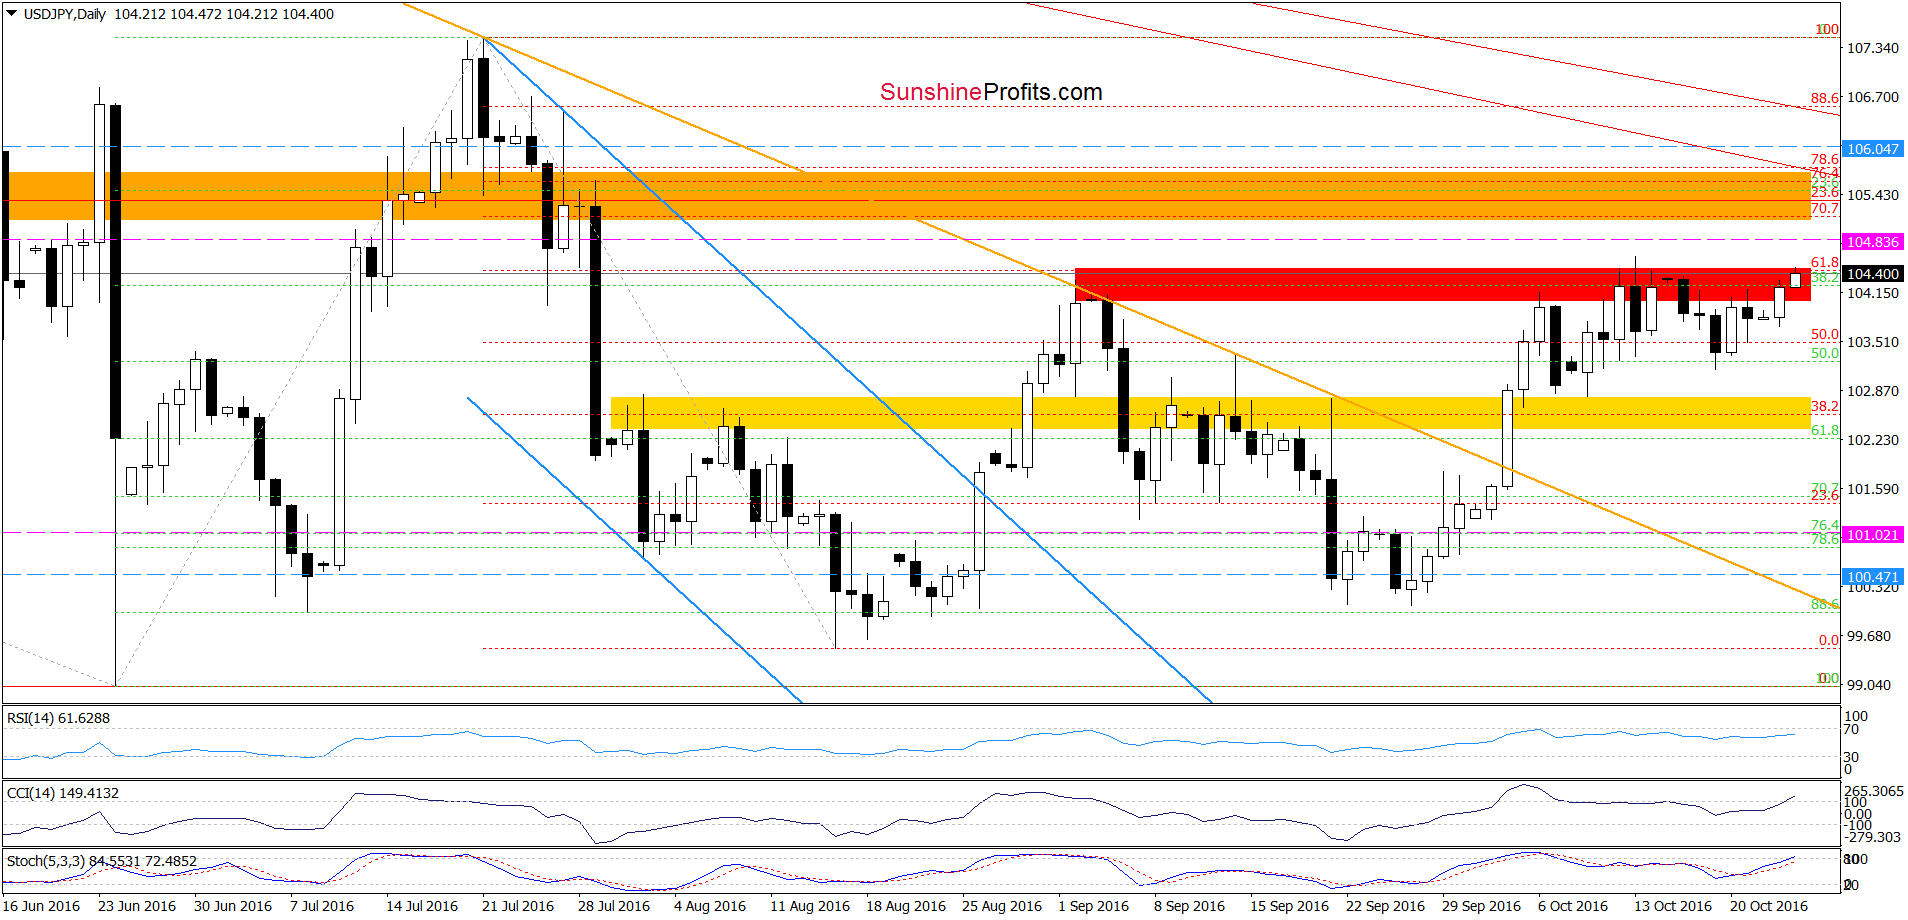
Earlier today, USD/JPY extended gains and climbed above yesterday’s high. Did this upswing change anything in the very short-term picture? Not really, because despite this increase, the exchange rate remains under the Oct high and the 61.8% Fibonacci retracement, which suggests that another downswing and a test of the yellow zone is very likely.
Very short-term outlook: bearish
Short-term outlook: mixed with bearish bias
MT outlook: mixed
LT outlook: mixed
Trading position (short-term; our opinion): Short positions (with a stop-loss order at 104.84 and initial downside target at 101.02) are justified from the risk/reward perspective. We will keep you informed should anything change, or should we see a confirmation/invalidation of the above.
USD/CAD
Yesterday, we wrote the following:
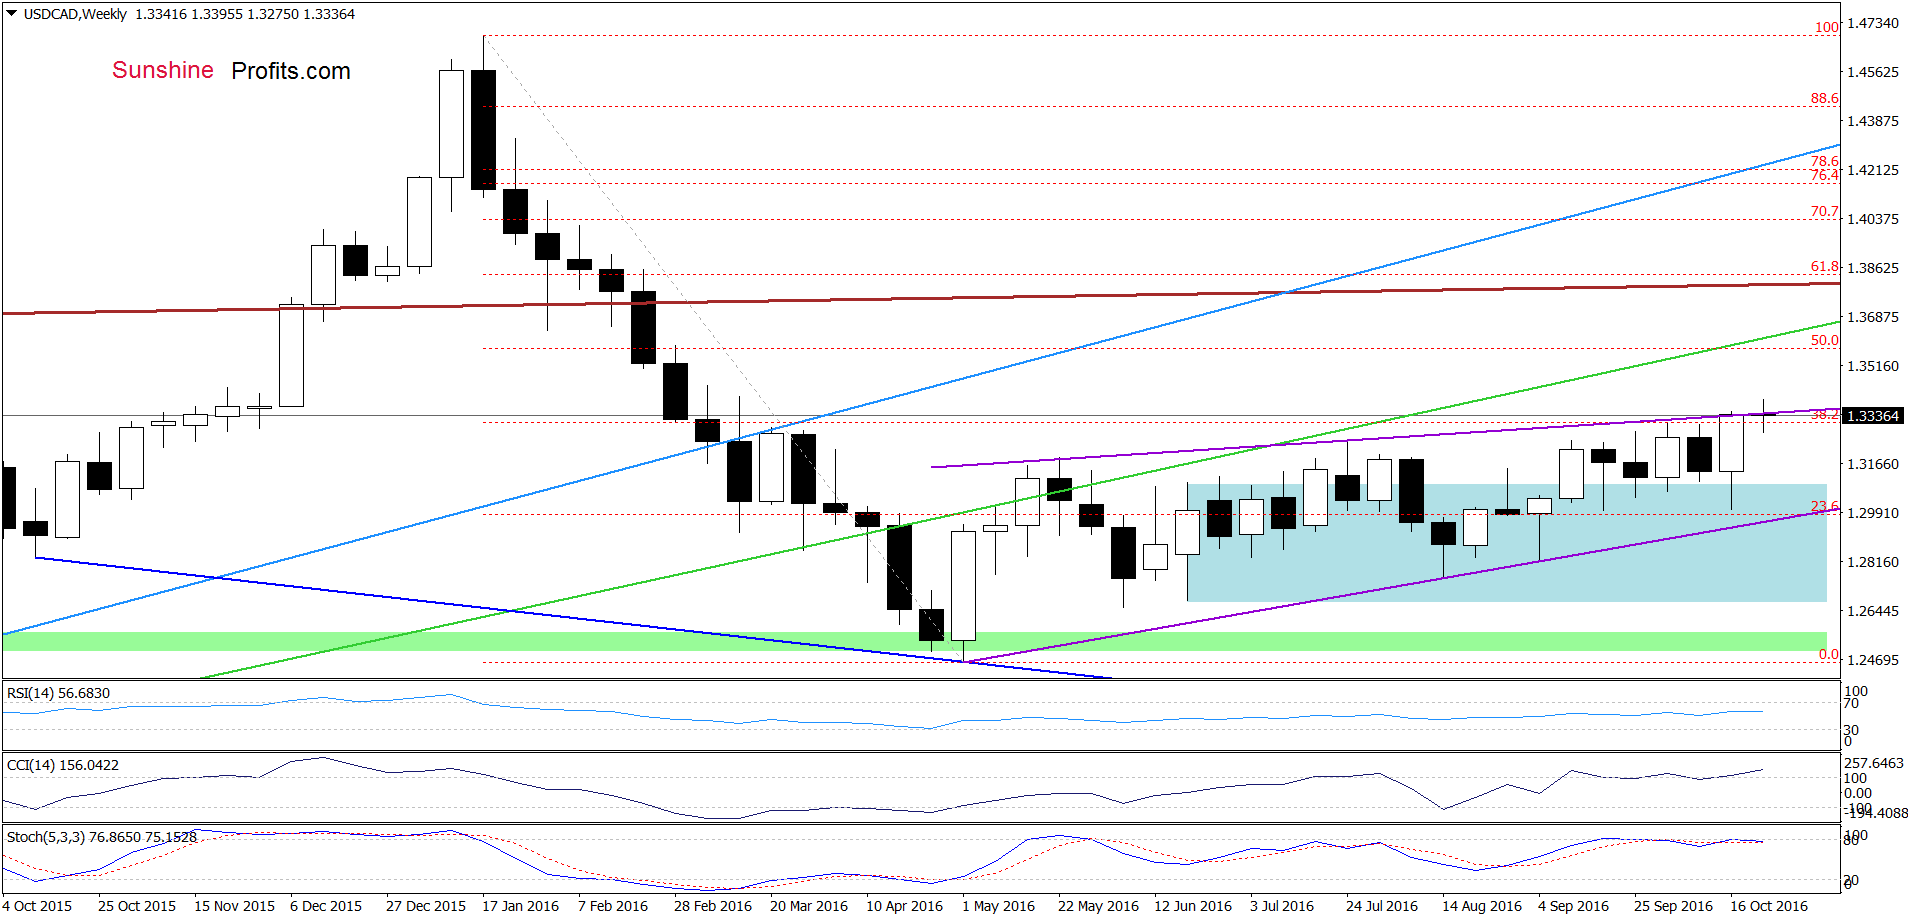
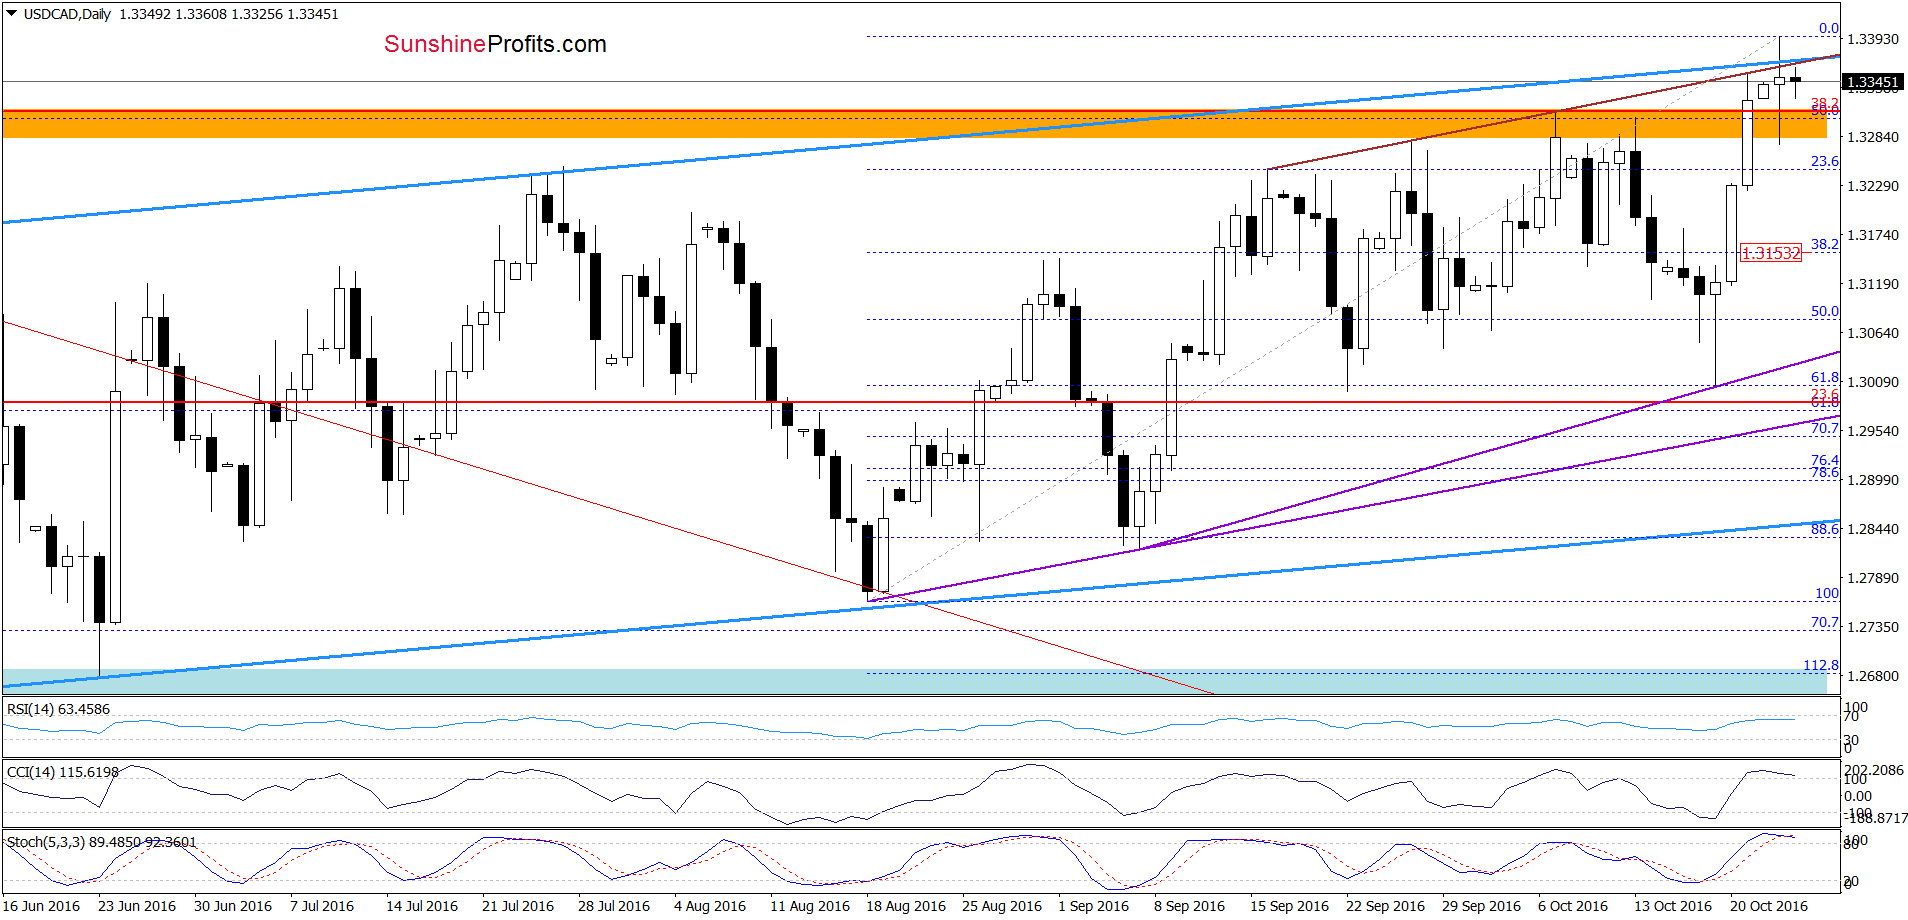
(…) although USD/CAD broke above the orange resistance area, the pair reached a strong resistance zone created by the upper border of the purple rising wedge (marked on the weekly chart), the upper line of the blue rising trend channel (seen on the daily chart) and the 38.2% Fibonacci retracement based on the entire Jan-May downward move. Taking this fact into account and combining it with the current position of the weekly and daily indicators (in both cases, the CCI and Stochastic Oscillator are already overbought), we think that reversal and lower values of the exchange rate are just around the corner.
From today’s point of view, we see that the situation developed in line with our assumptions and the above-mentioned resistance area encouraged currency bears to act. As a result, USD/CAD invalidated earlier small breakout above resistance lines and closed the day below them, which doesn’t bode well for further rally – especially when we factor in the current position of the weekly and daily indicators. Therefore, in our opinion, another attempt to move lower is very likely. If this is the case, and the pair declines from current levels, the initial downside target would be around 1.3153, where the 38.2% Fibonacci retracement (based on the mid-Aug – Oct upward move) is.
Very short-term outlook: mixed with bearish bias
Short-term outlook: mixed with bearish bias
MT outlook: mixed
LT outlook: mixed
Trading position (short-term; our opinion): No positions are justified from the risk/reward perspective. Nevertheless, if we see more bearish developments (like an invalidation of the breakout above the orange zone or sell signals generated by the indicators), we’ll consider re-opening short positions. We will keep you informed should anything change, or should we see a confirmation/invalidation of the above.
Thank you.
Nadia Simmons
Forex & Oil Trading Strategist
Przemyslaw Radomski, CFA
Founder, Editor-in-chief, Gold & Silver Fund Manager
Gold & Silver Trading Alerts
Forex Trading Alerts
Oil Investment Updates
Oil Trading Alerts

