

Earlier today, the Office of National Statistics reported that the U.K. unemployment rate remained steady at 4.9% between June and August, suggesting that the Brexit vote didn’t hit the labor market so far. In this environment, GBP/USD extended gains and climbed above the last Wednesday’s high. But did this move change anything in the overall picture of the exchange rate? What happened at the same tie with our other currency pairs?
In our opinion the following forex trading positions are justified - summary:
- EUR/USD: none
- GBP/USD: none
- USD/JPY: short (a stop-loss order at 104.84; initial downside target at 101.02)
- USD/CAD: short (a stop-loss order at 1.3346; initial downside target at 1.2876)
- USD/CHF: short (a stop-loss order at 0.9954; initial downside target at 0.9778)
- AUD/USD: none
EUR/USD
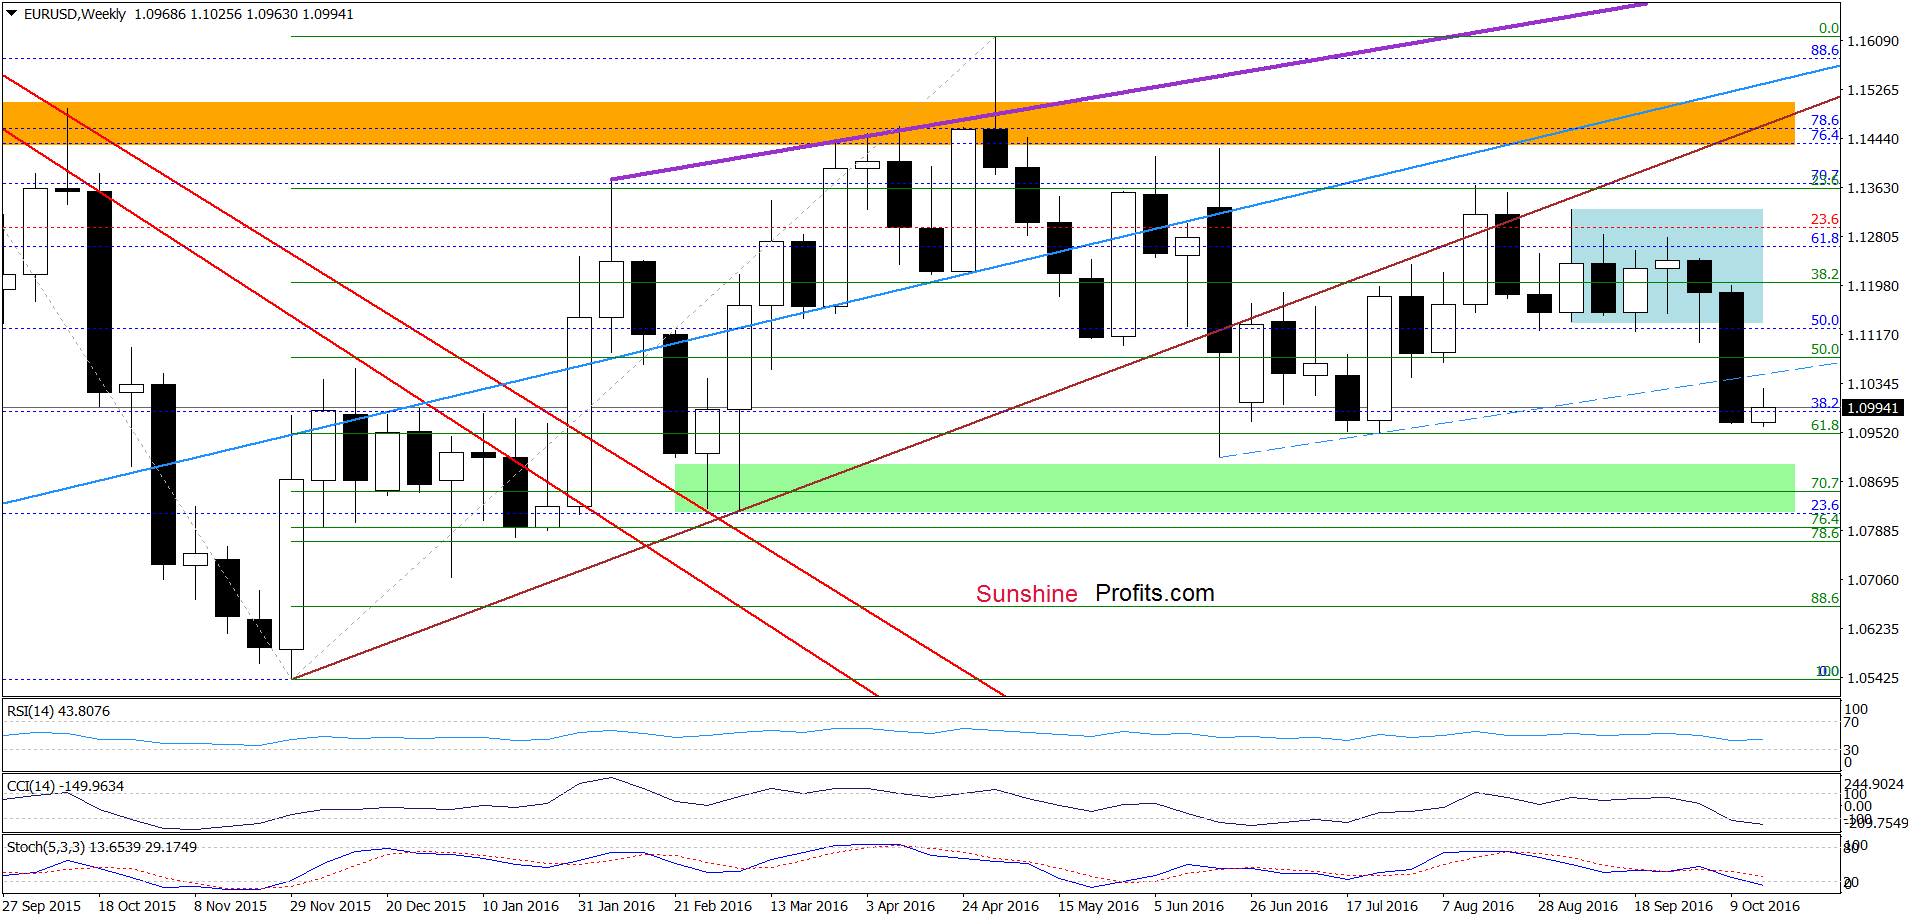
Quoting our previous alert:
(…) the grey support zone encouraged currency bulls to act, which resulted in a rebound and a comeback above the previously-broken red declining line (based on the May and Jun highs). Although this is a positive signal, we think it would be more reliable only if the exchange rate closes today’s or one of the following day’s above this line (an invalidation of the breakdown). Until this time another test of the grey zone is likely – especially when we factor in the fact that the Stochastic Oscillator is still below the level of 20.
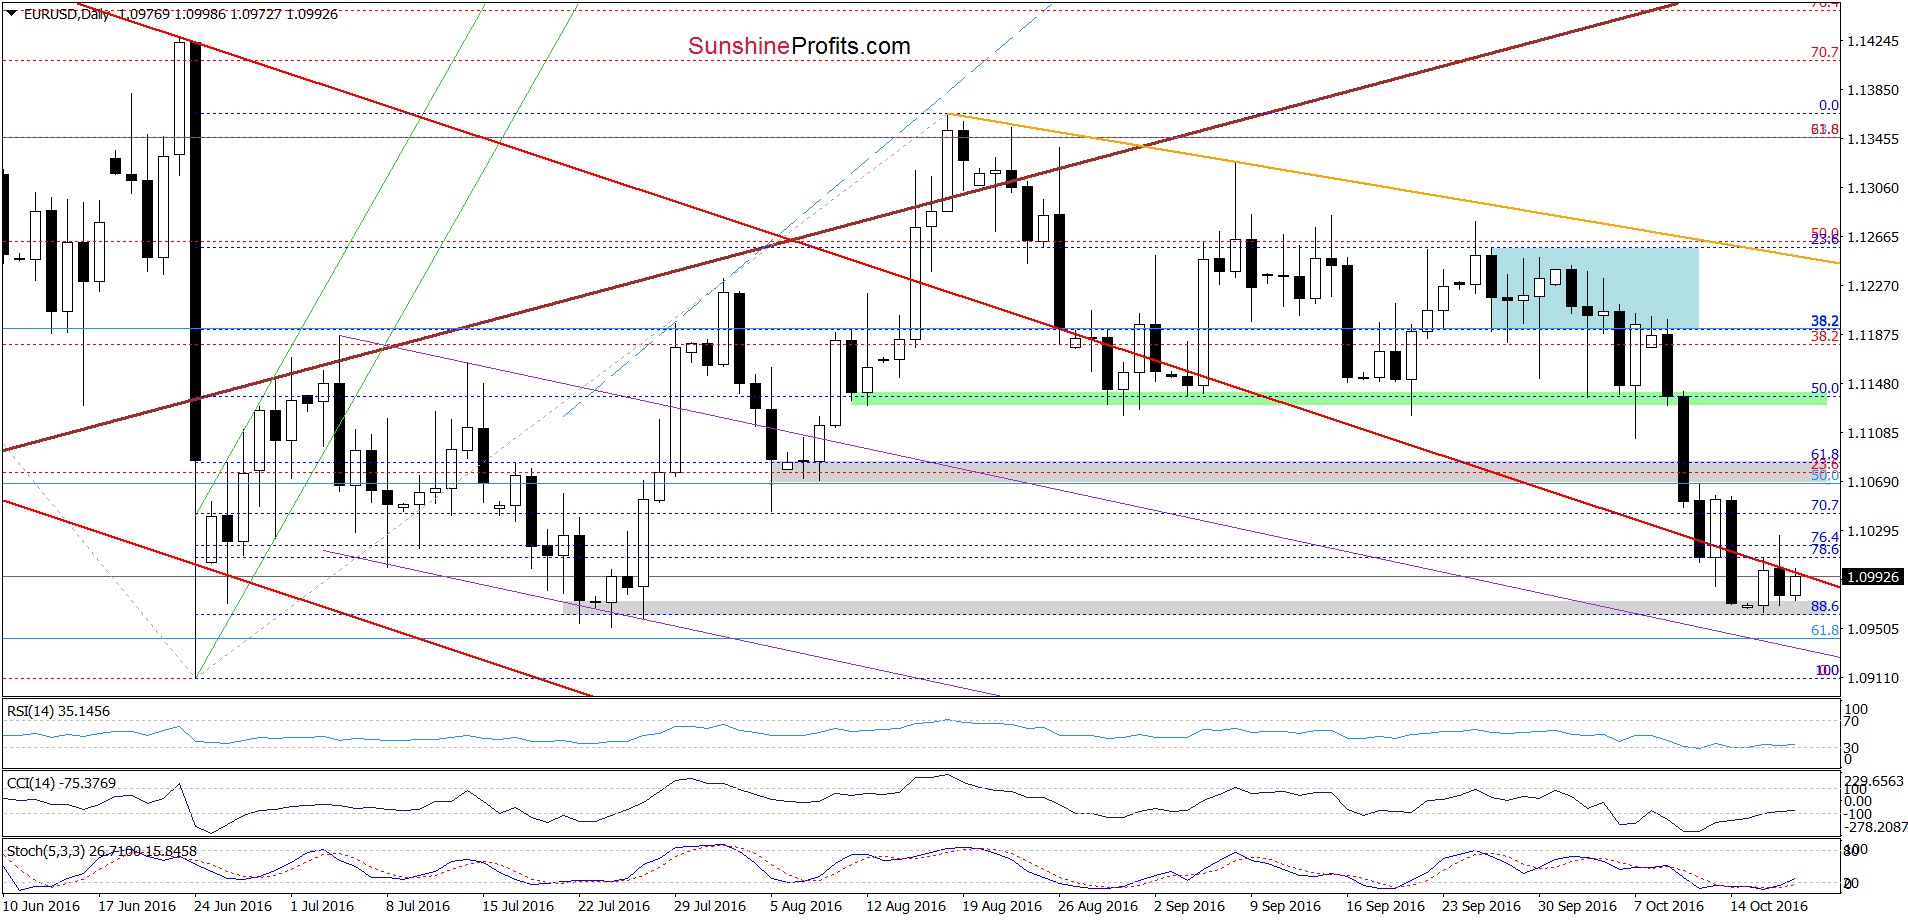
Looking at the daily chart, we see that currency bears pushed EUR/USD lower, which resulted in a re-test of the grey support zone (as we had expected). Earlier today, this area triggered another rebound (similar to what we saw on Monday), but as long as there won’t be a daily closure above the red declining line (based on the May and Jun highs) a bigger move to the upside is not likely to be seen and short-lived moves in both directions should not surprise us. Nevertheless, by signals generated by the indicators suggest that higher values of EUR/USD are just around the corner.
Very short-term outlook: mixed with bullish bias
Short-term outlook: mixed
MT outlook: mixed
LT outlook: mixed
Trading position (short-term; our opinion): No positions are justified from the risk/reward perspective. Nevertheless, if we see an invalidation of the breakdown below the red declining line, we’ll consider opening long positions. We will keep you informed should anything change, or should we see a confirmation/invalidation of the above.
GBP/USD
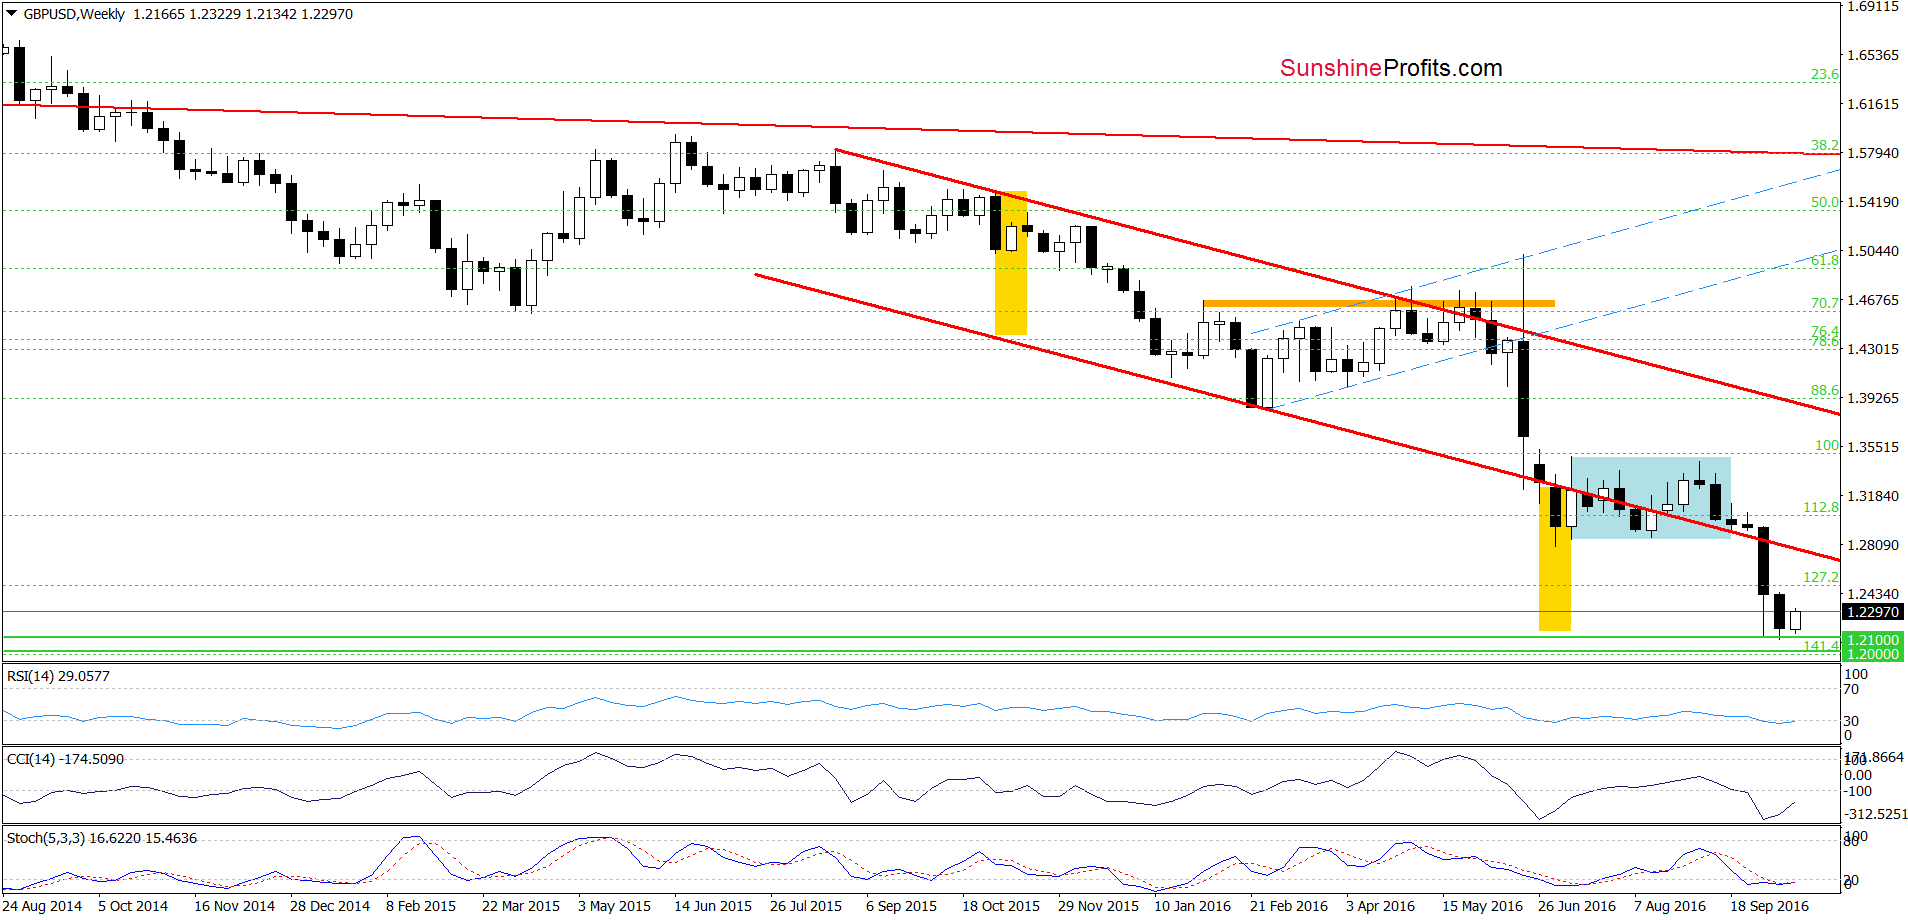
On the weekly chart, we see that the support area created by the barrier of 1.2000 I 1.2100 encouraged currency bulls to act, which triggered a rebound earlier this week.
How did this move affect the very short-term picture? Lets check.
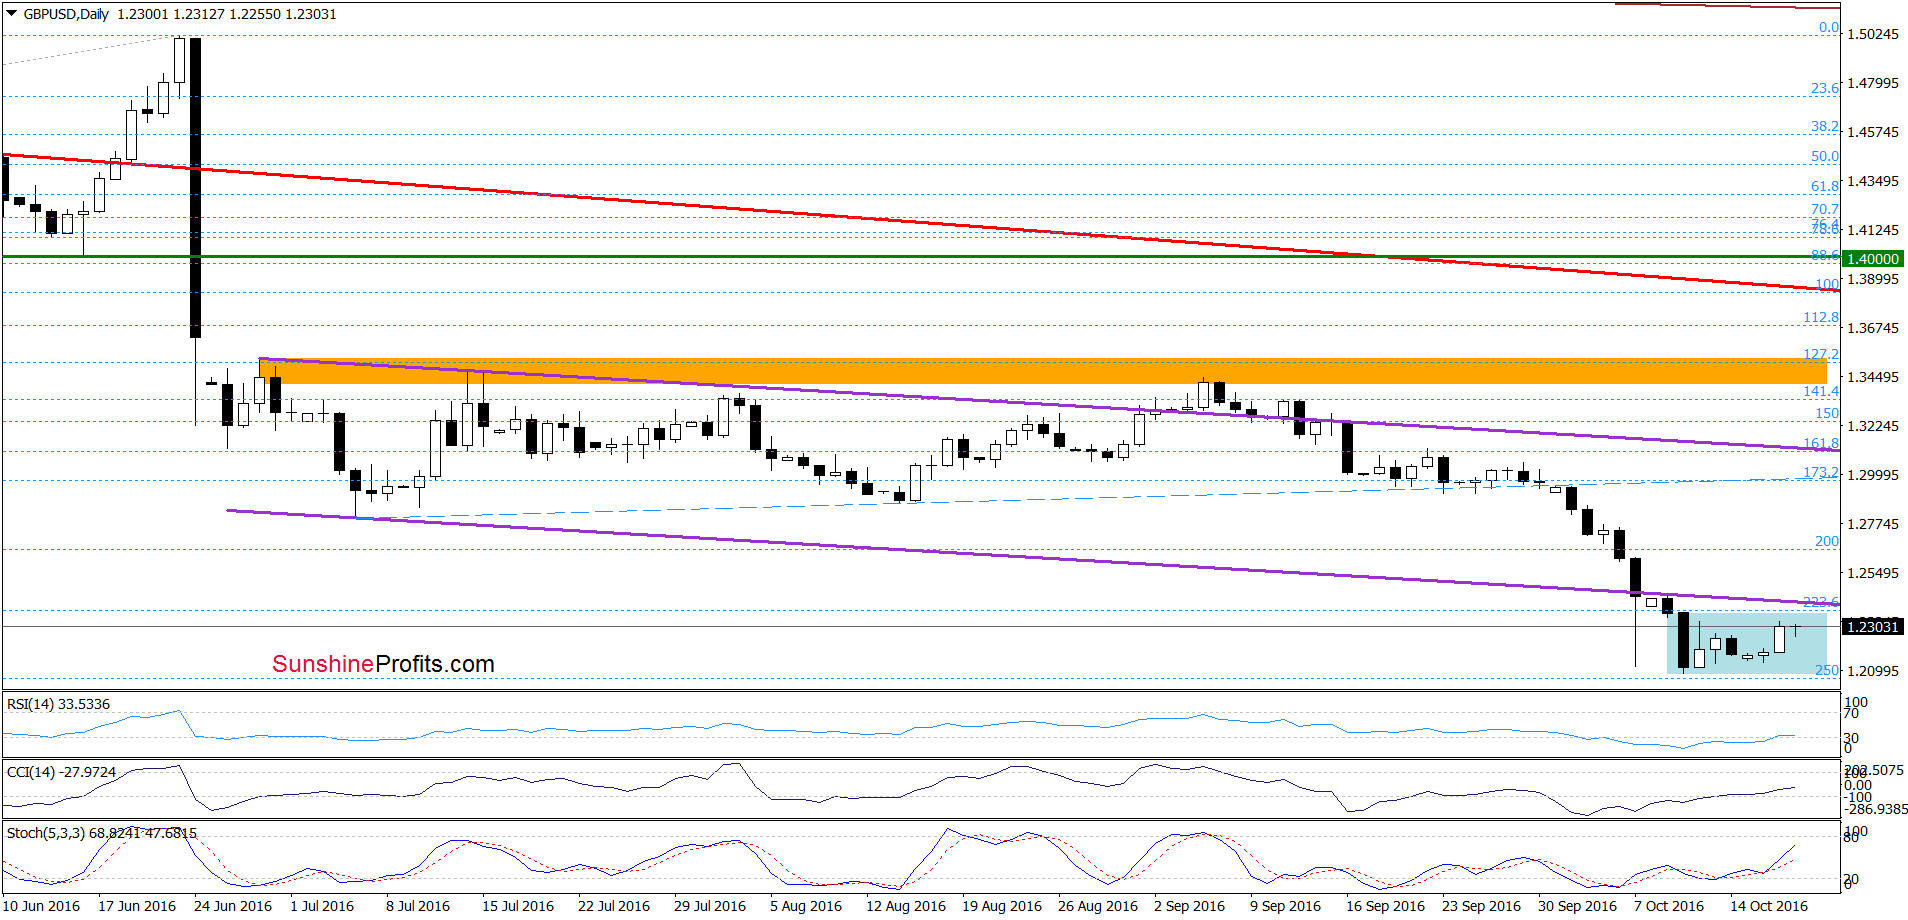
From this perspective, we see that although GBP/USD moved little higher, the pair remains in a blue consolidation under the previously-broken lower border of the purple declining trend channel. This means that as long as there won’t be a breakout above the upper line of the formation (and the lower purple line) a sizable upward move is not likely to be seen. Nevertheless, buy signals generated by the indicators suggest that currency bulls will try to push the exchange rate higher in the coming days. If they succeed and we see an invalidation of the breakdown below the lower purple line, we’ll consider opening long positions. Until this time waiting at the sidelines for another profitable opportunity is justified from the risk/reward perspective.
Very short-term outlook: mixed with bullish bias
Short-term outlook: mixed
MT outlook: mixed
LT outlook: bearish
Trading position (short-term; our opinion): No positions are justified from the risk/reward perspective. We will keep you informed should anything change, or should we see a confirmation/invalidation of the above.
USD/JPY
The situation in the long- and medium term hasn’t changed much as the exchange rate remains above the green support zone and the green support line based on the Jun and Aug lows. Today, we’ll focus on the very short-term changes.
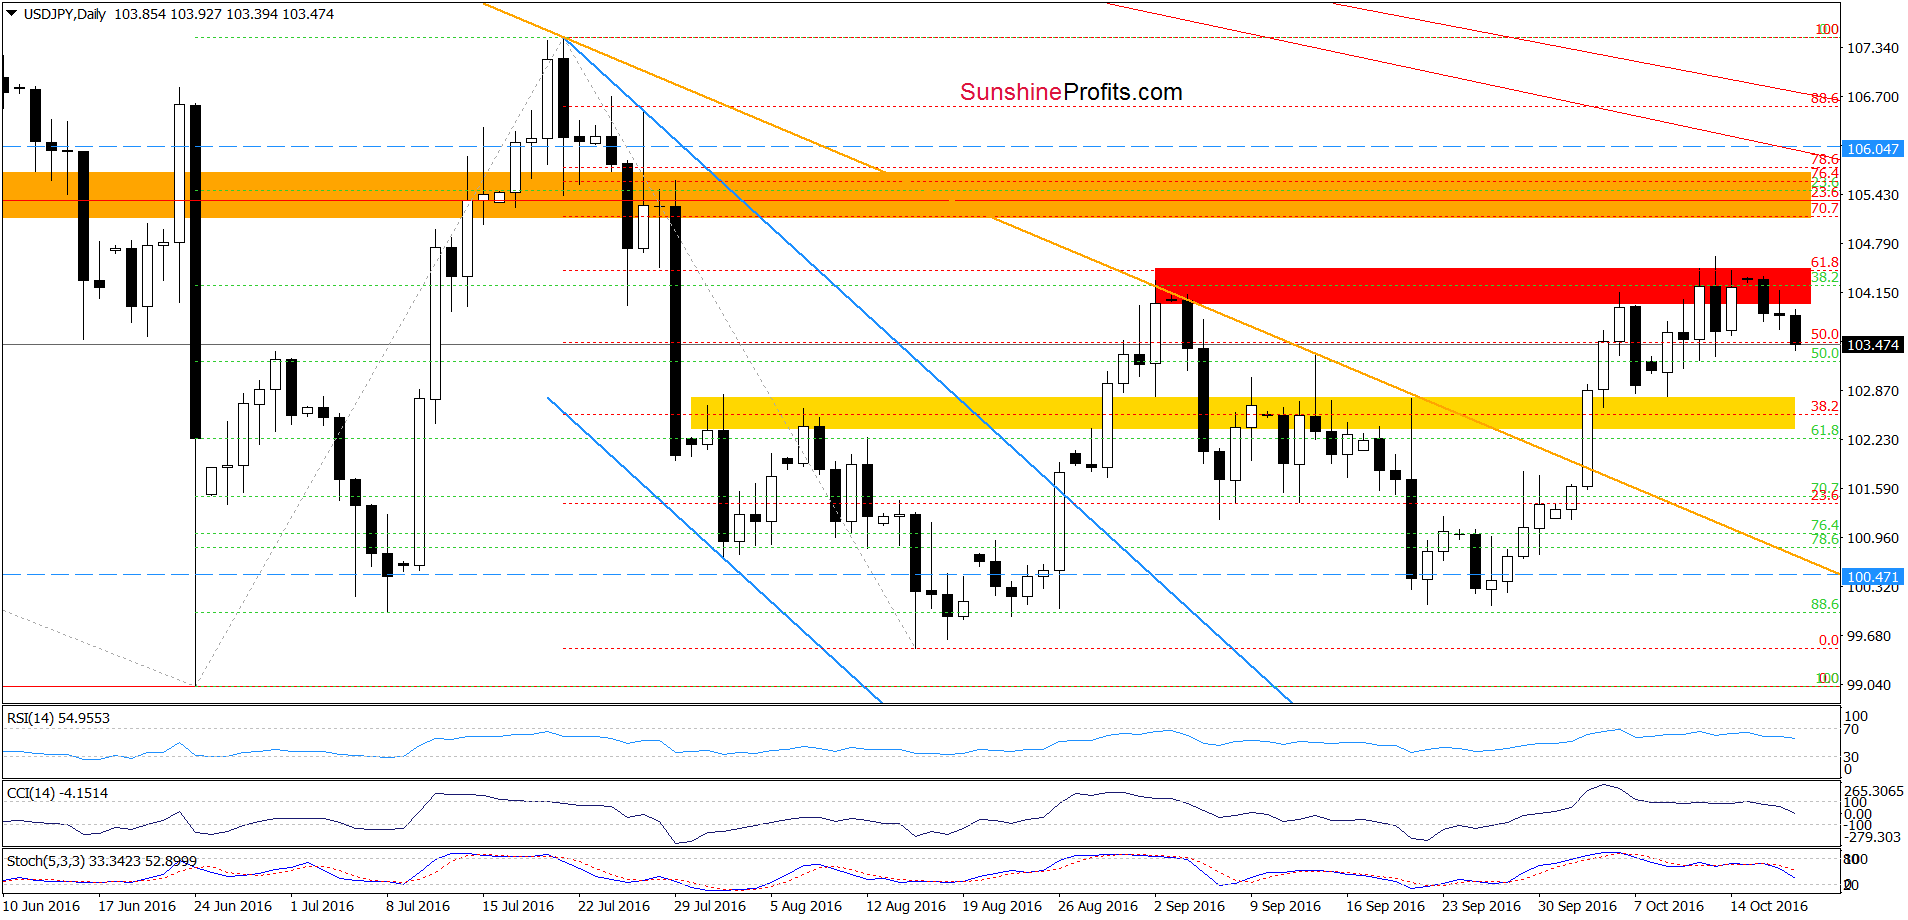
Last Wednesday we wrote the following:
(…) Will we see a breakout above it [the red resistance zone]? In our opinion, it is unlikely. Why? As you see, sell signals generated by the indicators remain in play, supporting currency bears and lower values of the exchange rate. Therefore, we think that another reversal from this area should not surprise us.
Looking at the daily chart, we see that the situation developed in line with the above scenario and USD/JPY declined under the red resistance zone, which suggests that our downside target from our last Wednesday’s alert will be in play in the coming day(s):
(…) the initial downside target would be the yellow zone. However if it is broken, USD/JPY may test the previously-broken orange declining line, which serves now as another support.
Very short-term outlook: bearish
Short-term outlook: mixed with bearish bias
MT outlook: mixed
LT outlook: mixed
Trading position (short-term; our opinion): Short positions (with a stop-loss order at 104.84 and initial downside target at 101.02) are justified from the risk/reward perspective. We will keep you informed should anything change, or should we see a confirmation/invalidation of the above.
USD/CAD
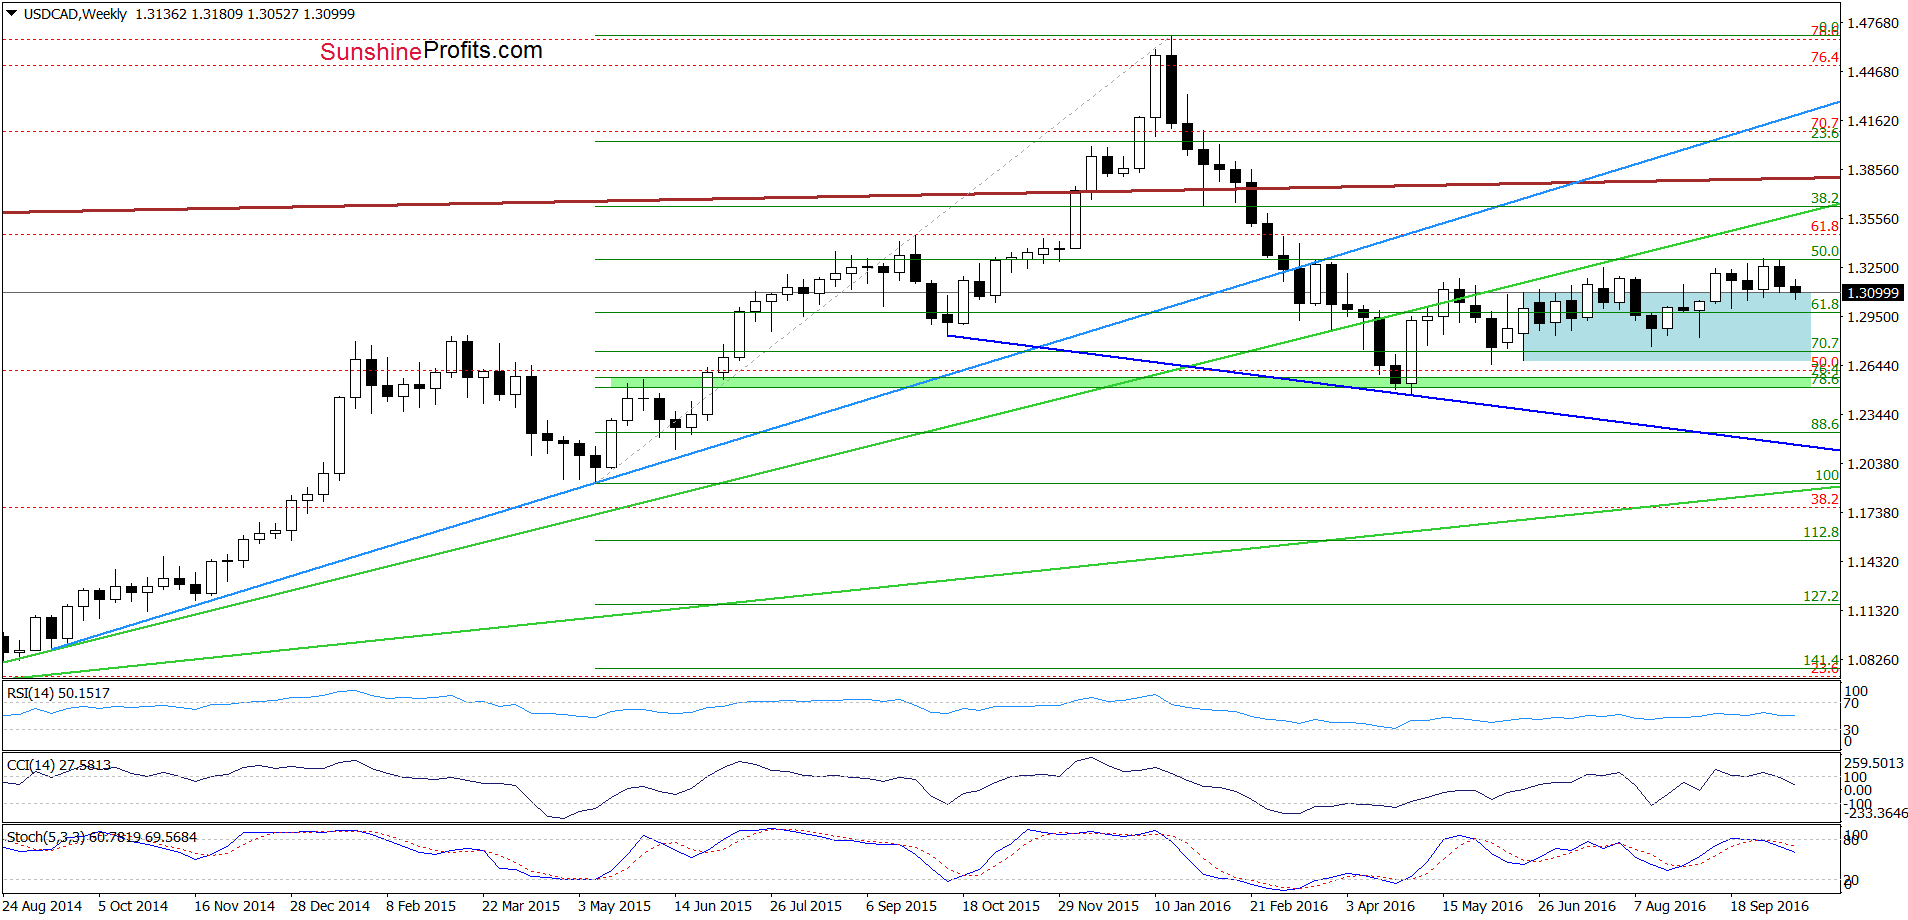
From today’s point of view, we see that USD/CAD moved lower and slipped below the upper border of the blue consolidation, which doesn’t bode well for currency bulls. Nevertheless, this signal would be more bearish if the exchange rate closes this week under 1.3098.
Having said the above, let’s check how did this decline affect the very short-term picture.
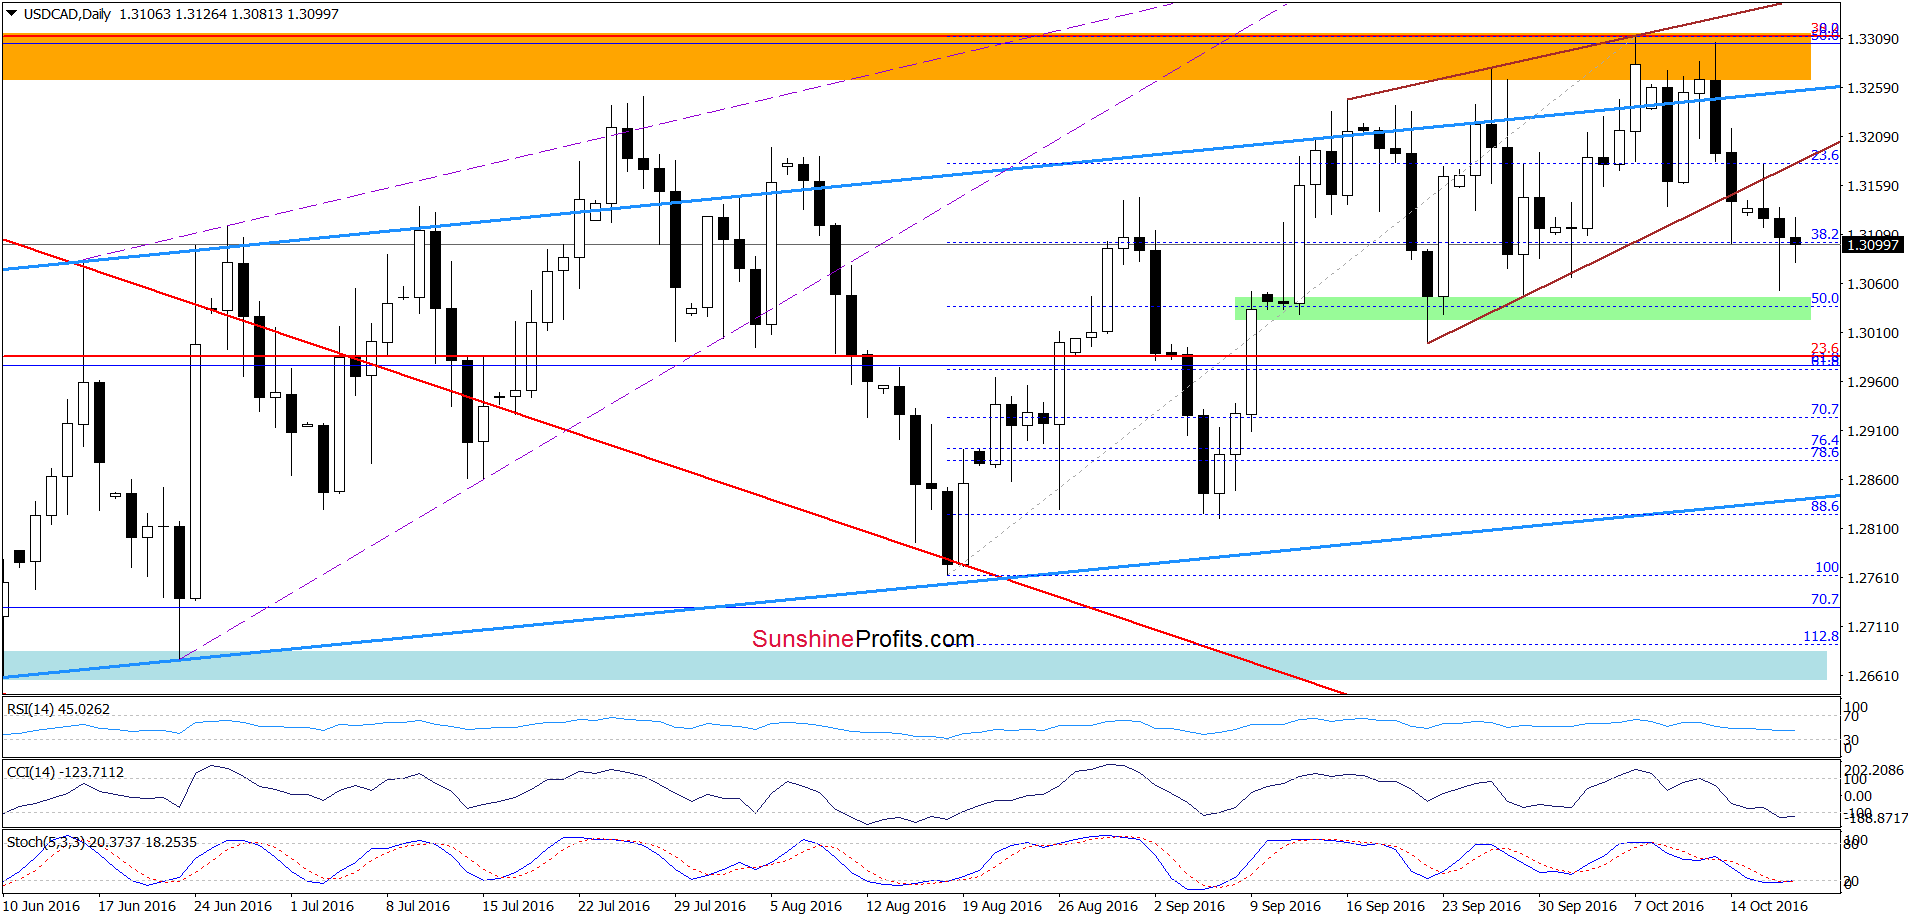
Quoting our Thursday’s alert:
(…) the orange resistance zone and the upper border of the brown rising wedge continue to keep gains in check, which means that as long as there won’t be a breakout above this important resistance area another move to the downside is very likely. Therefore, if USD/CAD moves lower from current levels, the initial downside target would be the lower border of the brown rising wedge. If this support is broken, the next downside target would be around 1.3027-1.3046, where the previous lows and the 50% Fibonacci retracement are.
On the daily chart, we see that the situation developed in line with our assumptions and USD/CAD broke not only below the lower border of the brown rising wedge, but also approached our next downside target. What’s next? As you see, the proximity to the Fibonacci retracement triggered a pullback yesterday. Despite this move, currency bears didn’t give up and pushed the pair lower, which means that we’ll see a test of the green support zone in the coming day(s). At this point it s worth noting that the CCI and Stochastic Oscillator are oversold, however, as long as there won’t be buy signals further deterioration is likely.
Very short-term outlook: bearish
Short-term outlook: mixed with bearish bias
MT outlook: mixed with bearish bias
LT outlook: mixed
Trading position (short-term; our opinion): Short positions (with a stop-loss order at 1.3346 and initial downside target at 1.2876) are justified from the risk/reward perspective. We will keep you informed should anything change, or should we see a confirmation/invalidation of the above.
USD/CHF
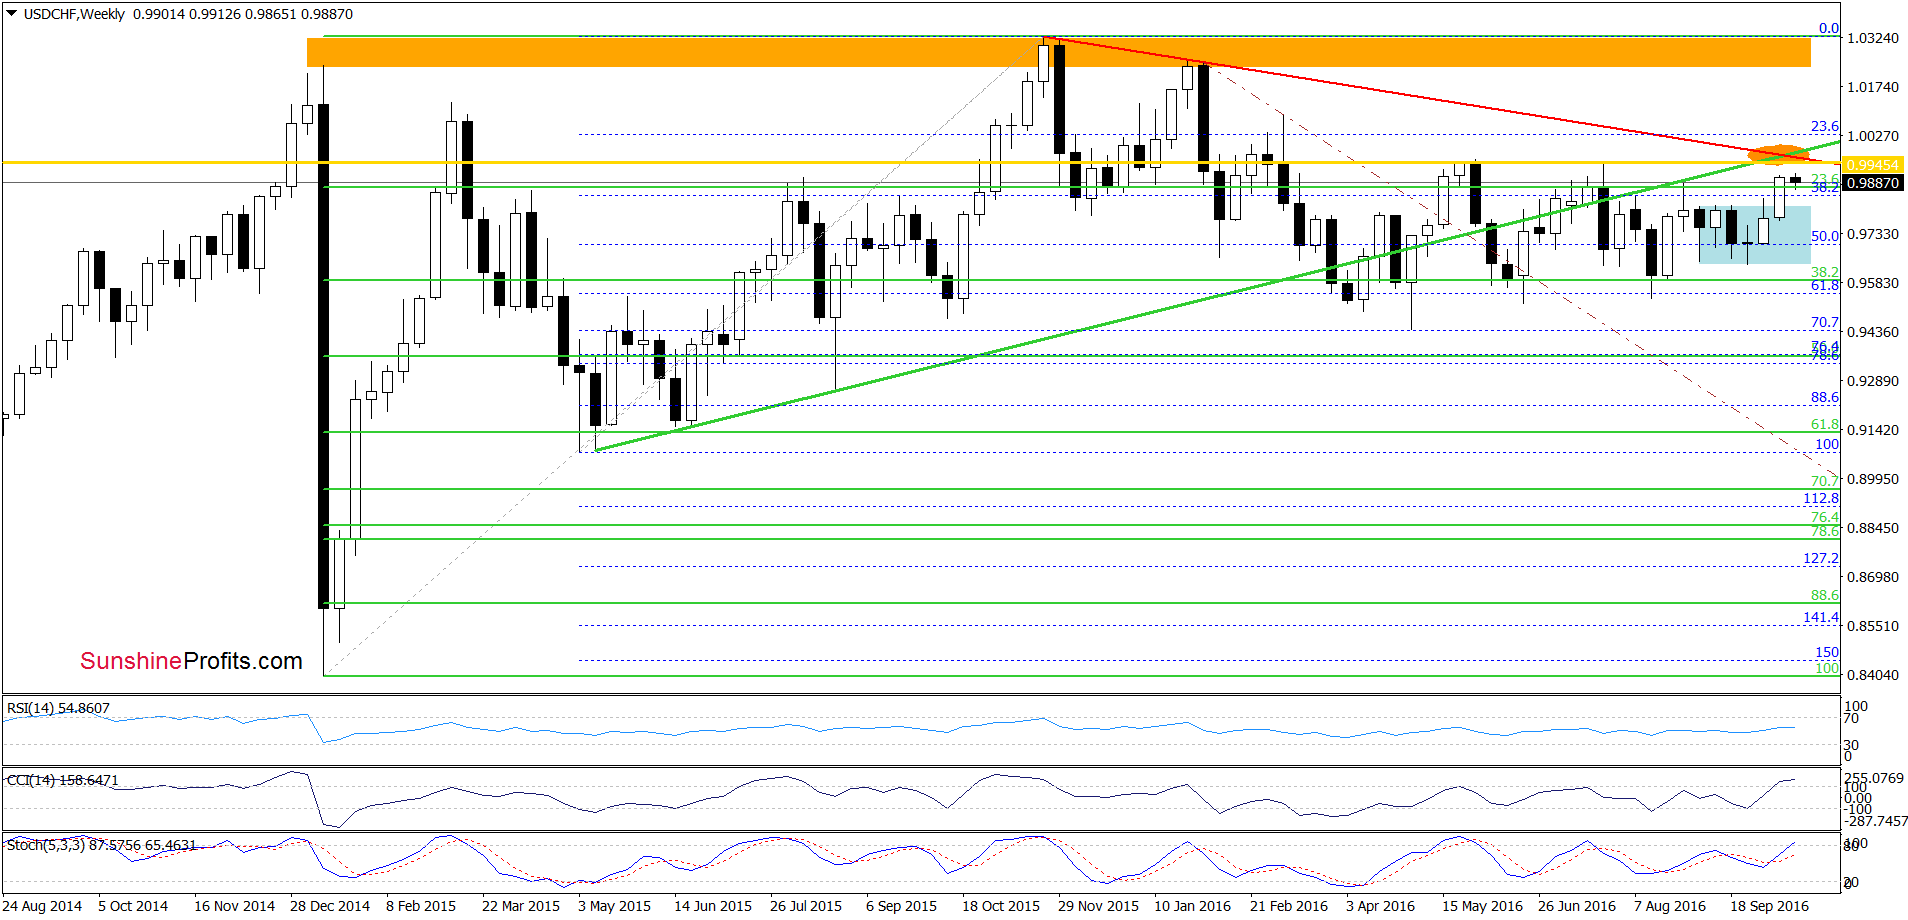
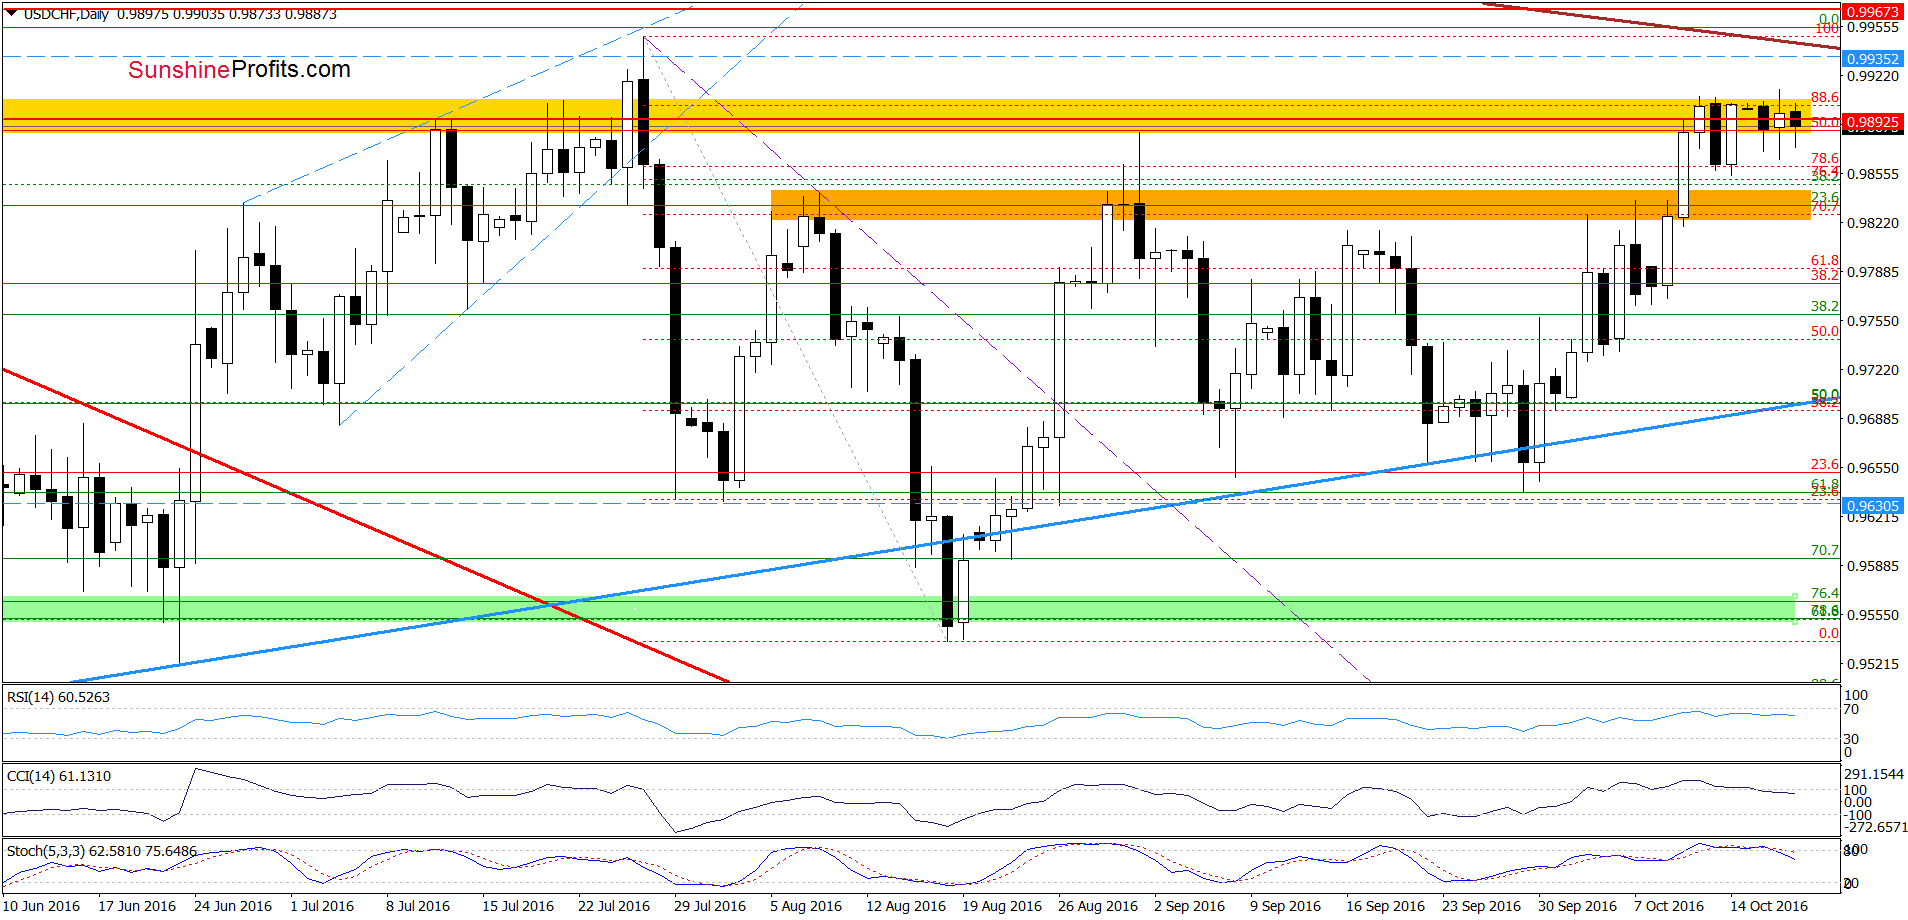
Looking at the daily chart, we see that USD/CHF is trading in the yellow resistance zone – quite close to yesterday’s levels, which means that our previous commentary on this currency pair remains up-to-date also today:
(…) Although currency bears extended losses earlier today, their opponents managed to stop them and pushed the pair higher in the following hours, which resulted in a re-test of the last week’s highs. What’s next? Taking into account the fact that we saw similar price action several times in previous days, sell signals generated by the indicators and the proximity to the key resistance zone (created by the long-term red declining resistance line based on the Nov and Feb highs, the green rising line based on the May and Aug 2015 lows and May and Jul highs - marked with orange ellipse on the weekly chart) we think that reversal and lower values of USD/CHF are just around the corner.
Very short-term outlook: bearish
Short-term outlook: mixed with bearish bias
MT outlook: mixed
LT outlook: mixed
Trading position (short-term; our opinion): Short positions (with a stop-loss order at 0.9954 and initial downside target at 0.9778) are justified from the risk/reward perspective. We will keep you informed should anything change, or should we see a confirmation/invalidation of the above.
AUD/USD
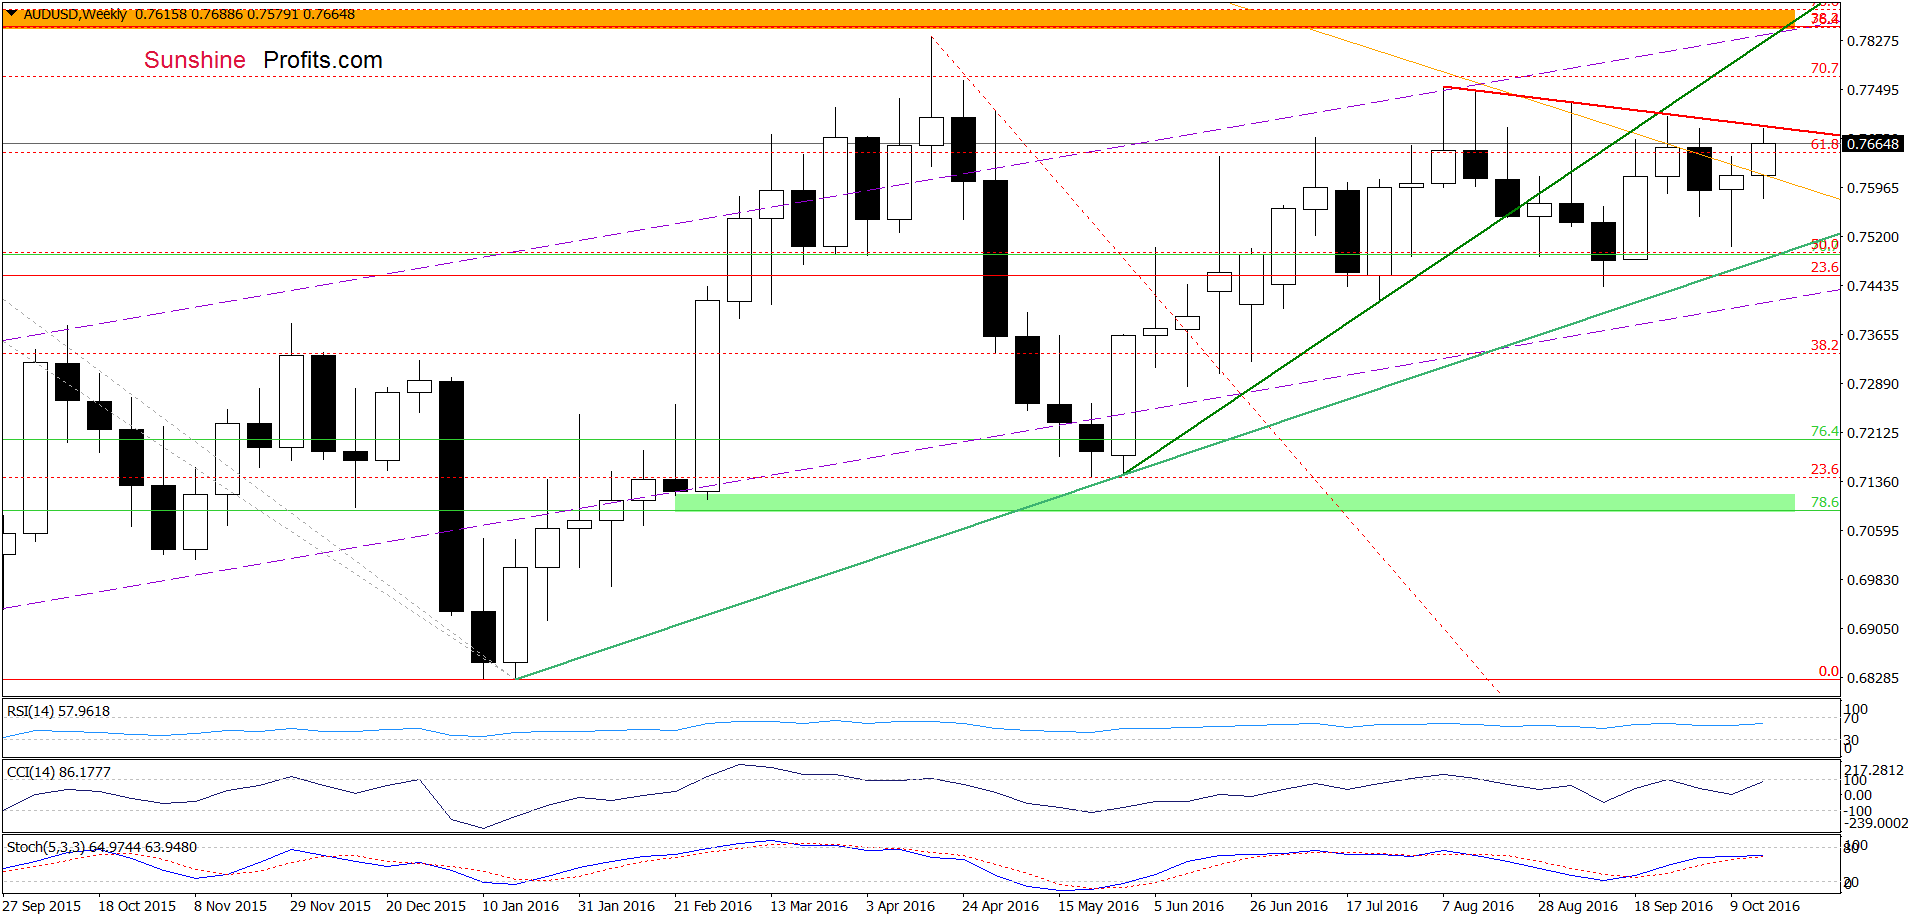
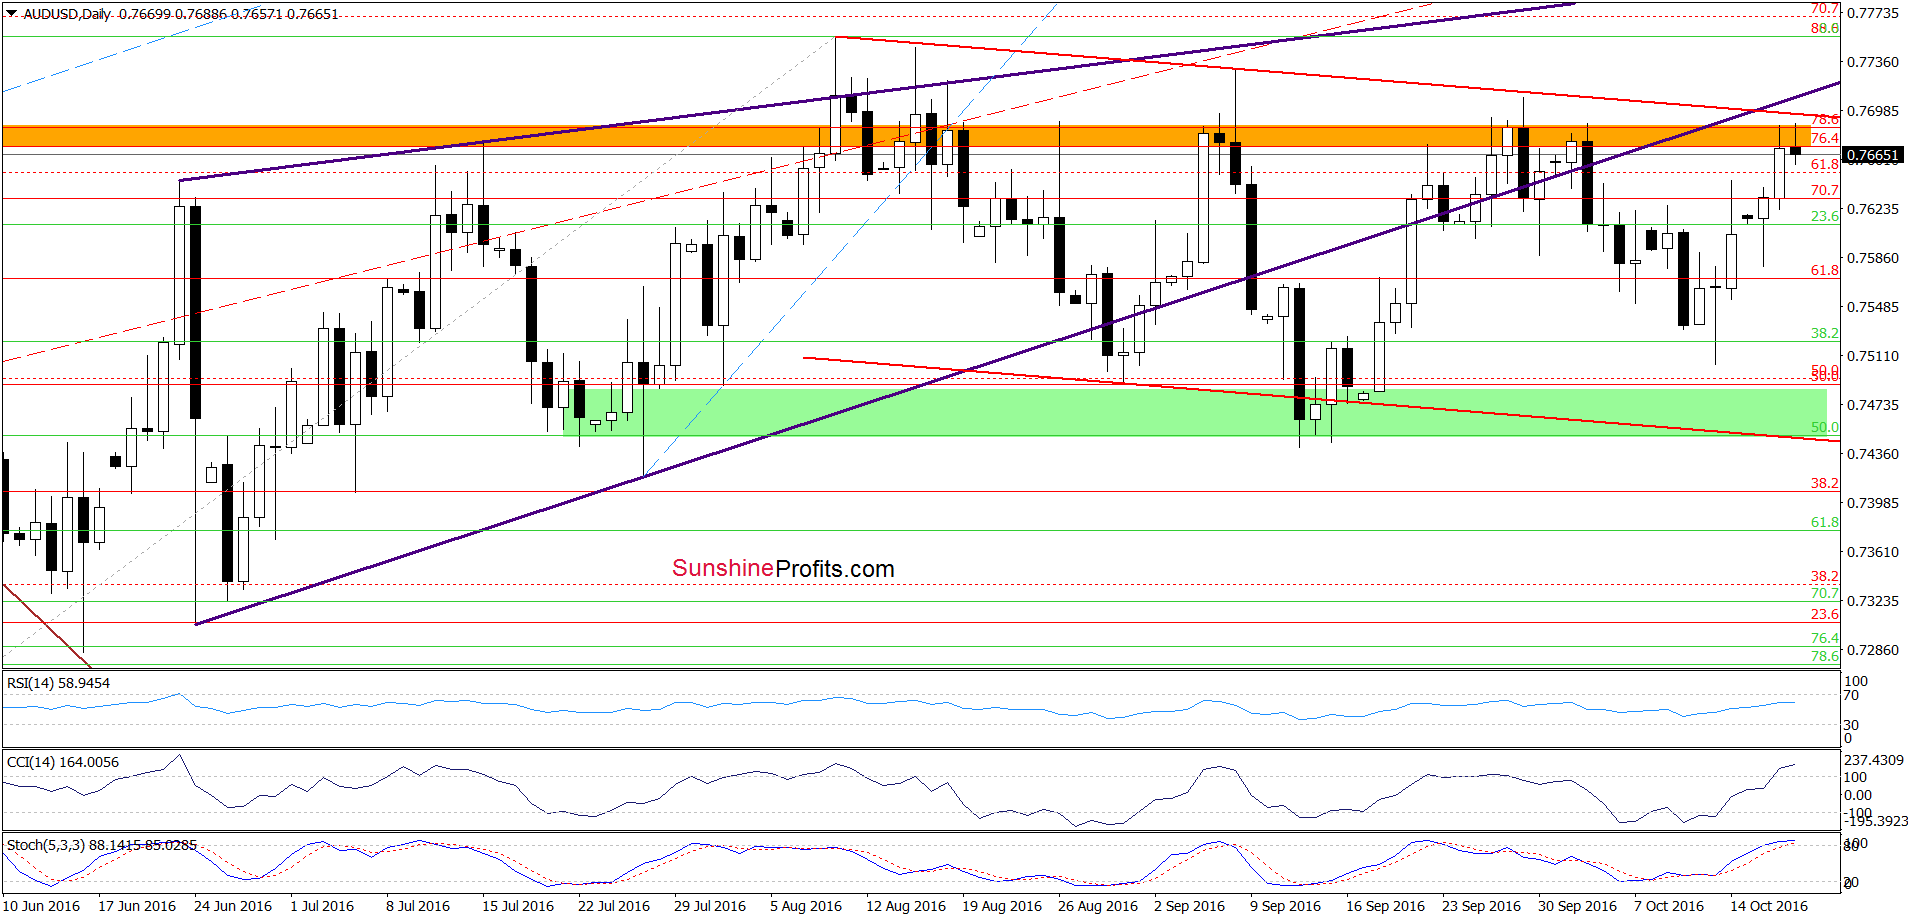
Looking at the above charts, we see that AUD/USD extended last week’s gains and came back to the orange resistance one zone once again. Taking into account the fact that this area was strong enough to stop currency bulls several times in the past, we think that the history will repeat itself and we’ll see another reversal from current levels – especially when we factor in the proximity to the lower border of the rising purple wedge and the red declining resistance line based on the previous highs. On top of that, the CCI and Stochastic Oscillator are overbought, which increases the probability of reversal in very near future. If his is the case and AUD/USD moves lower from here, the initial downside target would be around 0.7542, where the 61.8% Fibonacci retracement (based on the recent upward move) is.
Very short-term outlook: mixed with bearish bias
Short-term outlook: mixed
MT outlook: mixed
LT outlook: mixed
Trading position (short-term; our opinion): No positions are justified from the risk/reward perspective. However, if we see another unsuccessful attempt to move higher, we’ll consider re-opening short positions. We will keep you informed should anything change, or should we see a confirmation/invalidation of the above.
Thank you.
Nadia Simmons
Forex & Oil Trading Strategist
Przemyslaw Radomski, CFA
Founder, Editor-in-chief, Gold & Silver Fund Manager
Gold & Silver Trading Alerts
Forex Trading Alerts
Oil Investment Updates
Oil Trading Alerts

