

Earlier today, the Labor Department reported that core inflation (without excludes volatile food and fuel costs) increased by 0.1%, signaling that that the U.S. economy may be able to sustain higher interest rates. In this environment, the U.S. dollar reversed against the yen and moved higher, reaching the resistance zone once again. Will it manage to stop currency bulls in the coming days?
In our opinion the following forex trading positions are justified - summary:
- EUR/USD: none
- GBP/USD: none
- USD/JPY: none
- USD/CAD: short (a stop-loss order at 1.3346; initial downside target at 1.2876)
- USD/CHF: none
- AUD/USD: none
EUR/USD
Last Wednesday, we wrote the following:
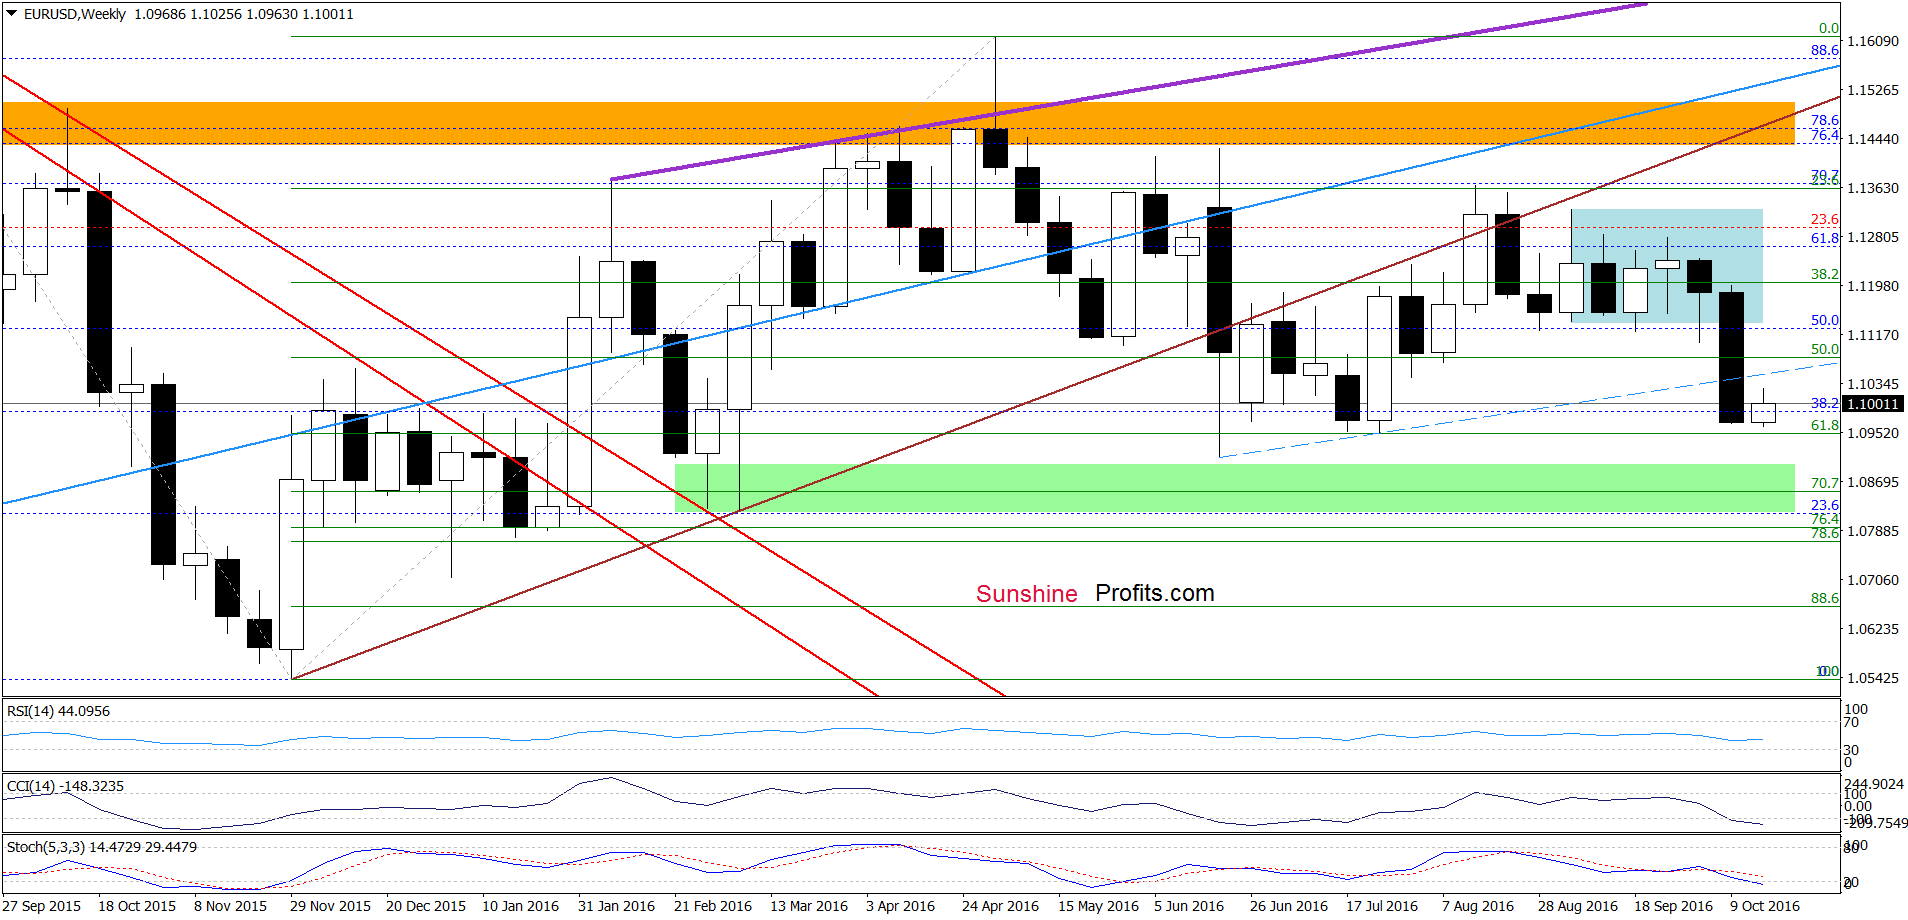
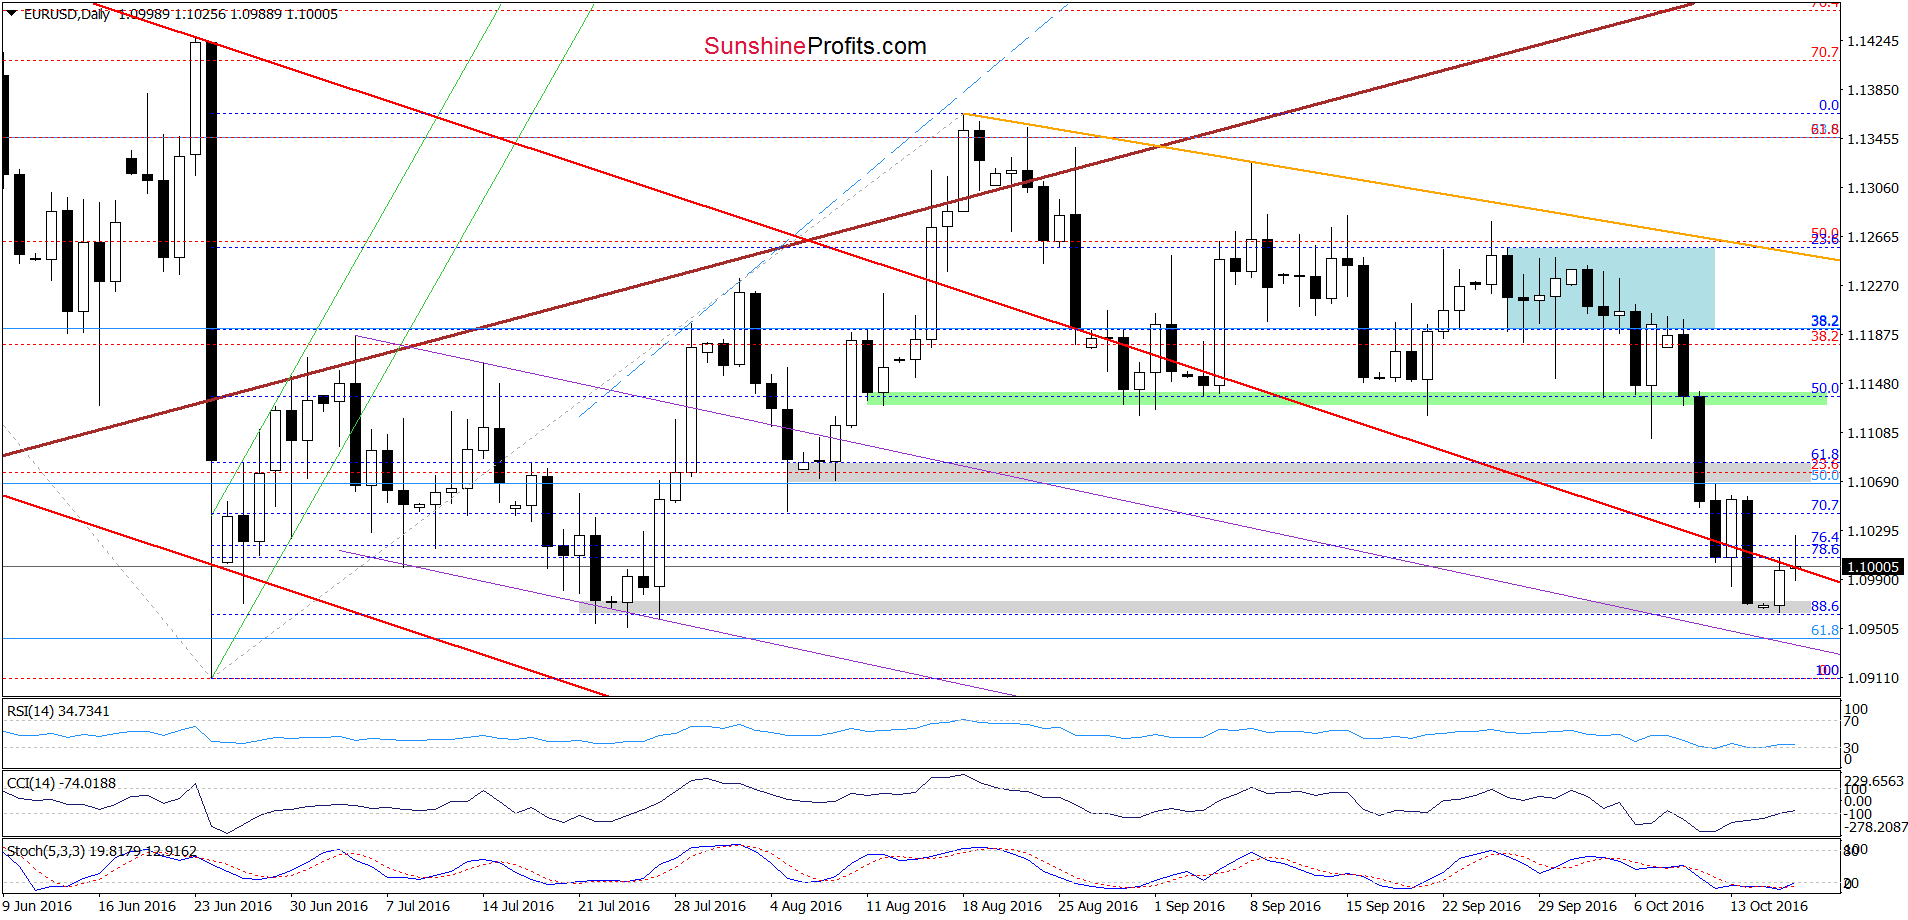
(…) as long as the sell signal generated by the Stochastic Oscillator remains in play another downswing can’t be ruled out. Therefore, (…) we may see a decline even to the next grey support zone (created by the 88.6% Fibonacci retracement and late Jul lows) around 1.0954-1.0971.
On the daily chart, we see that the situation developed in line with the above scenario and EUR/USD declined to our downside target in recent days. As you see, the grey support zone encouraged currency bulls to act, which resulted in a rebound and a comeback above the previously-broken red declining line (based on the May and Jun highs). Although this is a positive signal, we think it would be more reliable only if the exchange rate closes today’s or one of the following day’s above this line (an invalidation of the breakdown). Until this time another test of the grey zone is likely – especially when we factor in the fact that the Stochastic Oscillator is still below the level of 20.
Very short-term outlook: mixed with bullish bias
Short-term outlook: mixed
MT outlook: mixed
LT outlook: mixed
Trading position (short-term; our opinion): No positions are justified from the risk/reward perspective. Nevertheless, if we see an invalidation of the breakdown below the red declining line, we’ll consider opening long positions. We will keep you informed should anything change, or should we see a confirmation/invalidation of the above.
USD/JPY

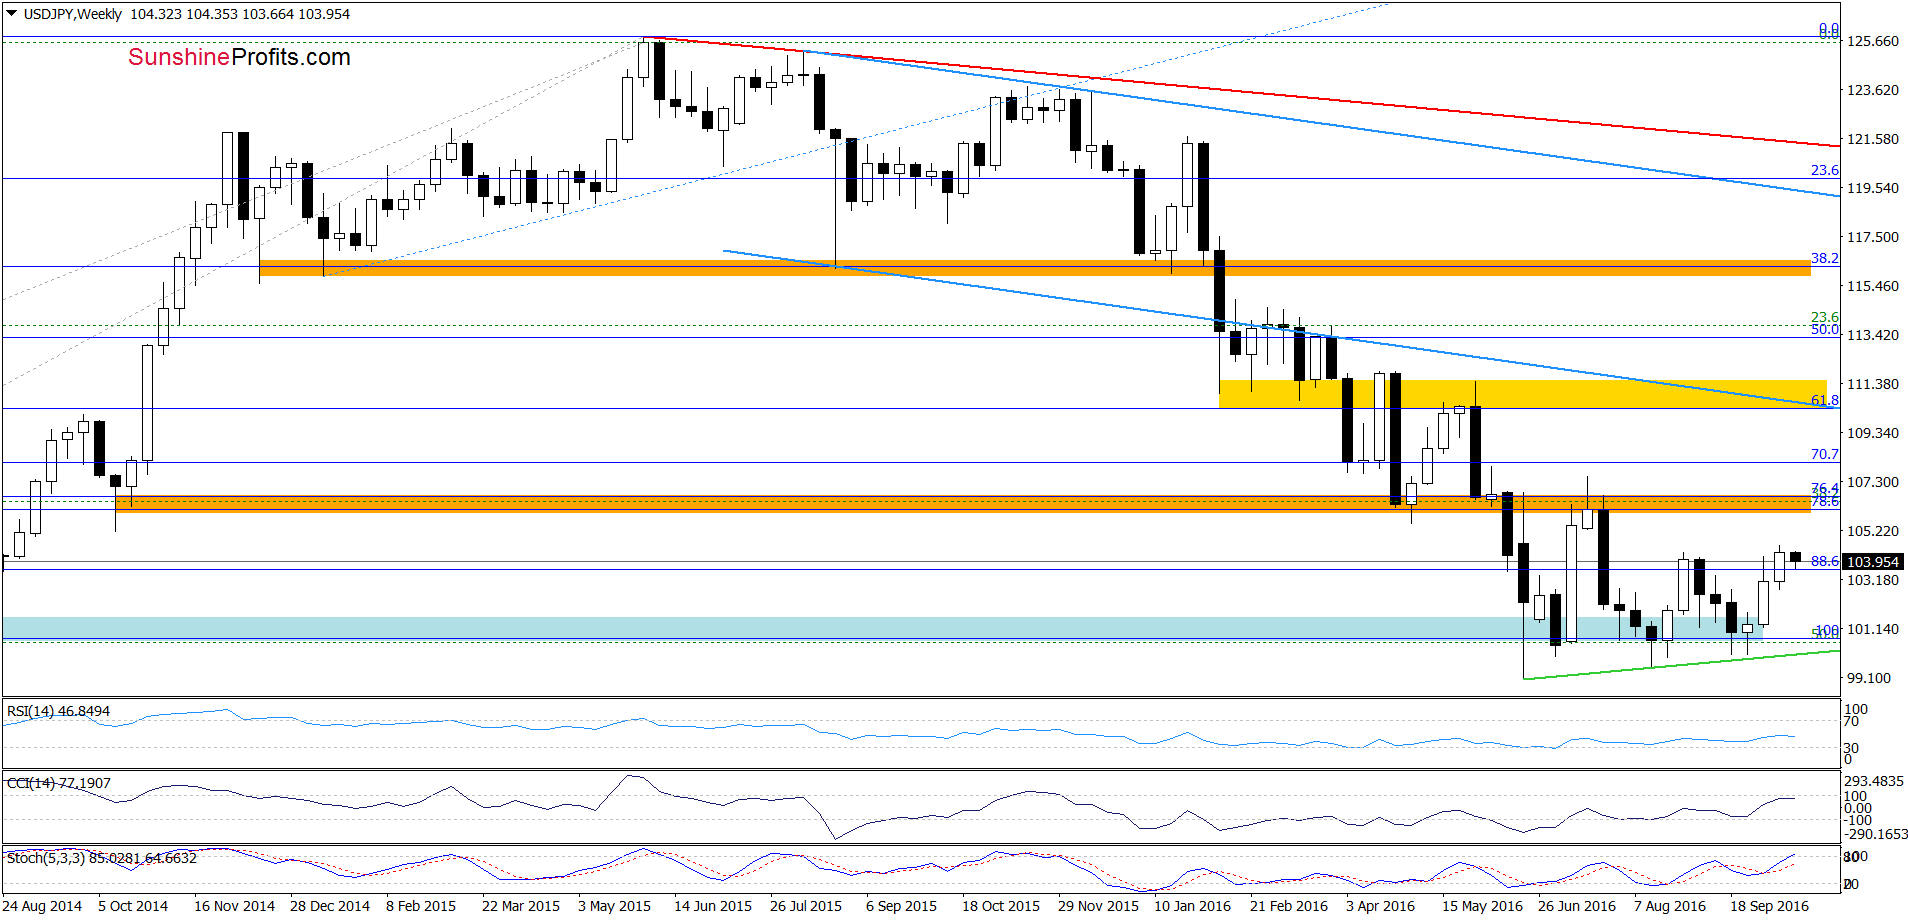
The situation in the long- and medium term hasn’t changed much as the exchange rate remains above the green support zone (marked on the monthly chart) and the green support line based on the Jun and Aug lows (seen on the weekly chart). Today, we’ll focus on the very short-term changes.
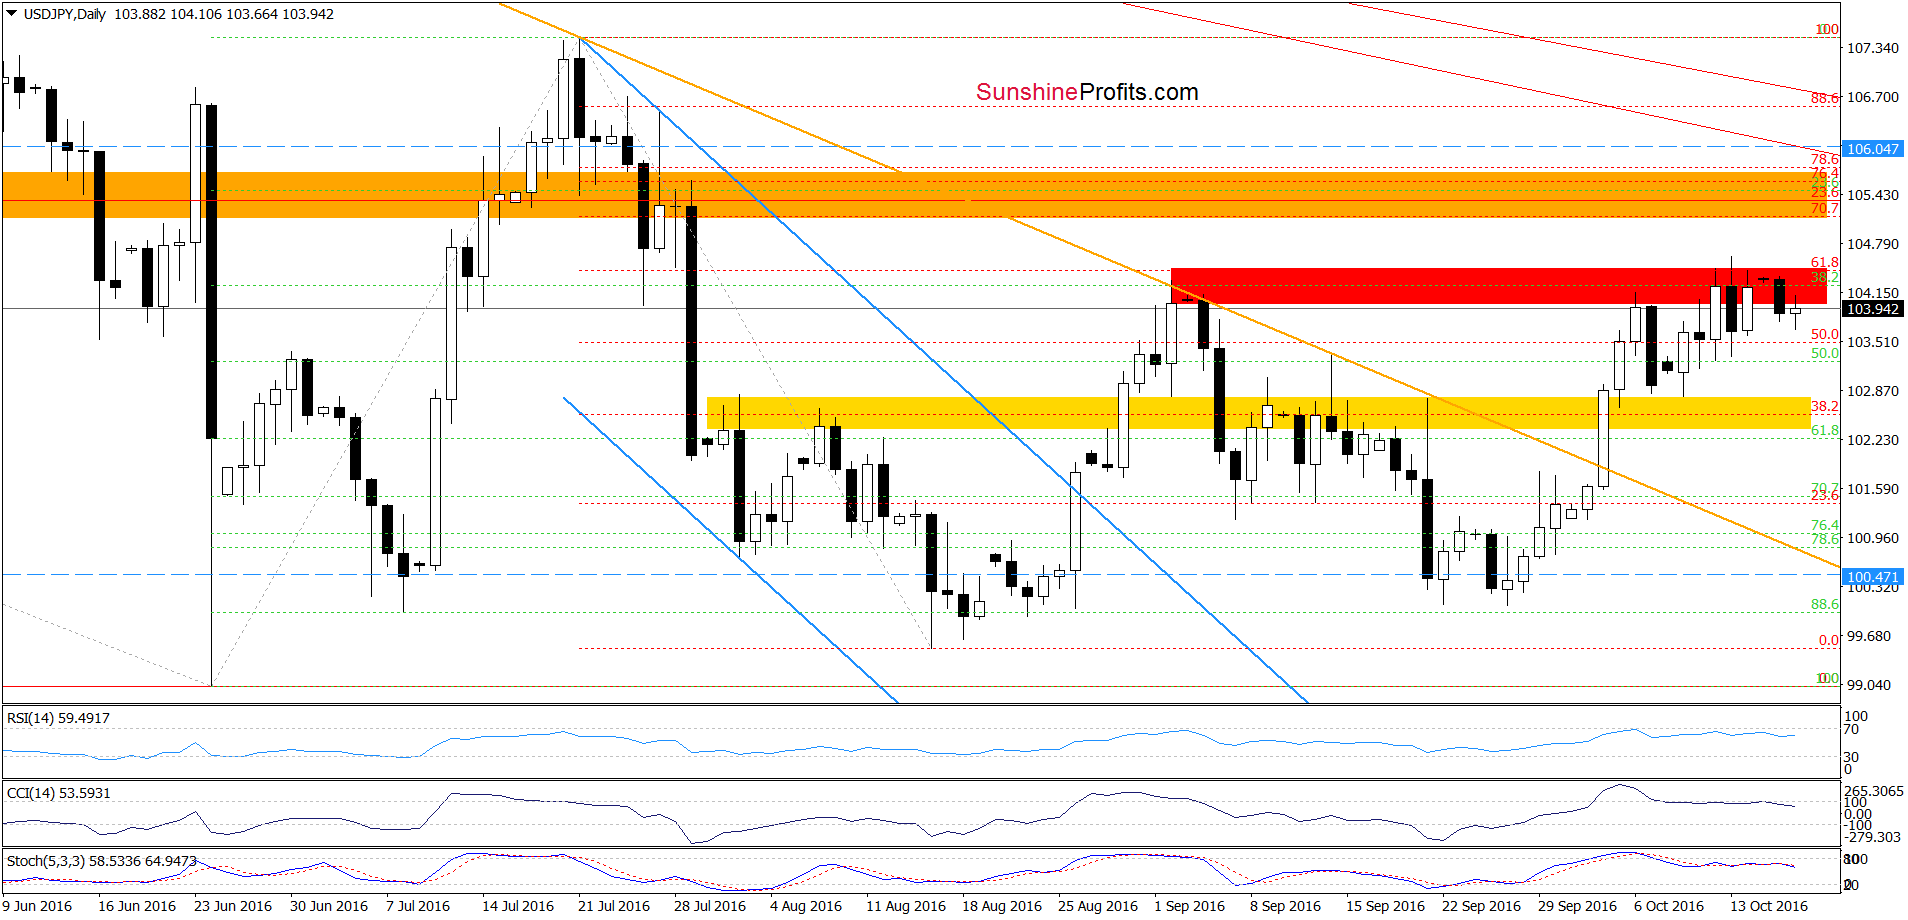
On the daily chart, we see that although USD/JPY rebounded once again earlier today, the red resistance zone continues to keep gains in check. This means that what we wrote last Wednesday remains up-to-date also today:
(…) Will we see a breakout above it [the red resistance zone]? In our opinion, it is unlikely. Why? As you see, sell signals generated by the indicators remain in play, supporting currency bears and lower values of the exchange rate. Therefore, we think that another reversal from this area should not surprise us. If this is the case and we see such price action, the initial downside target would be the yellow zone. However if it is broken, USD/JPY may test the previously-broken orange declining line, which serves now as another support.
Very short-term outlook: mixed with beaish bias
Short-term outlook: mixed
MT outlook: mixed
LT outlook: mixed
Trading position (short-term; our opinion): No positions are justified from the risk/reward perspective. However, if we see another daily closure below the red zone, we’ll consider opening short positions. We will keep you informed should anything change, or should we see a confirmation/invalidation of the above.
USD/CHF
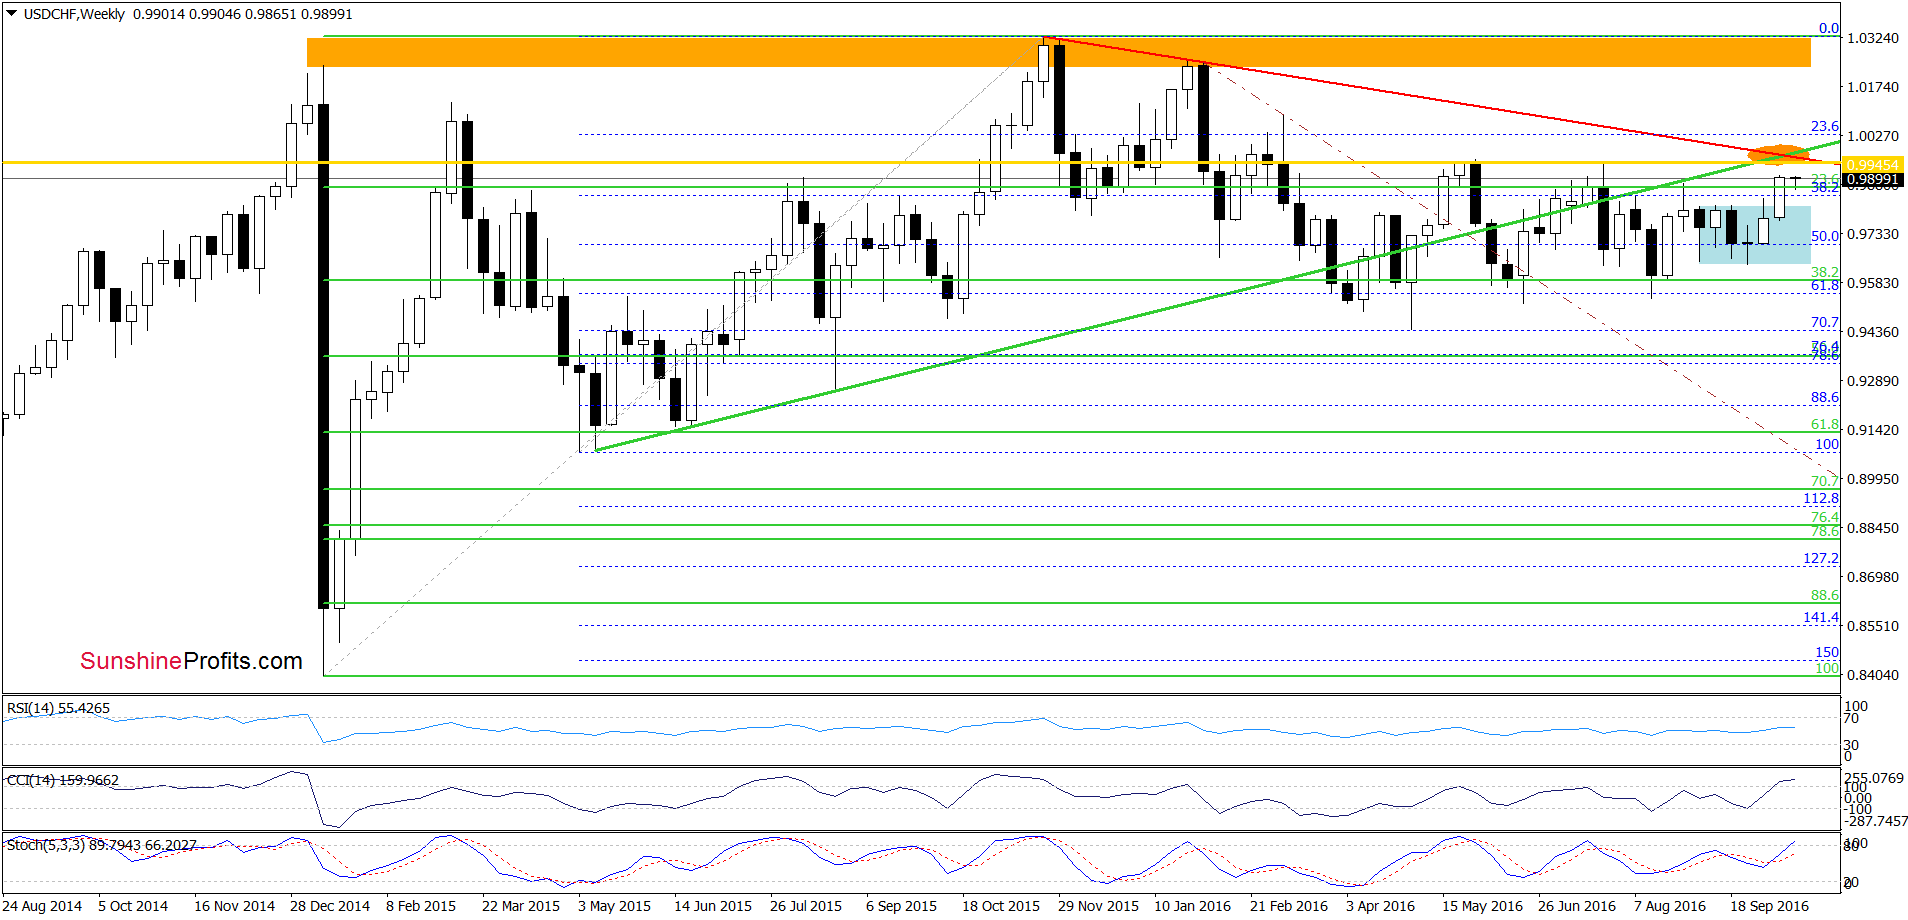
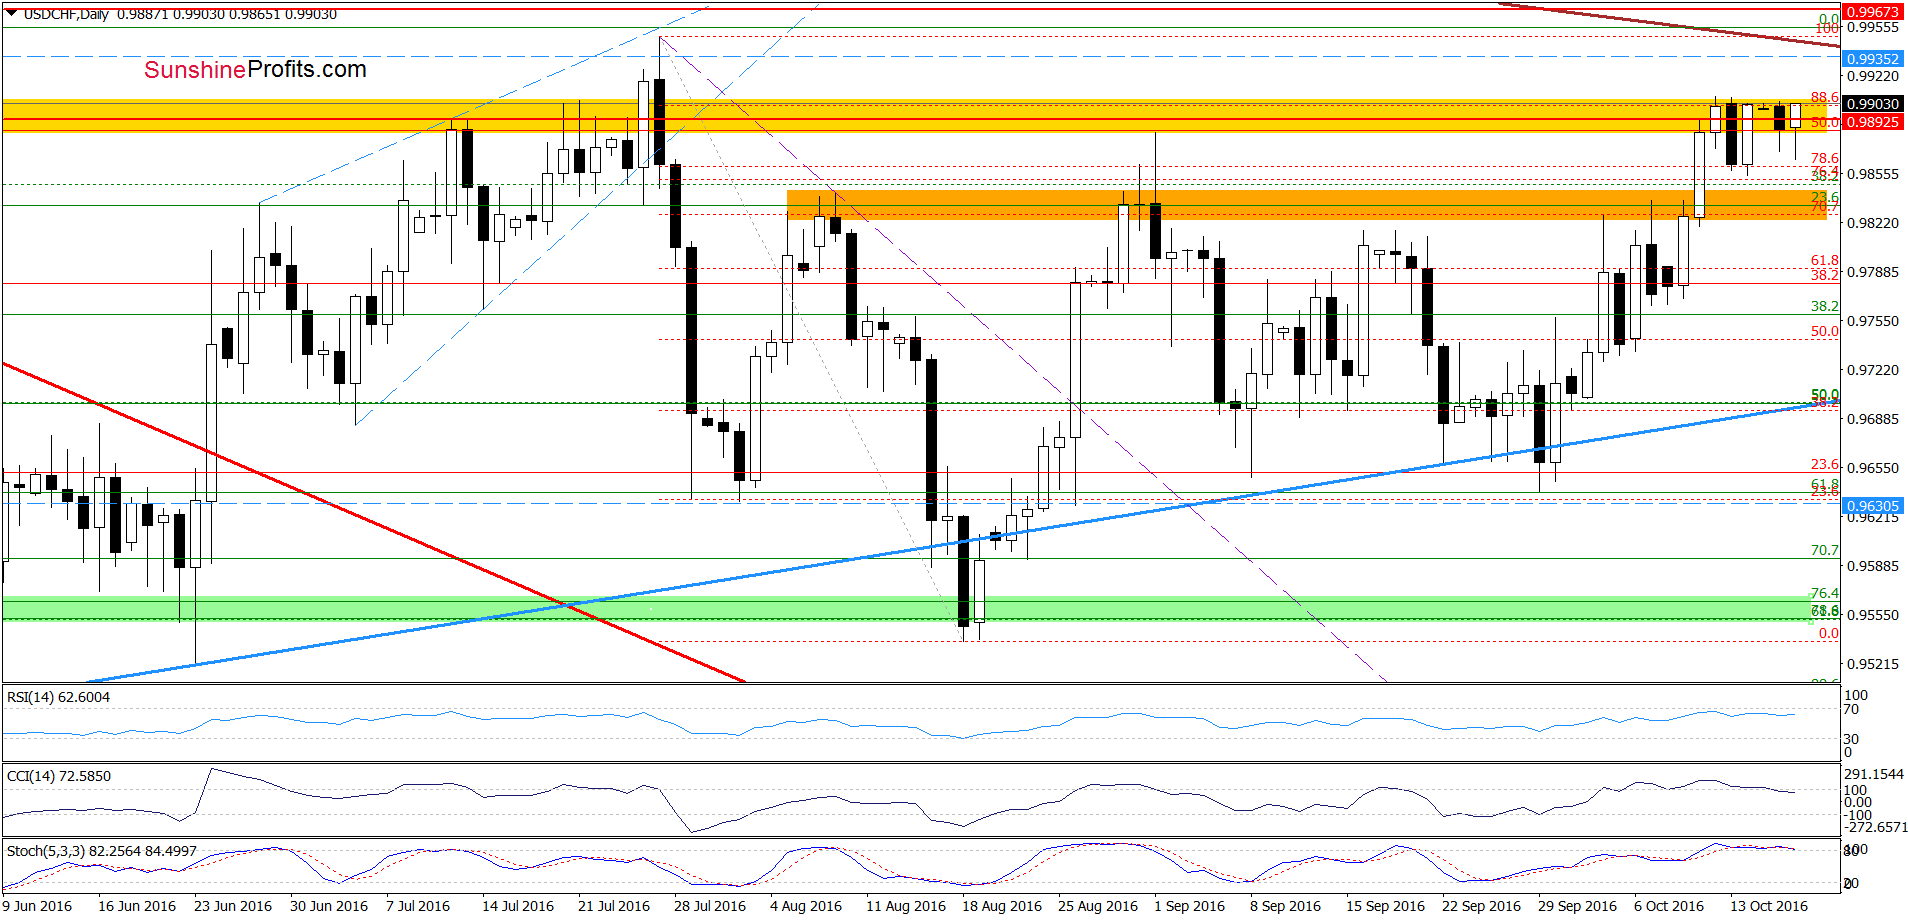
Looking at the daily chart, we see that the yellow resistance zone triggered a pullback yesterday. Although currency bears extended losses earlier today, their opponents managed to stop them and pushed the pair higher in the following hours, which resulted in a re-test of the last week’s highs. What’s next? Taking into account the fact that we saw similar price action several times in previous days, sell signals generated by the indicators and the proximity to the key resistance zone (created by the long-term red declining resistance line based on the Nov and Feb highs, the green rising line based on the May and Aug 2015 lows and May and Jul highs - marked with orange ellipse on the weekly chart) we think that reversal and lower values of USD/CHF are just around the corner.
Very short-term outlook: mixed with bearish bias
Short-term outlook: mixed
MT outlook: mixed
LT outlook: mixed
Trading position (short-term; our opinion): No positions are justified from the risk/reward perspective. However, if we see another unsuccessful attempt to break above the yellow resistance zone, we’ll consider opening short positions. We will keep you informed should anything change, or should we see a confirmation/invalidation of the above.
Thank you.
Nadia Simmons
Forex & Oil Trading Strategist
Przemyslaw Radomski, CFA
Founder, Editor-in-chief, Gold & Silver Fund Manager
Gold & Silver Trading Alerts
Forex Trading Alerts
Oil Investment Updates
Oil Trading Alerts

