

Earlier today, the USD Index extended gains and almost touched the Jul highs. How did this increase affected the technical picture of our six currencypairs?
In our opinion the following forex trading positions are justified - summary:
- EUR/USD: none
- GBP/USD: short (a stop-loss order at 1.3549 and initial downside target at 1.2231)
- USD/JPY: none
- USD/CAD: short (a stop-loss order at 1.3346; initial downside target at 1.2876)
- USD/CHF: none
- AUD/USD: short (a stop-loss order at 0.7791; initial downside target at 0.7516)
EUR/USD
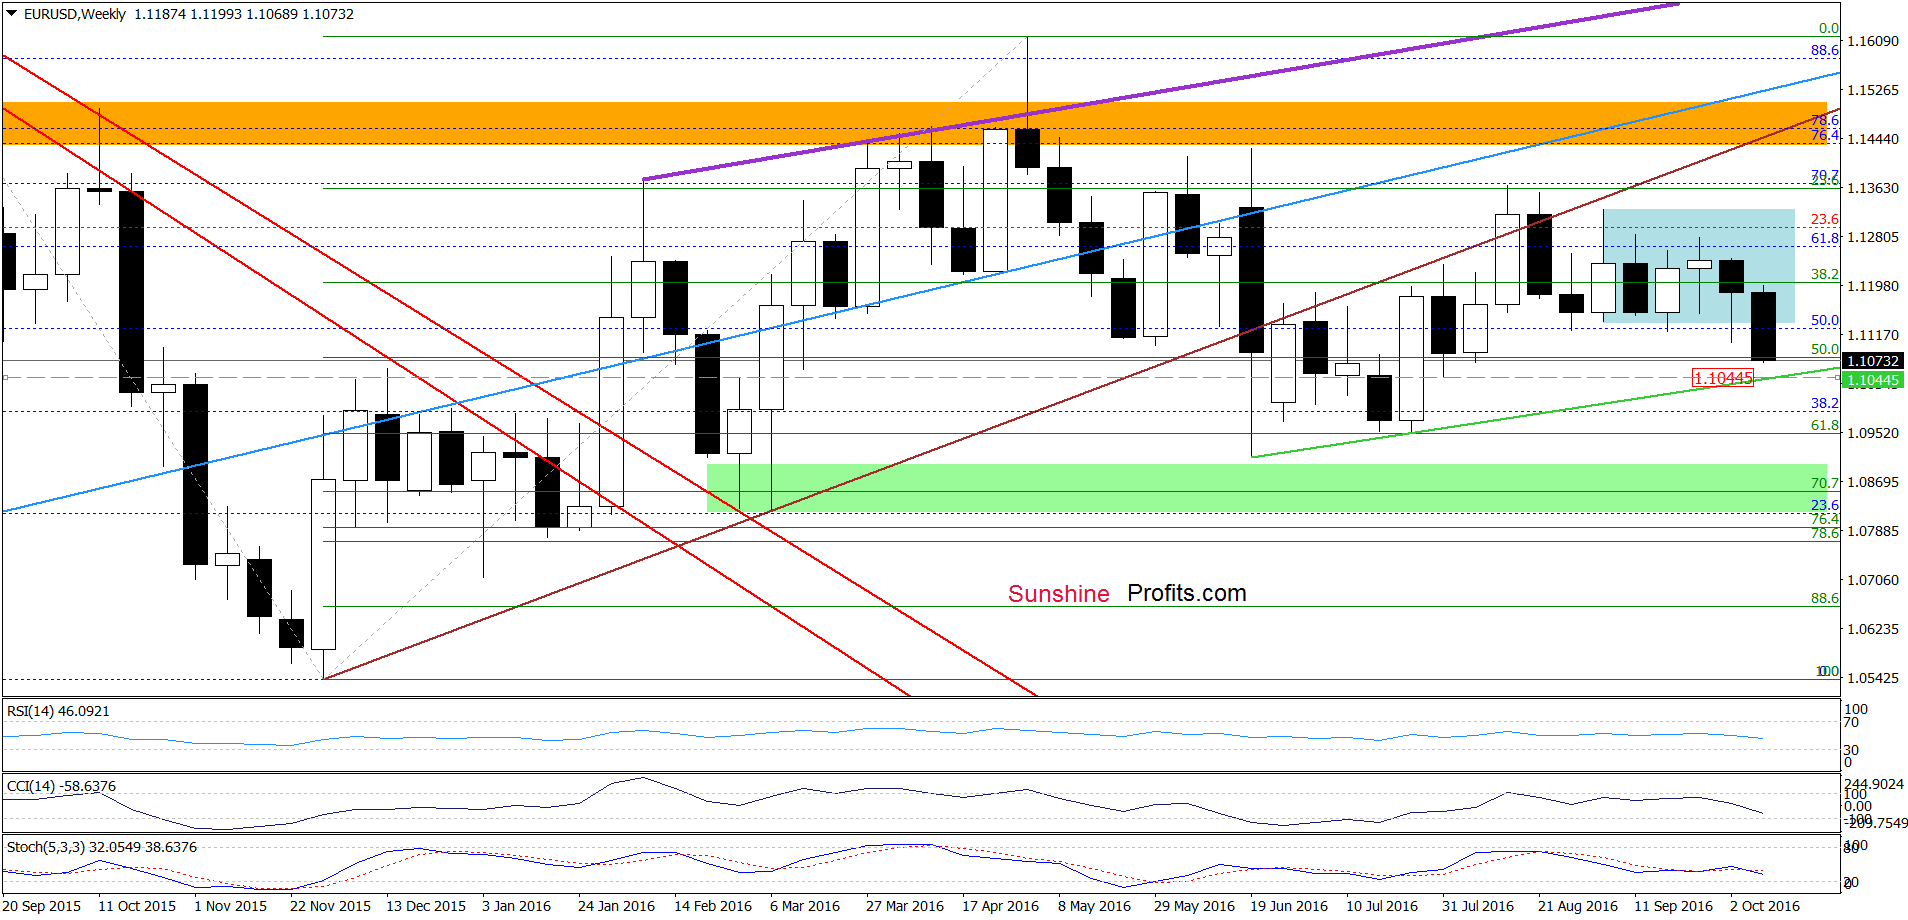
The first thing that catches the eye on the weekly chart is breakdown under the lower border of the blue consolidation, which suggests further deterioration and a test of the green support line based on the previous lows (around 1.1044) in the coming week.
How did this drop affect the very short-term picture? Let’s check.
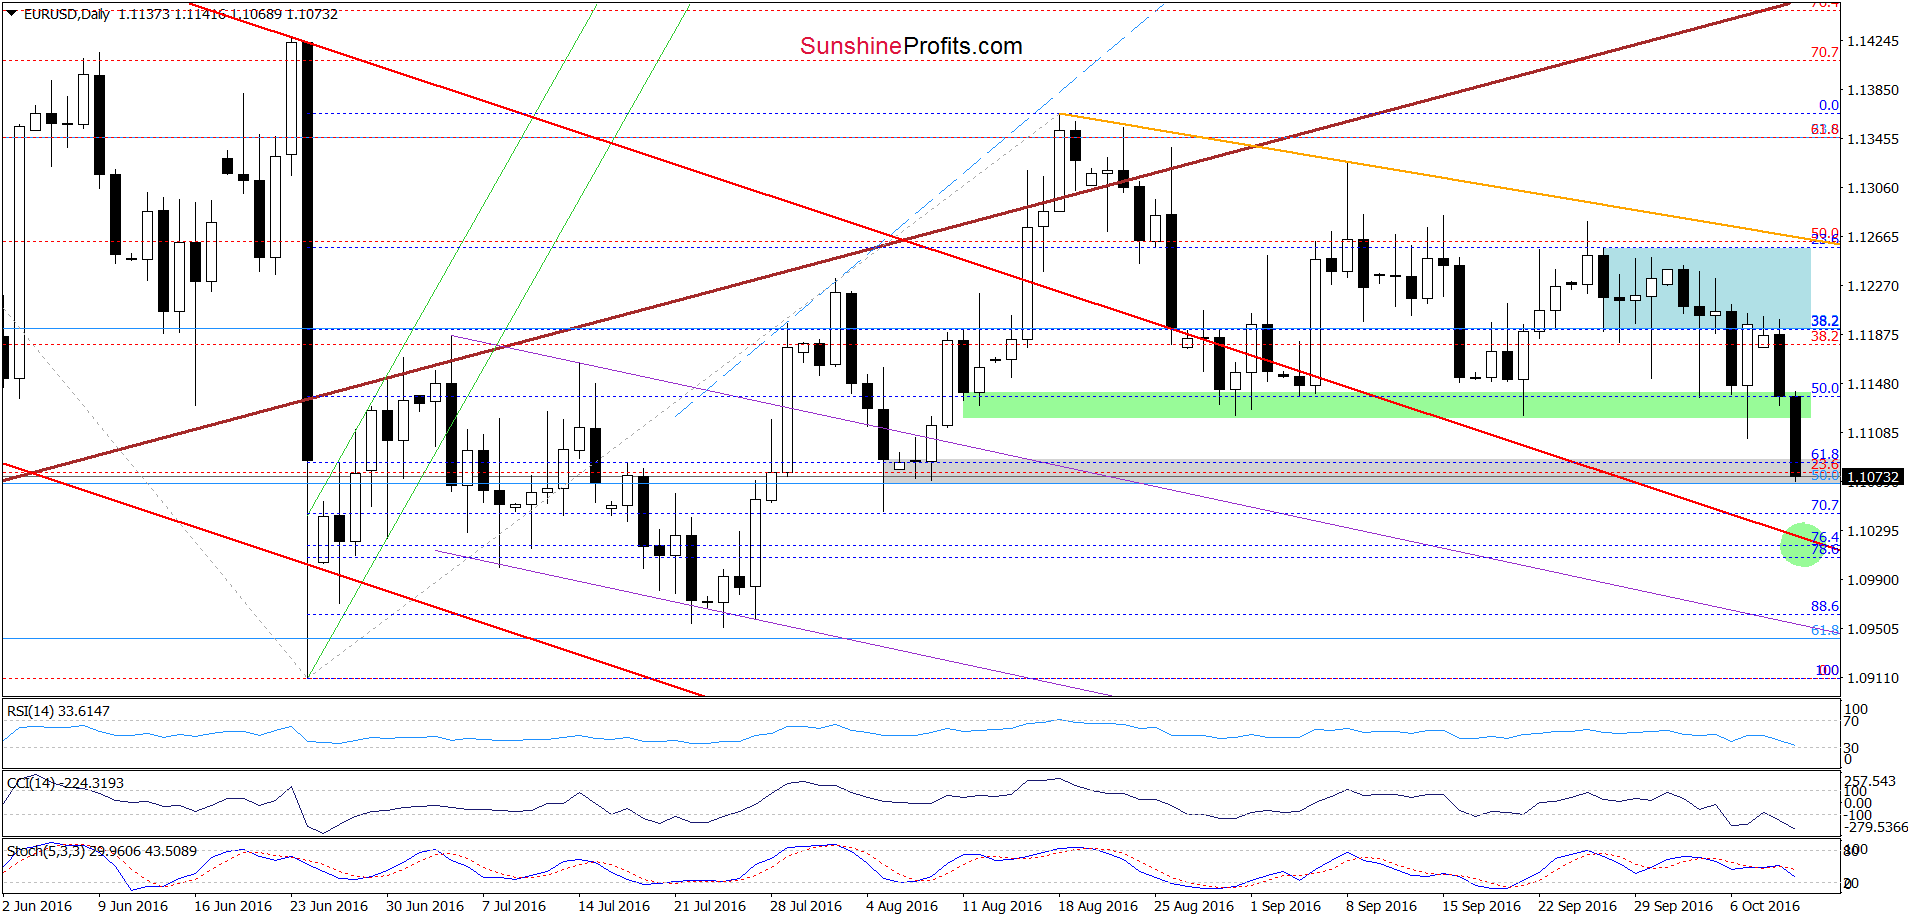
Looking at the daily chart we see that EUR/USD broke below the green zone, which triggered a sharp decline, which took the exchange rate to the grey support zone. What’s next? Taking into account the fact that the Stochastic Oscillator generated a sell signal, we think that currency bears will push the pair lower and test not only the green line marked on the weekly chart, but also the red declining line based on the May and Jun highs, which currently intersects the next support zone created by the 76.4% and 78.6% Fibonacci retracement levels (marked with a green circle on the daily chart).
Very short-term outlook: bearish
Short-term outlook: mixed
MT outlook: mixed
LT outlook: mixed
Trading position (short-term; our opinion): No positions are justified from the risk/reward perspective. We will keep you informed should anything change, or should we see a confirmation/invalidation of the above.
GBP/USD
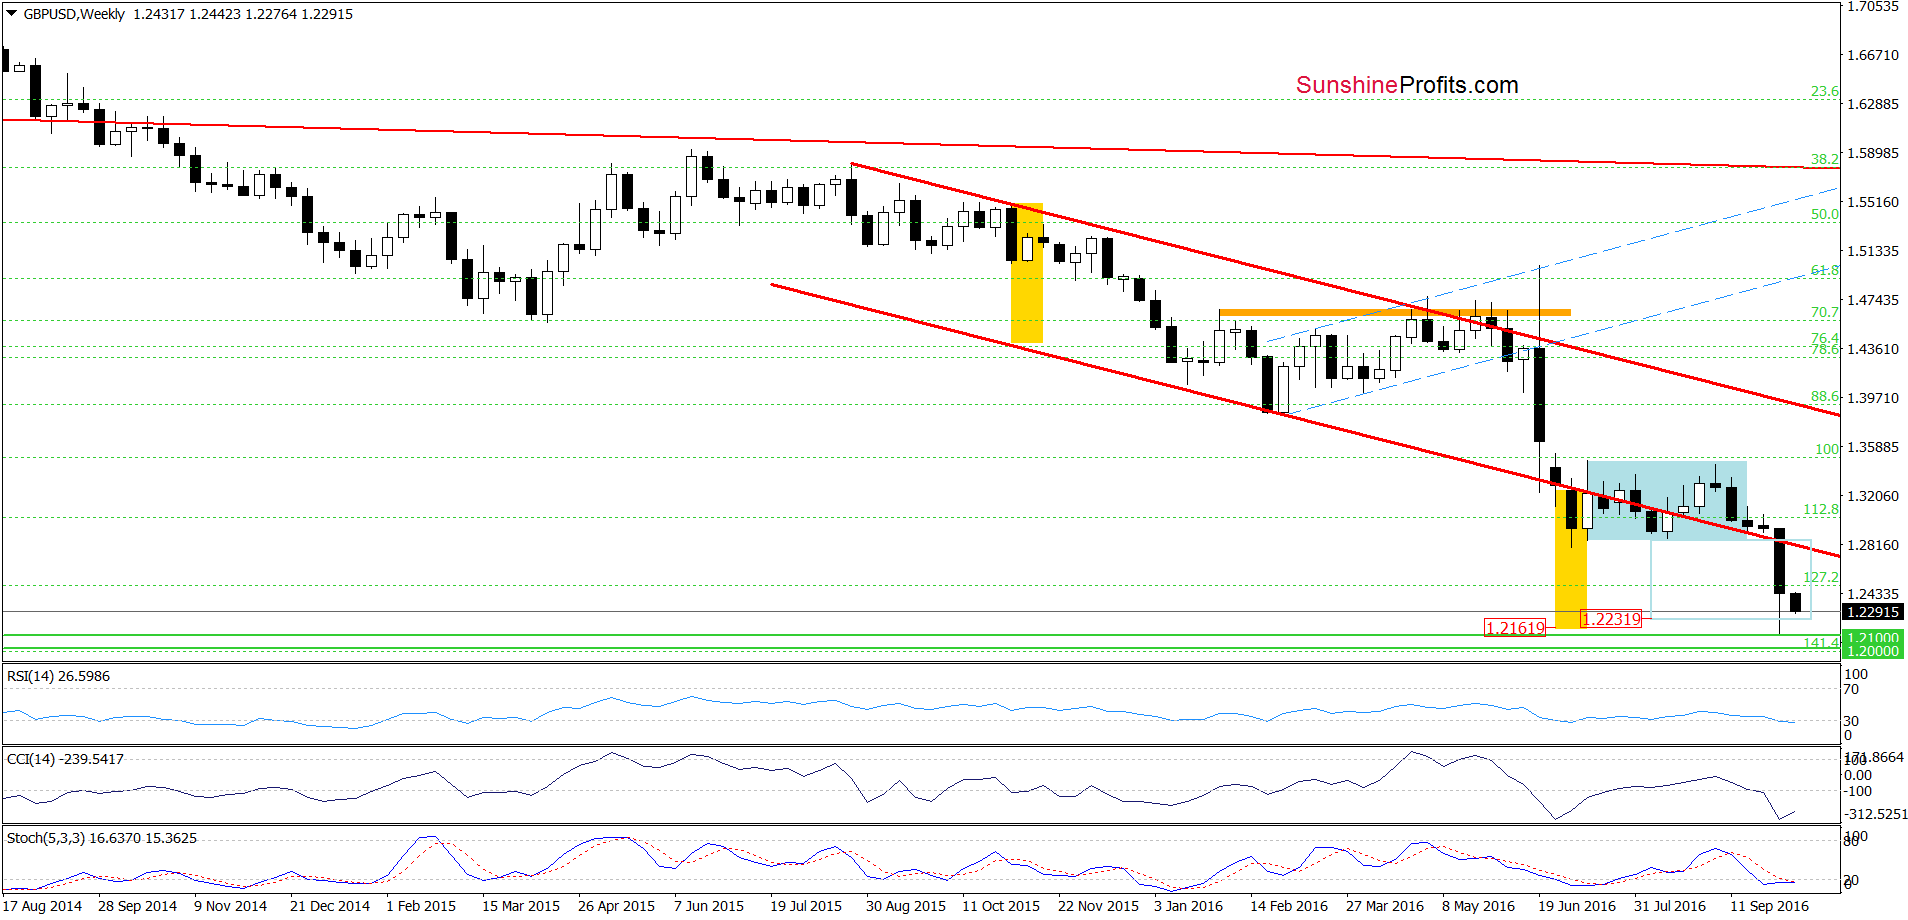
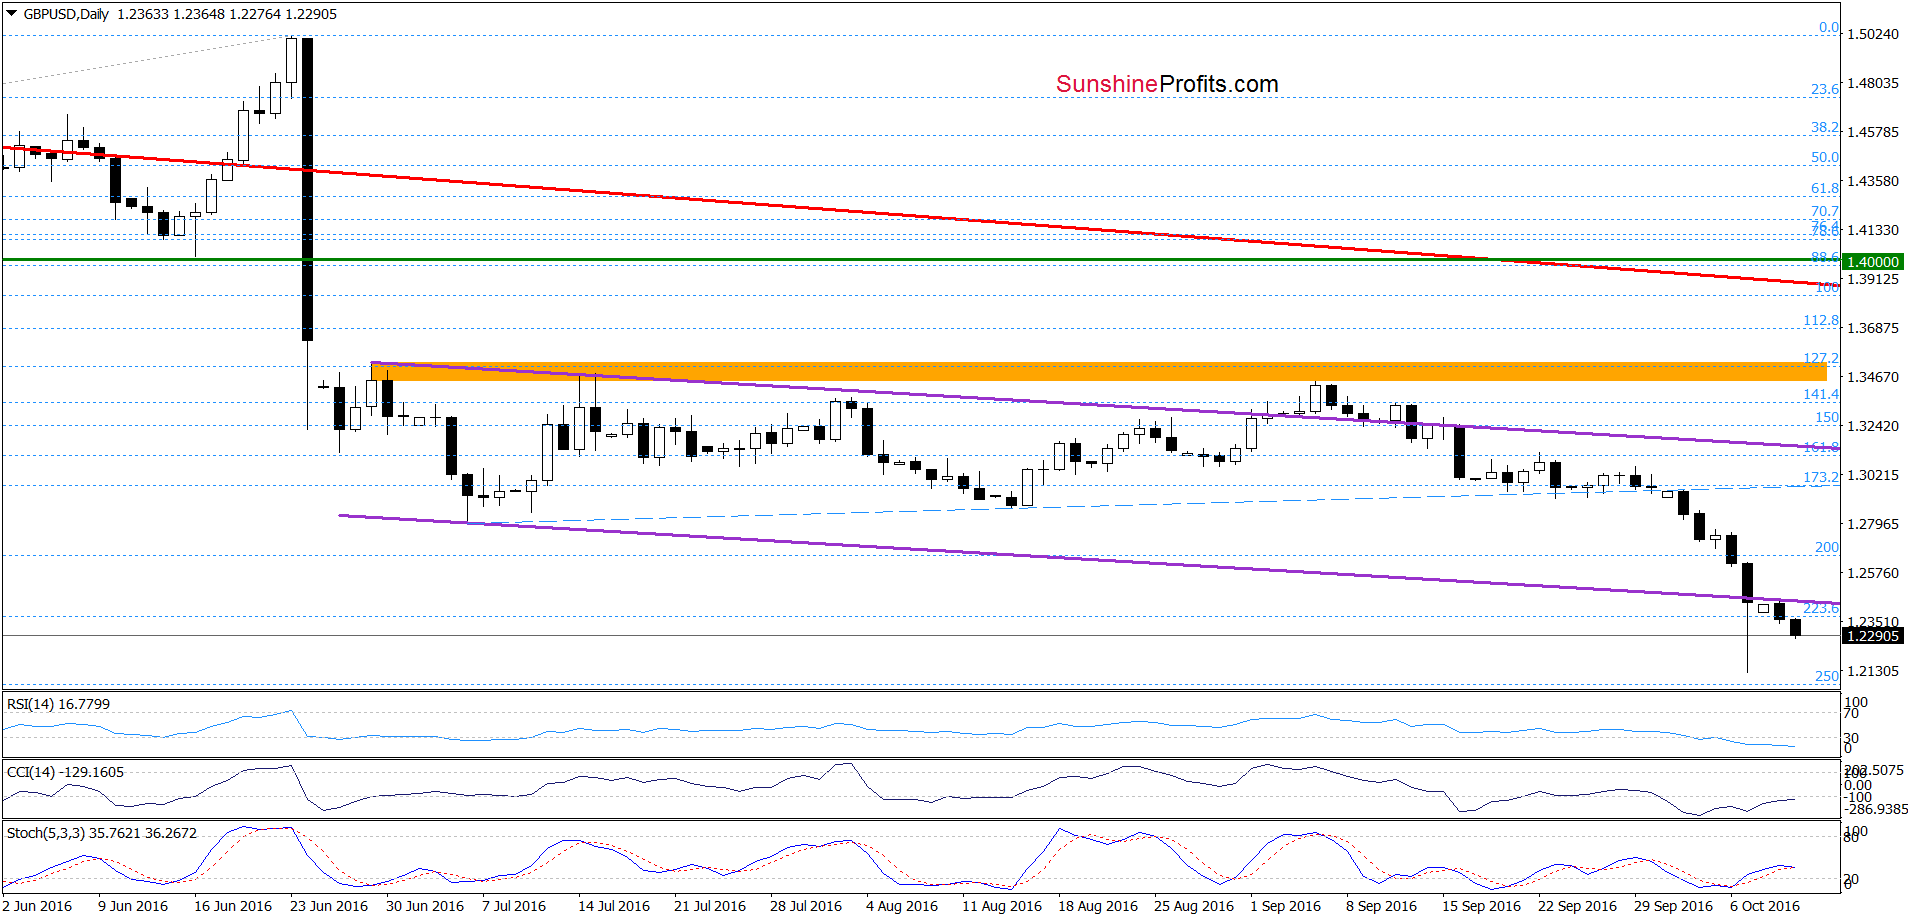
On the above charts, we see that GBP/USD extended losses earlier today, which means that our yesterday’s commentary is up-to-date:
(…) What’s next? Although the pair rebounded on Friday, we think that this upswing was just a verification of the breakdown under the lower border of the purple declining trend channel. If this is the case, the exchange rate will move lower once again and re-test the Friday low or even slip to around the barrier of 1.2000 in the coming week. If we see such price action, we’ll consider closing short positions. As always, we’ll keep you - our subscribers - informed should anything change.
Very short-term outlook: bearish
Short-term outlook: bearish
MT outlook: bearish
LT outlook: bearish
Trading position (short-term; our opinion): Short positions (with a stop-loss order at 1.3549 and initial downside target at 1.2231) are justified from the risk/reward perspective. We will keep you informed should anything change, or should we see a confirmation/invalidation of the above.
USD/JPY
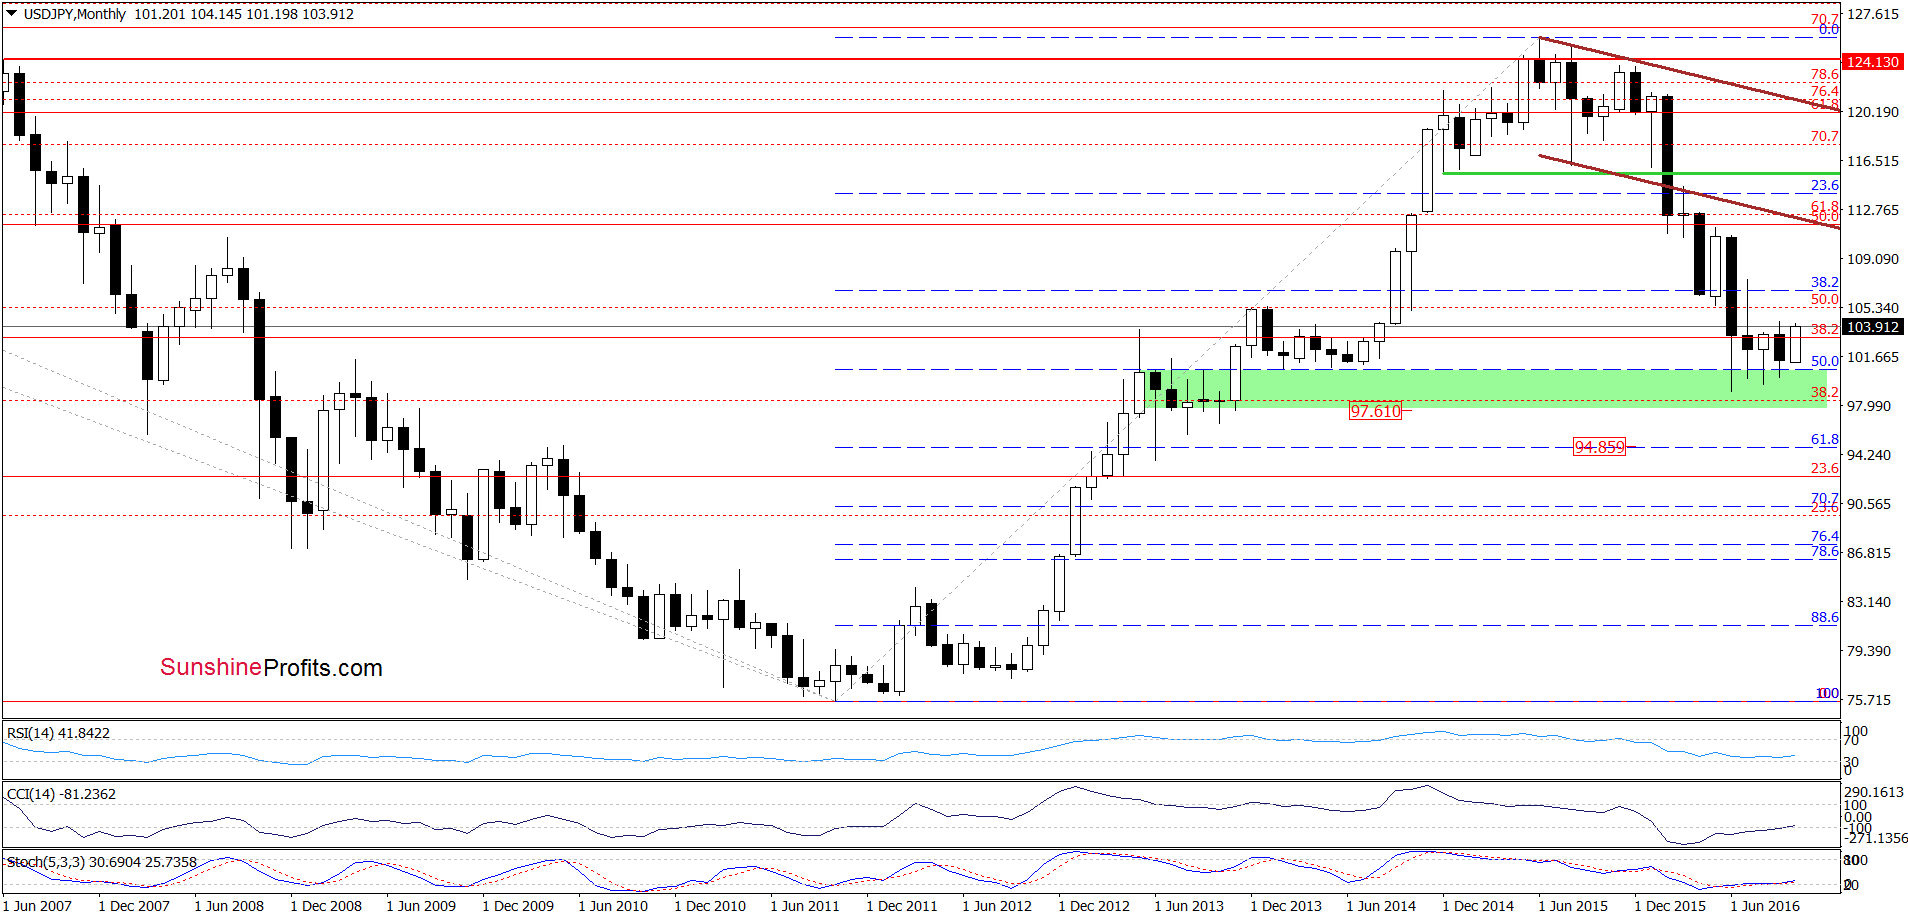
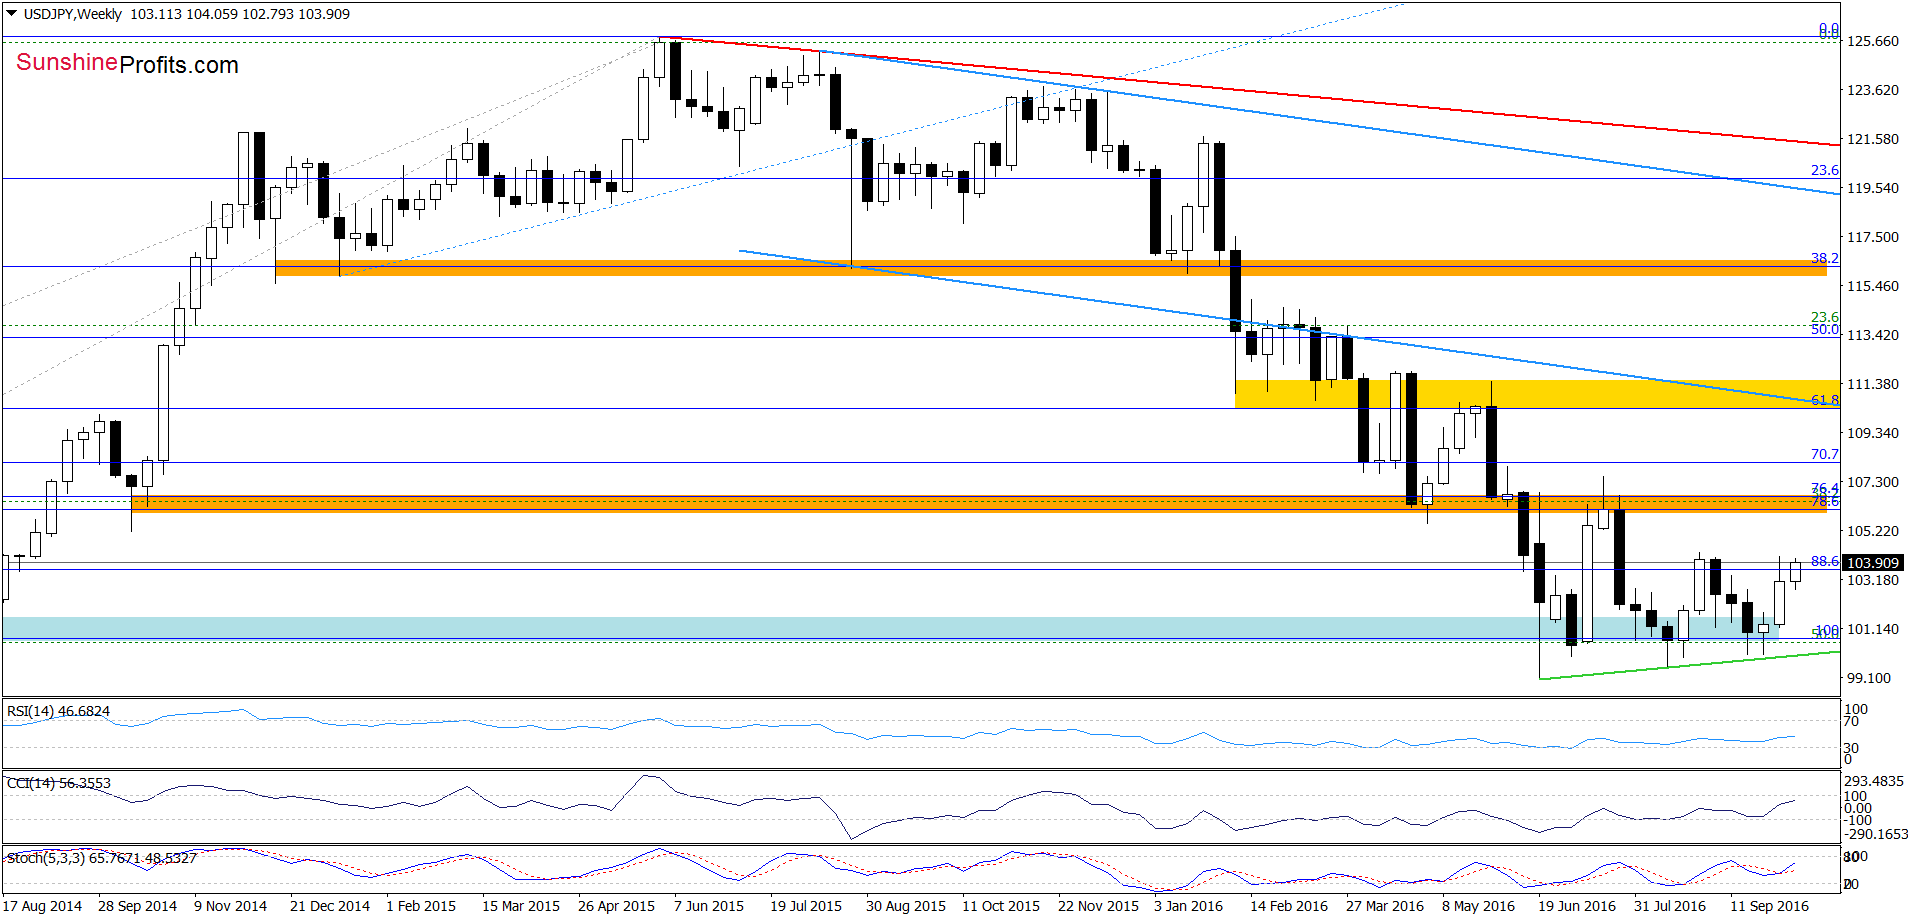
Looking at USD/JPY from the long- and medium-term perspective, we see that the overall situation hasn’t changed much as the exchange rate remains above the green support zone (marked on the monthly chart) and the green support line based on the Jun and Aug lows (seen on the weekly chart).
Is it possible that we’ll see a re-test of these support zones in the coming week? Let’s examine the daily chart and find out.
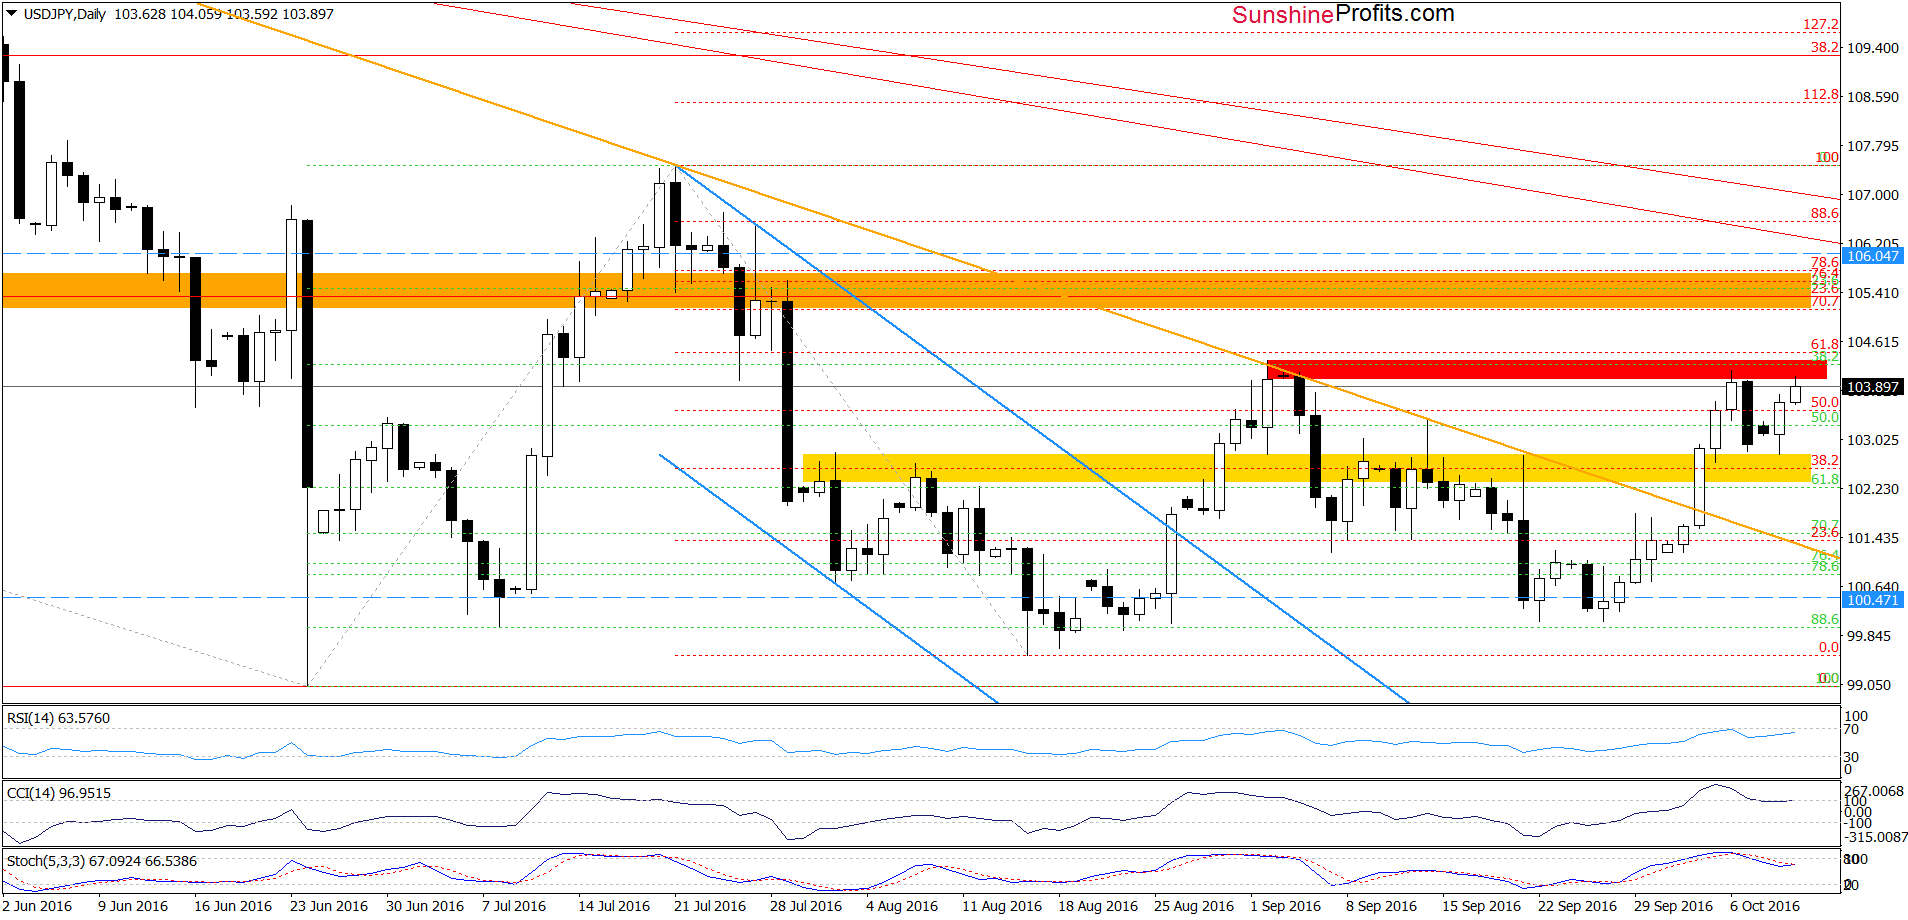
Looking at the daily chart, we see that the yellow zone (which serves now as the nearest support) encouraged currency bulls to act, which resulted in a re-test of the strength of the red resistance zone earlier today. Will we see a breakout above it? In our opinion, it is unlikely. Why? As you see, sell signals generated by the indicators remain in play, supporting currency bears and lower values of the exchange rate. Therefore, we think that another reversal from this area should not surprise us. If this is the case and we see such price action, the initial downside target would be the yellow zone. However if it is broken, USD/JPY may test the previously-broken orange declining line, which serves now as another support.
Very short-term outlook: bearish
Short-term outlook: mixed
MT outlook: mixed
LT outlook: mixed
Trading position (short-term; our opinion): No positions are justified from the risk/reward perspective. We will keep you informed should anything change, or should we see a confirmation/invalidation of the above.
USD/CAD
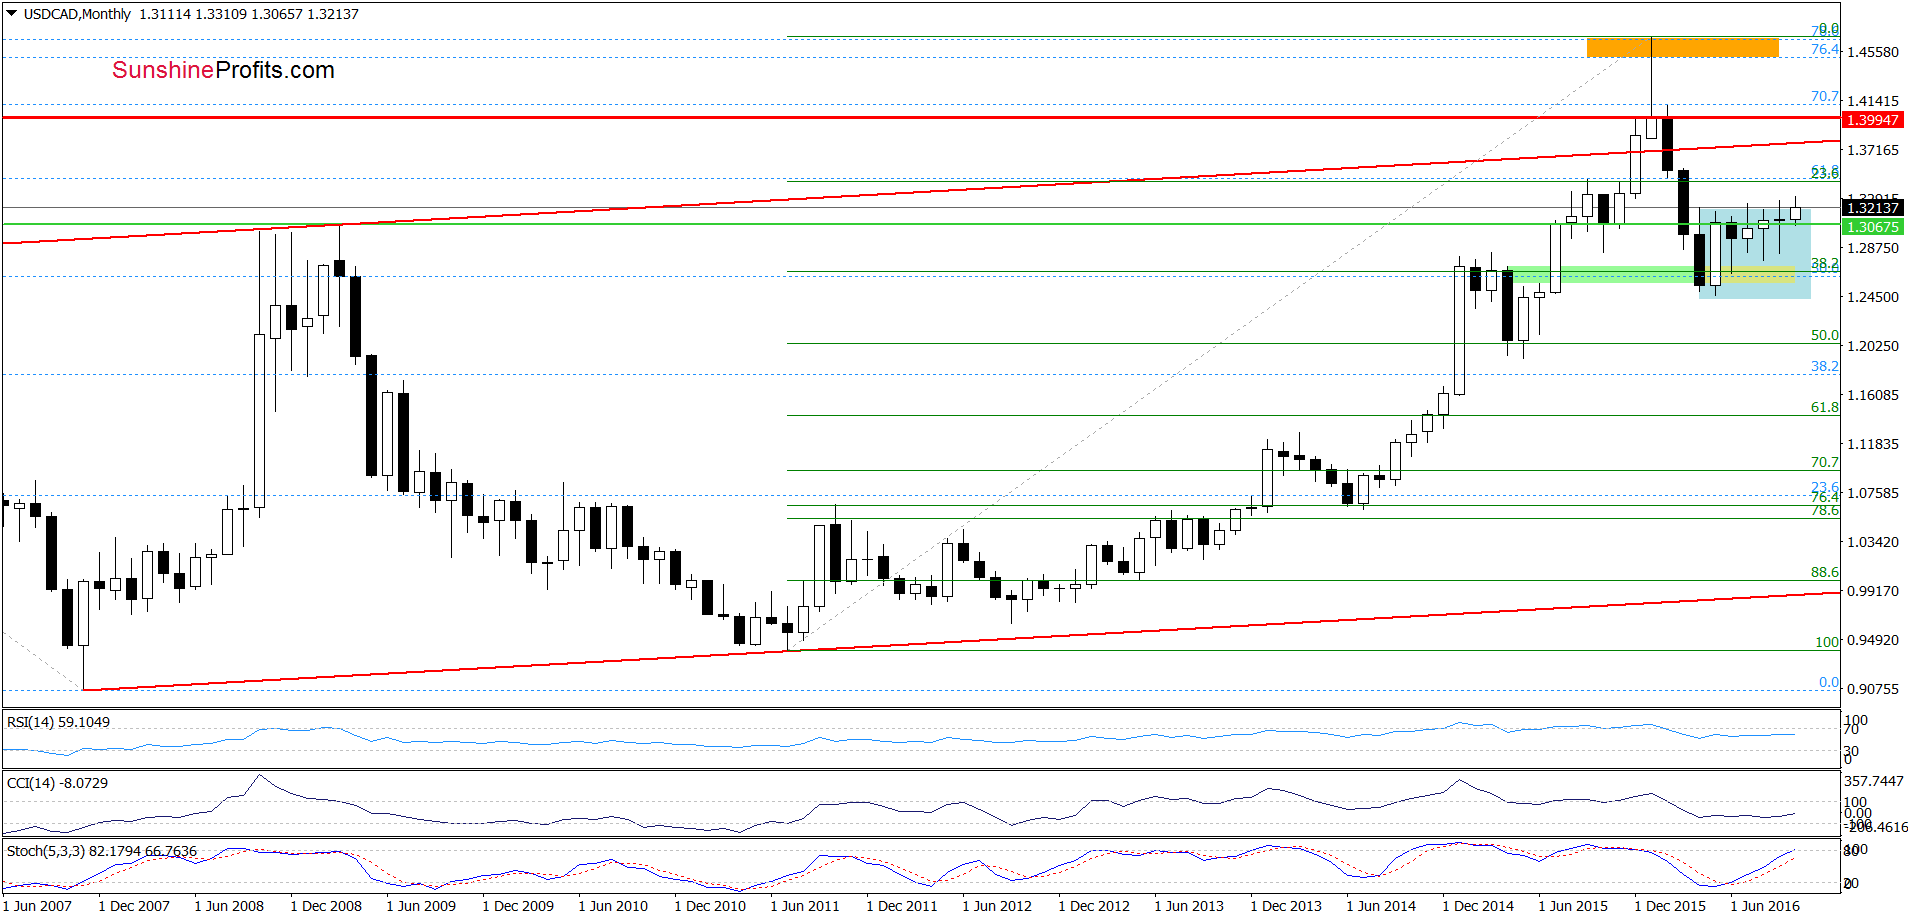
On the long-term chart, we see that USD/CAD remains near the upper border of the blue consolidation. Today, we’ll focus on the very short-term changes.
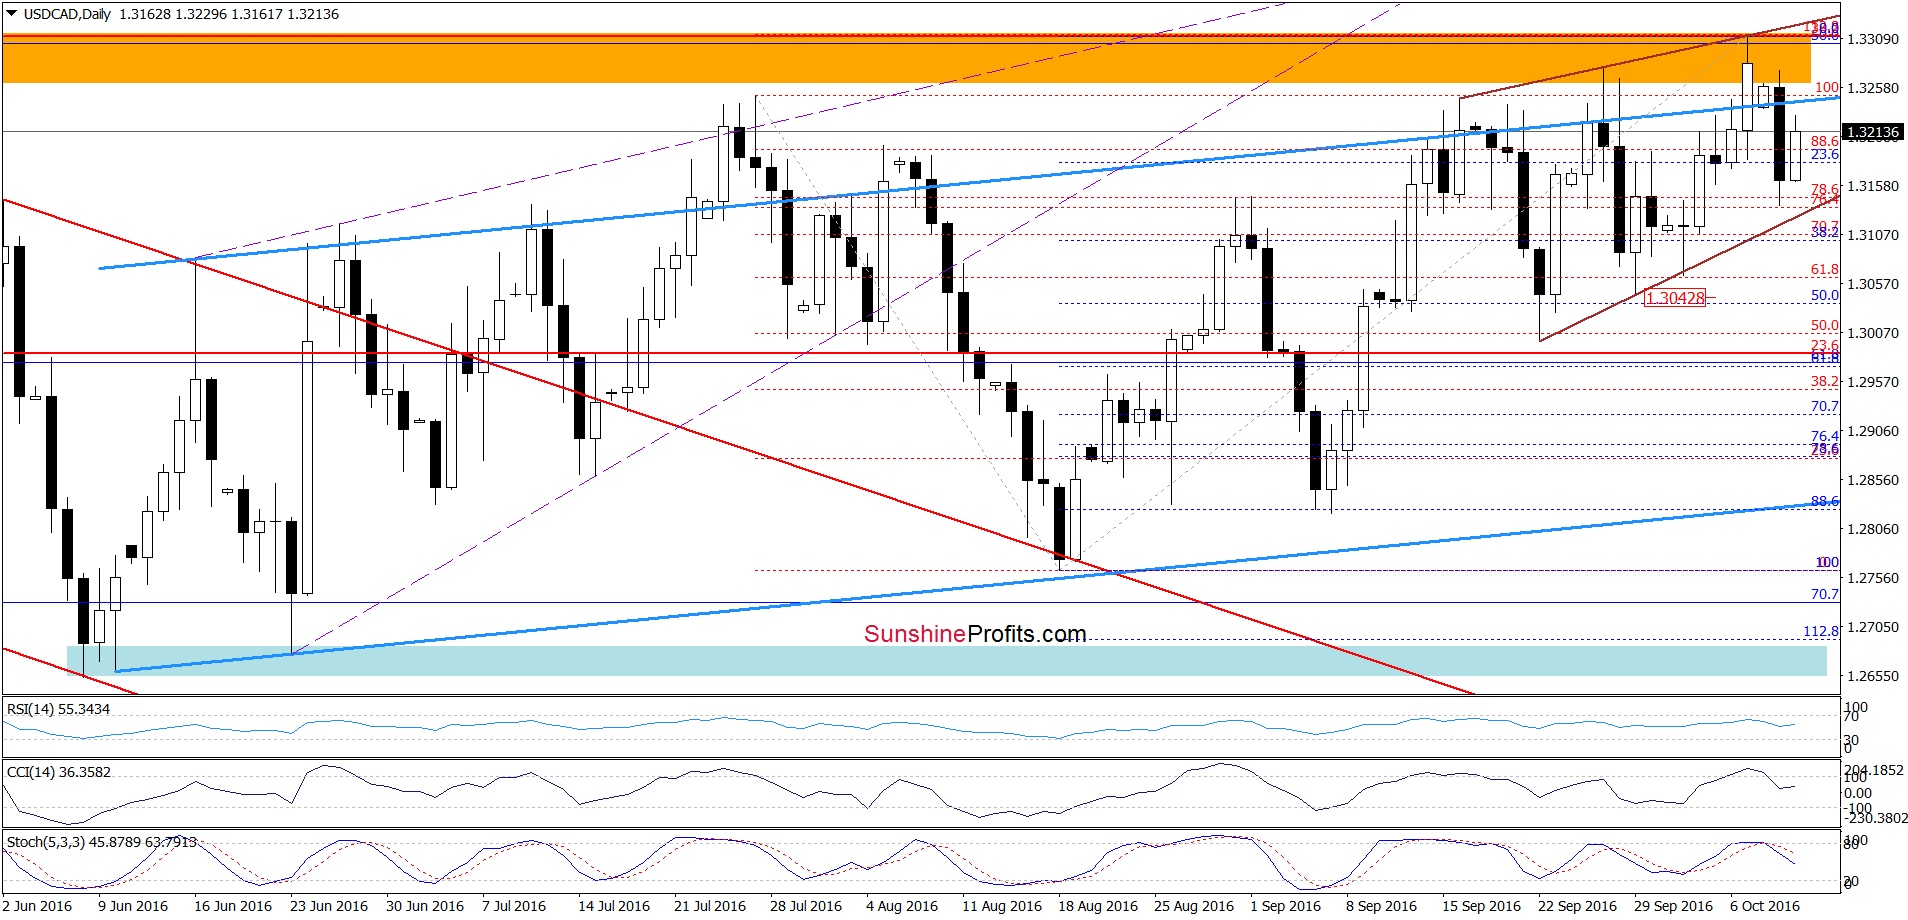
On the daily chart, we see that although USD/CAD rebounded earlier today, the pair remains under the orange resistance zone and the previously-broken upper border of the brown rising wedge, which in combination with sell signals generated by the indictors suggests another attempt to move lower. If this is the case and USD/CAD moves lower from current levels, the initial downside target would be the lower border of the brown rising wedge. If this support is broken, the next downside target would be around 1.3027-1.3046, where the previous lows and the 50% Fibonacci retracement are.
Very short-term outlook: bearish
Short-term outlook: bearish
MT outlook: mixed
LT outlook: mixed with bearish bias
Trading position (short-term; our opinion): Short positions (with a stop-loss order at 1.3346 and initial downside target at 1.2876) are justified from the risk/reward perspective. We will keep you informed should anything change, or should we see a confirmation/invalidation of the above.
USD/CHF
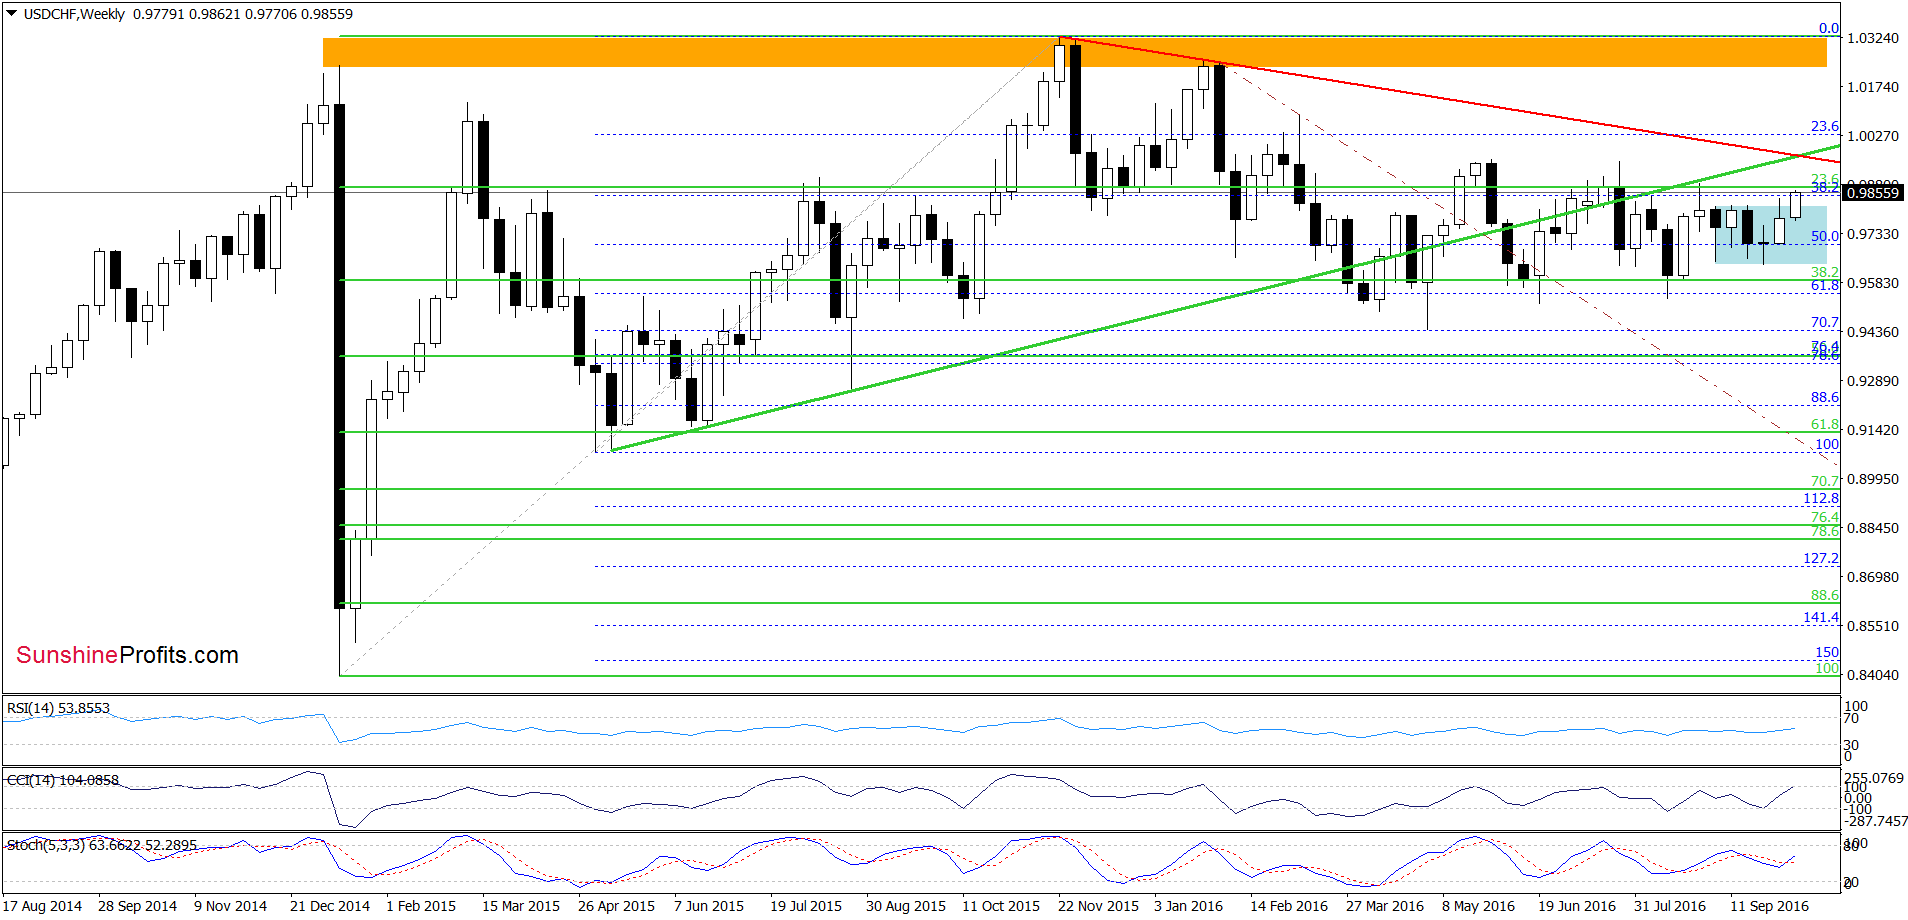
Looking at the weeky chart, we see that USD/CHF broke above the upper line of the consolidation, which in combinatin with a buy signal generated by the Stochastic Oscillator suggests further improvement.
How high could the exchange rate go in the coming days? Let’s exaine the daily chart and find out.
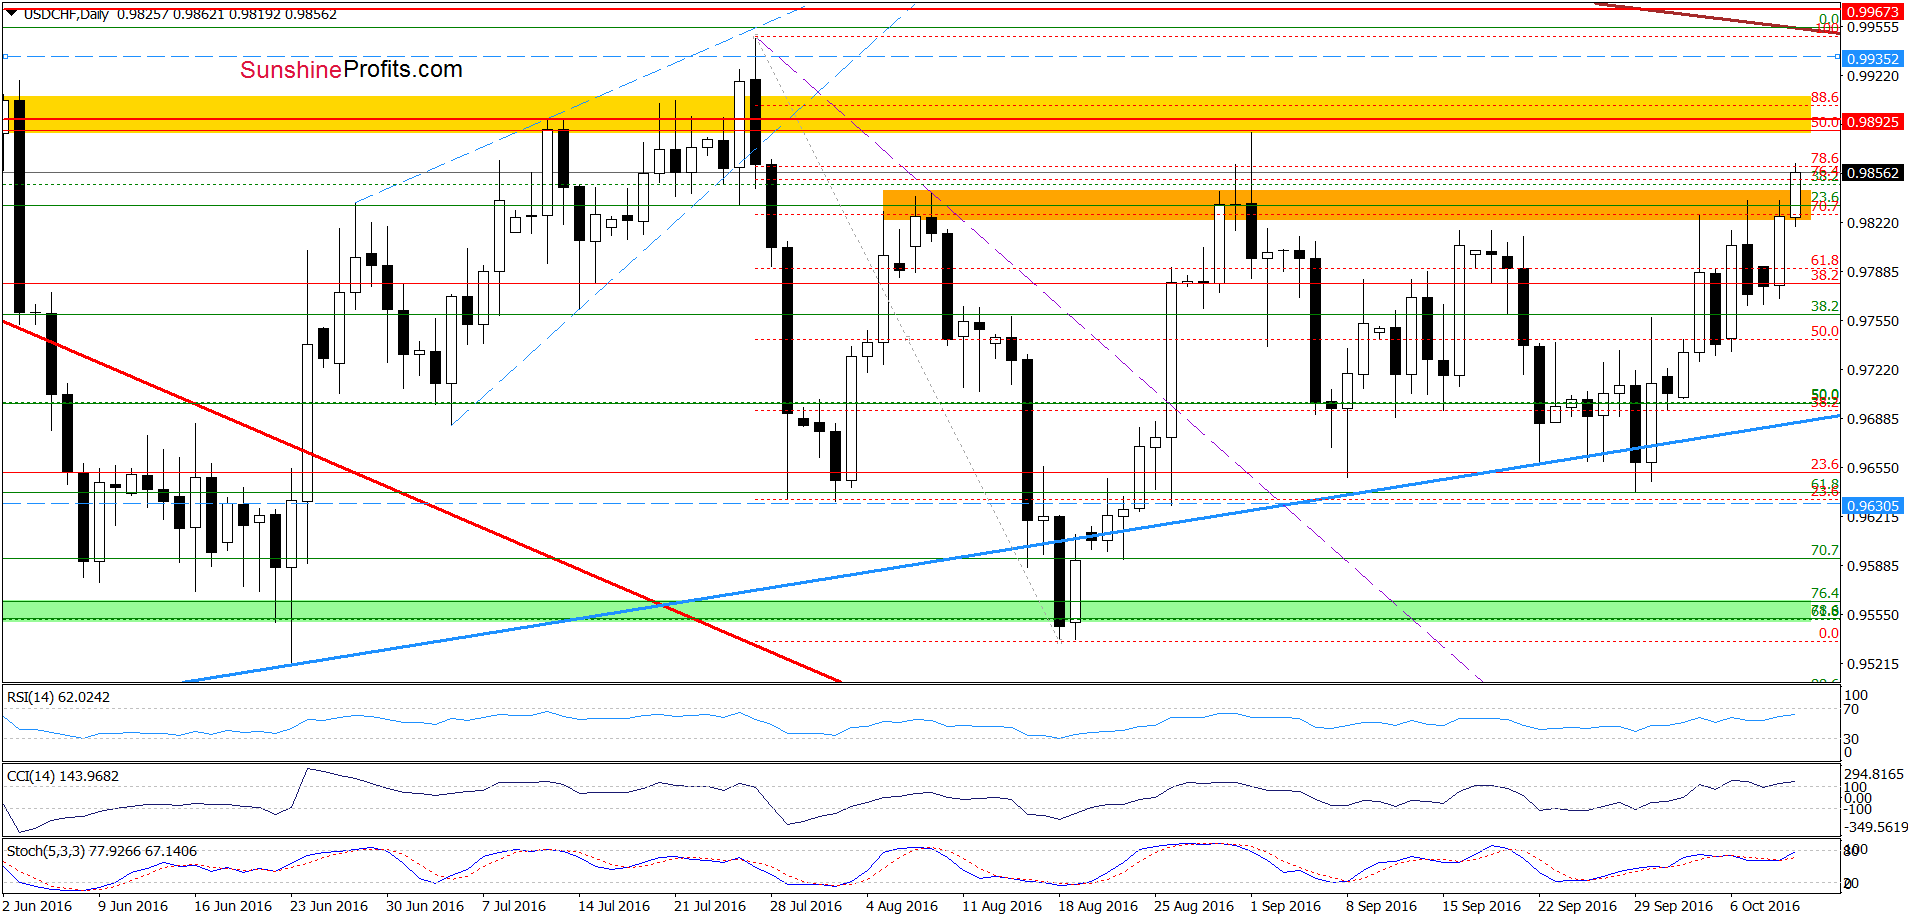
On the daily chart, we see that the pair extended gains and broke above the orange resistance zone, which is a bullish signal (especially when we take into account the importance of this zone - in previous weeks, this area was strong enough to stop upward moves several times) that suggests further improvement and a test of the yellow zone or even the Jul high in the coming days.
Very short-term outlook: bullish
Short-term outlook: mixed with bullish bias
MT outlook: mixed
LT outlook: mixed
Trading position (short-term; our opinion): No positions are justified from the risk/reward perspective. We will keep you informed should anything change, or should we see a confirmation/invalidation of the above.
AUD/USD
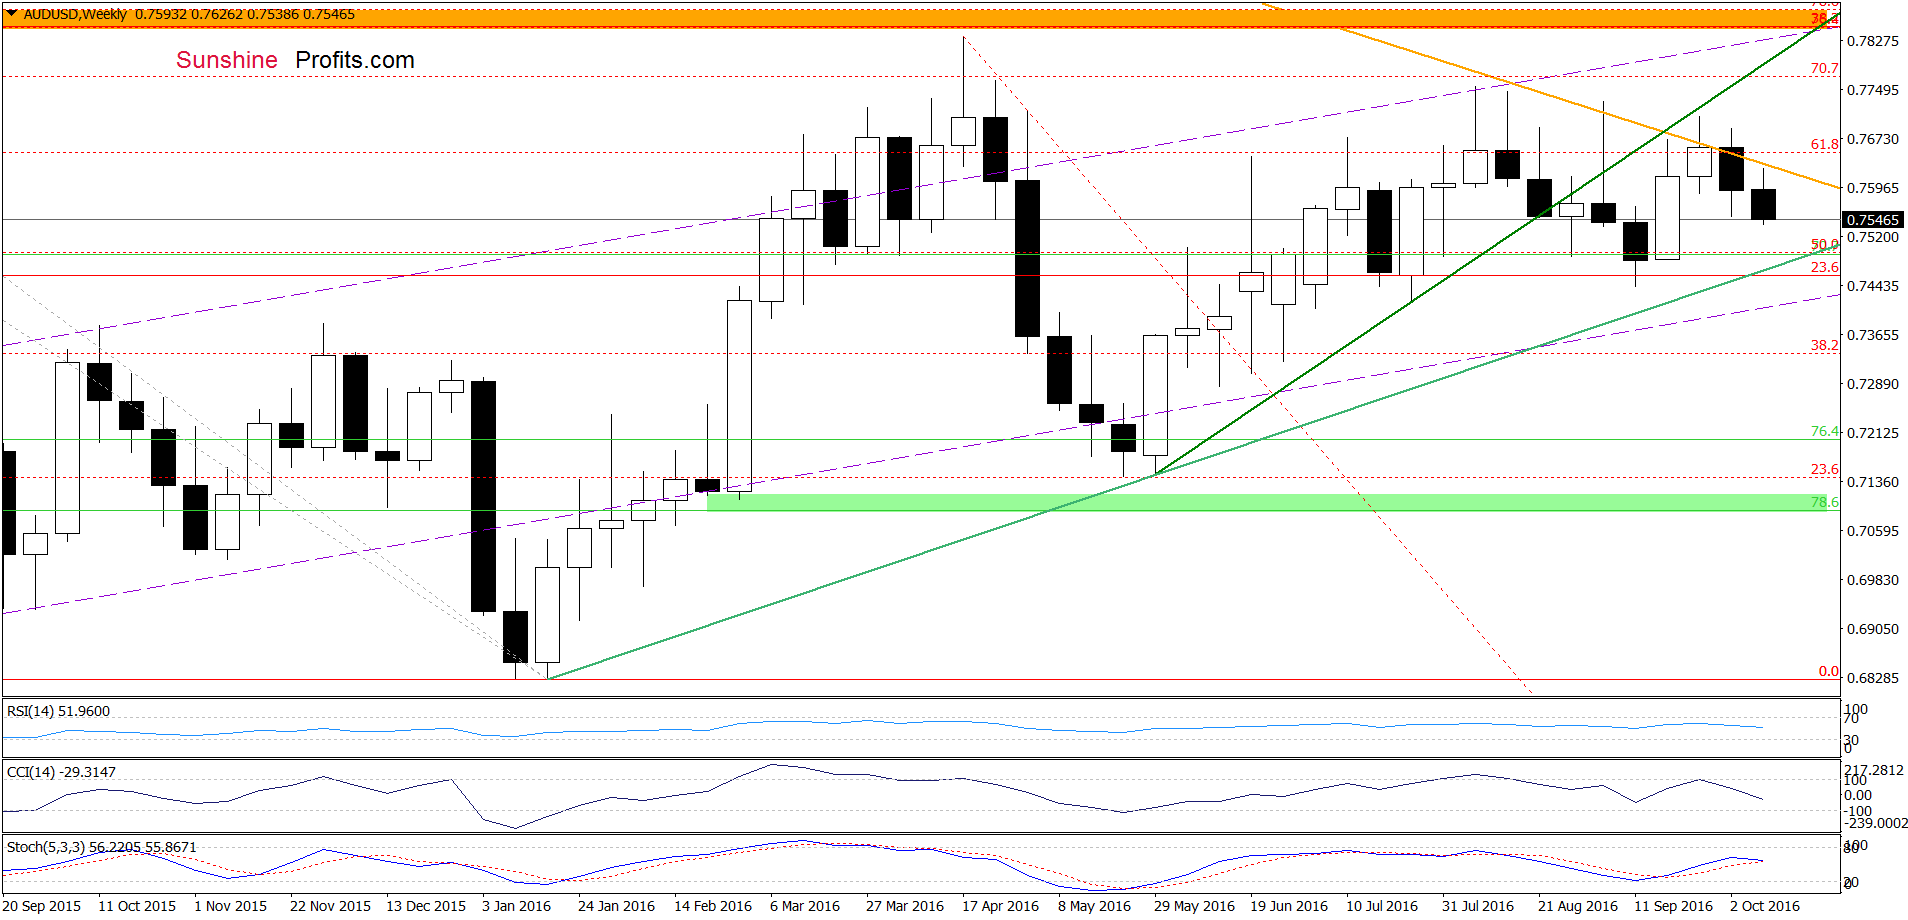
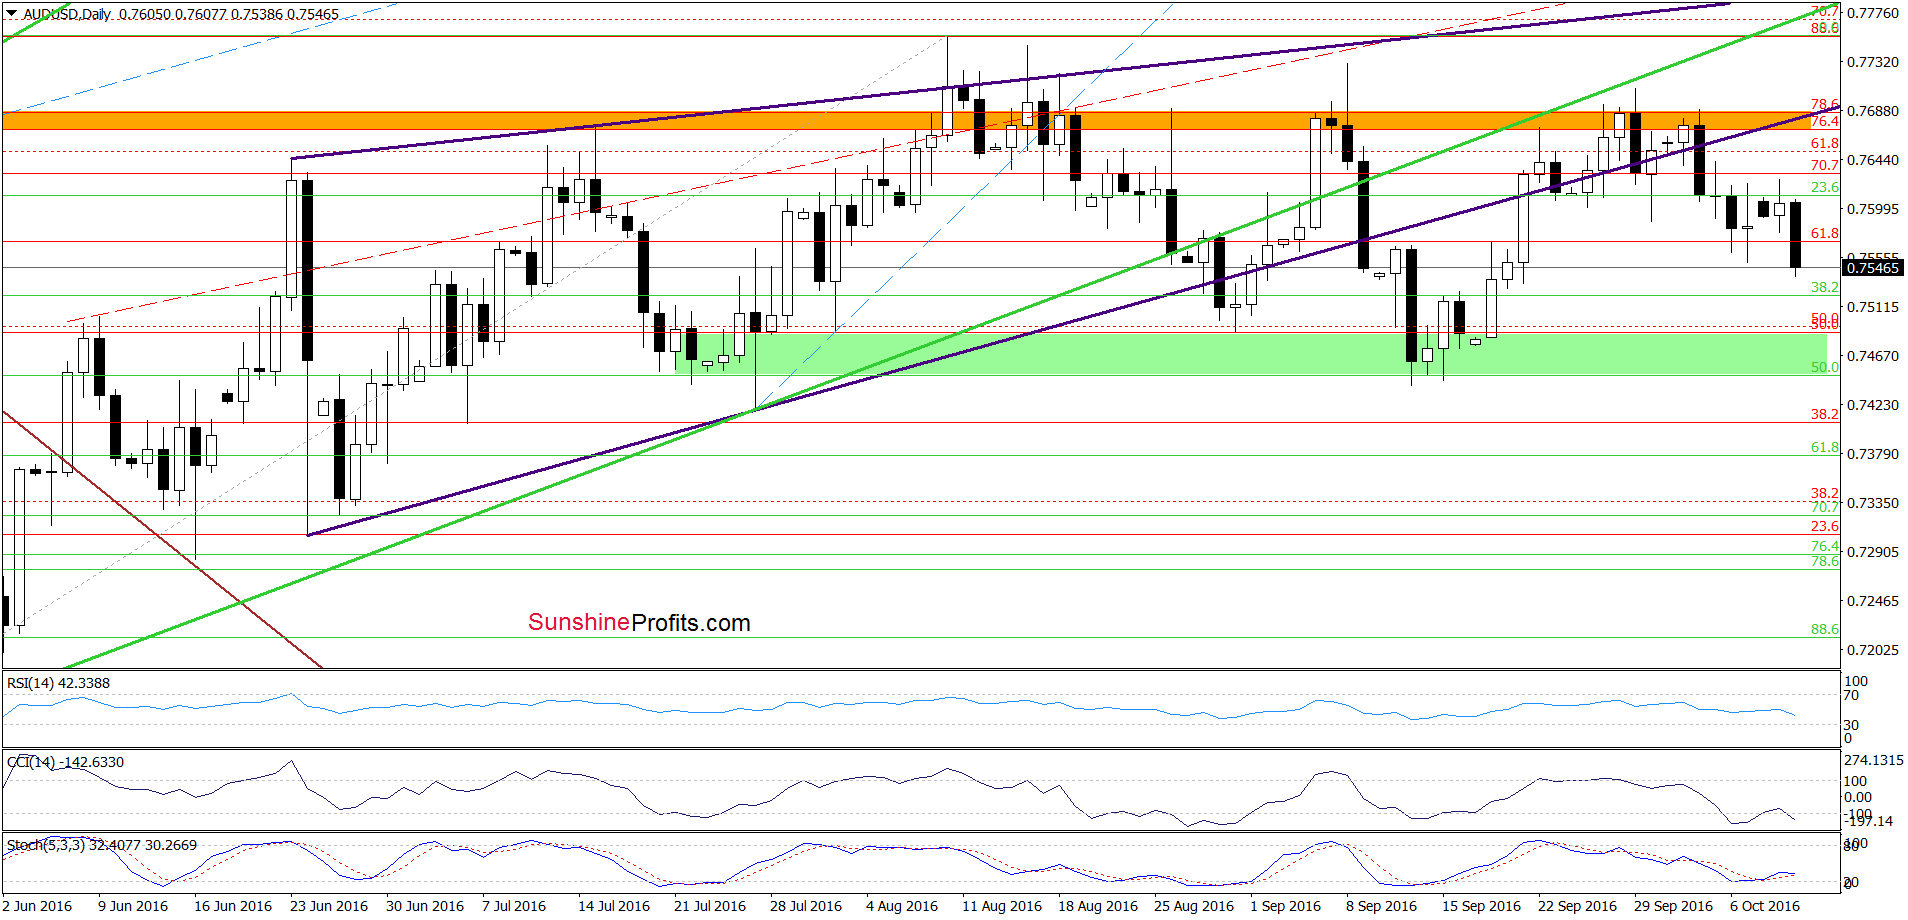
On the above charts, we see that although AUD/USD paused yesterday, currency bears didn’ give up, which resulted in further deterioration earlier today. Taking this fact into account, we believe that our last commentary on this currency pair remains valid:
(…) the medium-term green rising line, the long-term declining orange resistance line (both marked on the weekly chart) and the orange resistance zone (seen on the daily chart) coninue to keep gains in check. Additionally, sell signals generated by the indicators are still in play, which suggests that another attempt to move lower is just around the corner.
If the pair extends losses from current levels, we think that the initial downside target would be around 0.7516, where the 70.7% Fibonacci retracement (based on the Sep upward move) is.
Very short-term outlook: bearish
Short-term outlook: mixed with bearish bias
MT outlook: mixed with bearish bias
LT outlook: mixed
Trading position (short-term; our opinion): Short positions (with a stop-loss order at 0.7791 and initial downside target at 0.7516) are justified from the risk/reward perspective. We will keep you informed should anything change, or should we see a confirmation/invalidation of the above.
Thank you.
Nadia Simmons
Forex & Oil Trading Strategist
Przemyslaw Radomski, CFA
Founder, Editor-in-chief, Gold & Silver Fund Manager
Gold & Silver Trading Alerts
Forex Trading Alerts
Oil Investment Updates
Oil Trading Alerts

