

Earlier today, the U.S. dollar moved sharply lower against its Canadian counterpart after the U.S. Labor Department showed that the economy added 156,000 jobs in Sep, missing expectations for a 175,000 increase. Additionally, the unemployment rate ticked up to 5.0% last month, which disappointed market participants and pushed the USD Index below 97. How did this drop affected the current picture of USD/CAD?
In our opinion the following forex trading positions are justified - summary:
- EUR/USD: none
- GBP/USD: short (a stop-loss order at 1.3549 and initial downside target at 1.2231)
- USD/JPY: none
- USD/CAD: short (a stop-loss order at 1.3346; initial downside target at 1.2876)
- USD/CHF: none
- AUD/USD: short (a stop-loss order at 0.7791; initial downside target at 0.7516)
EUR/USD
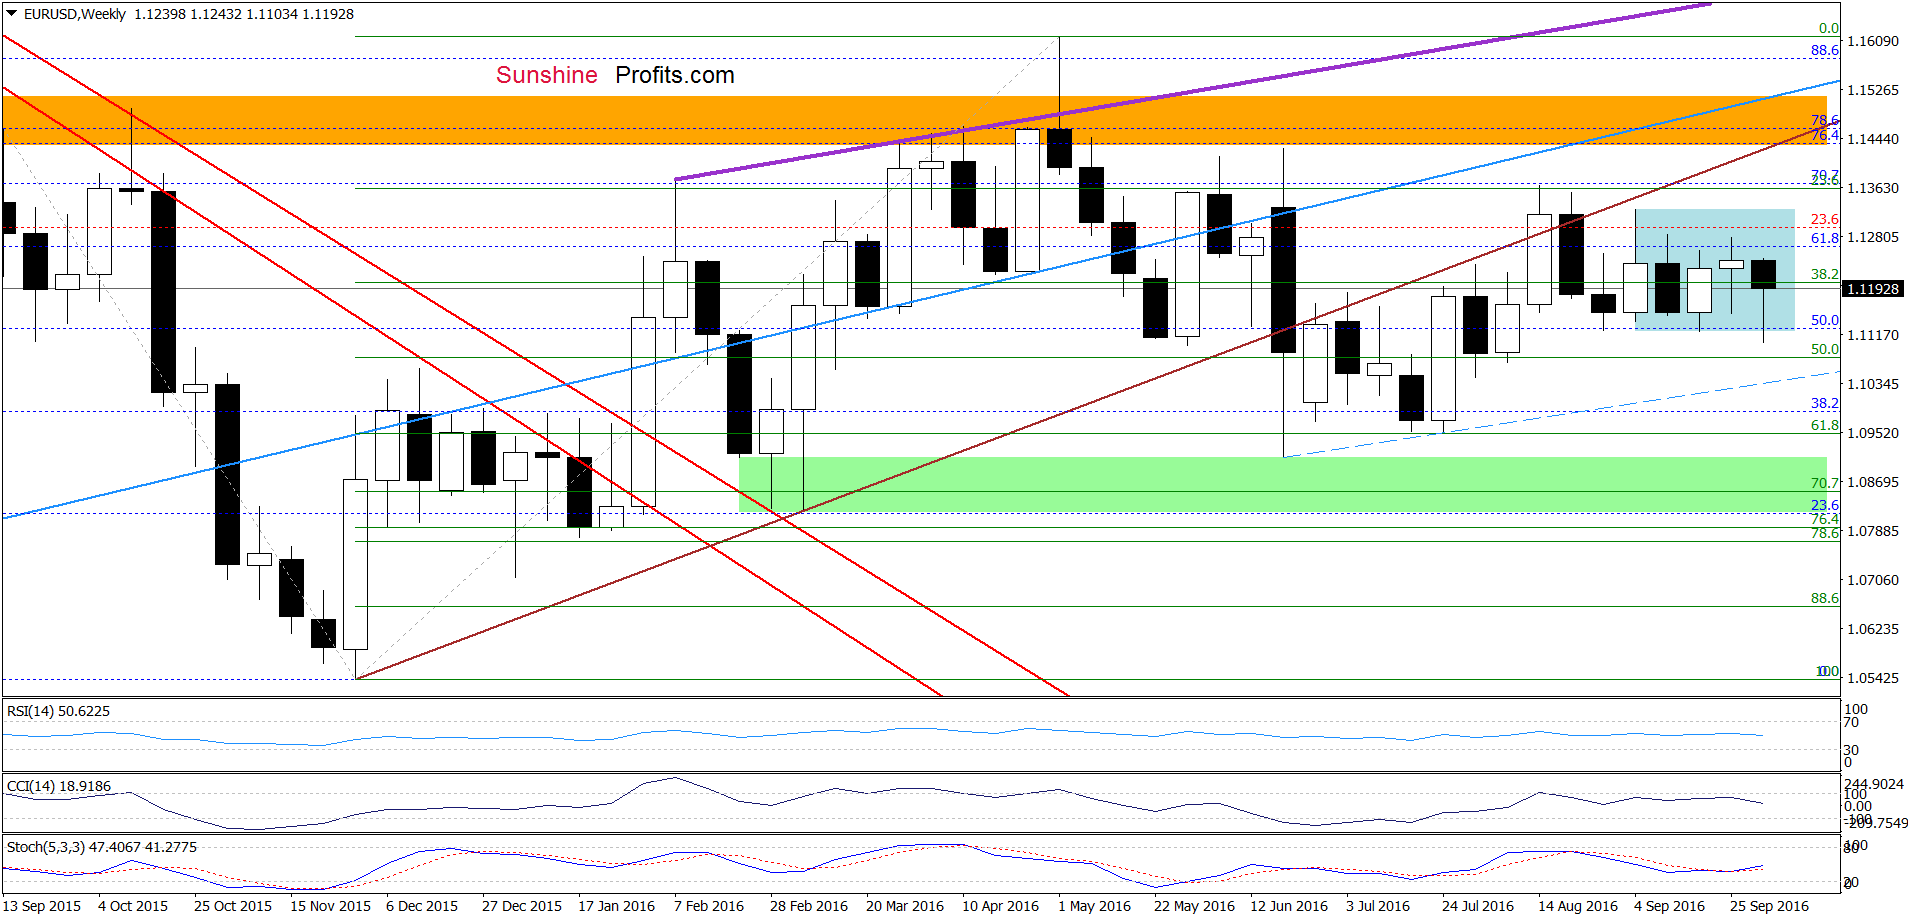
From today’s point of view, we see that the situation in the medium term hasn’t changed much as EUR/USD remains in a consolidation between the Sep high and low.
Will the very short-term chart give us more clues about future moves? Let’s check.
Quoting our previous alert:
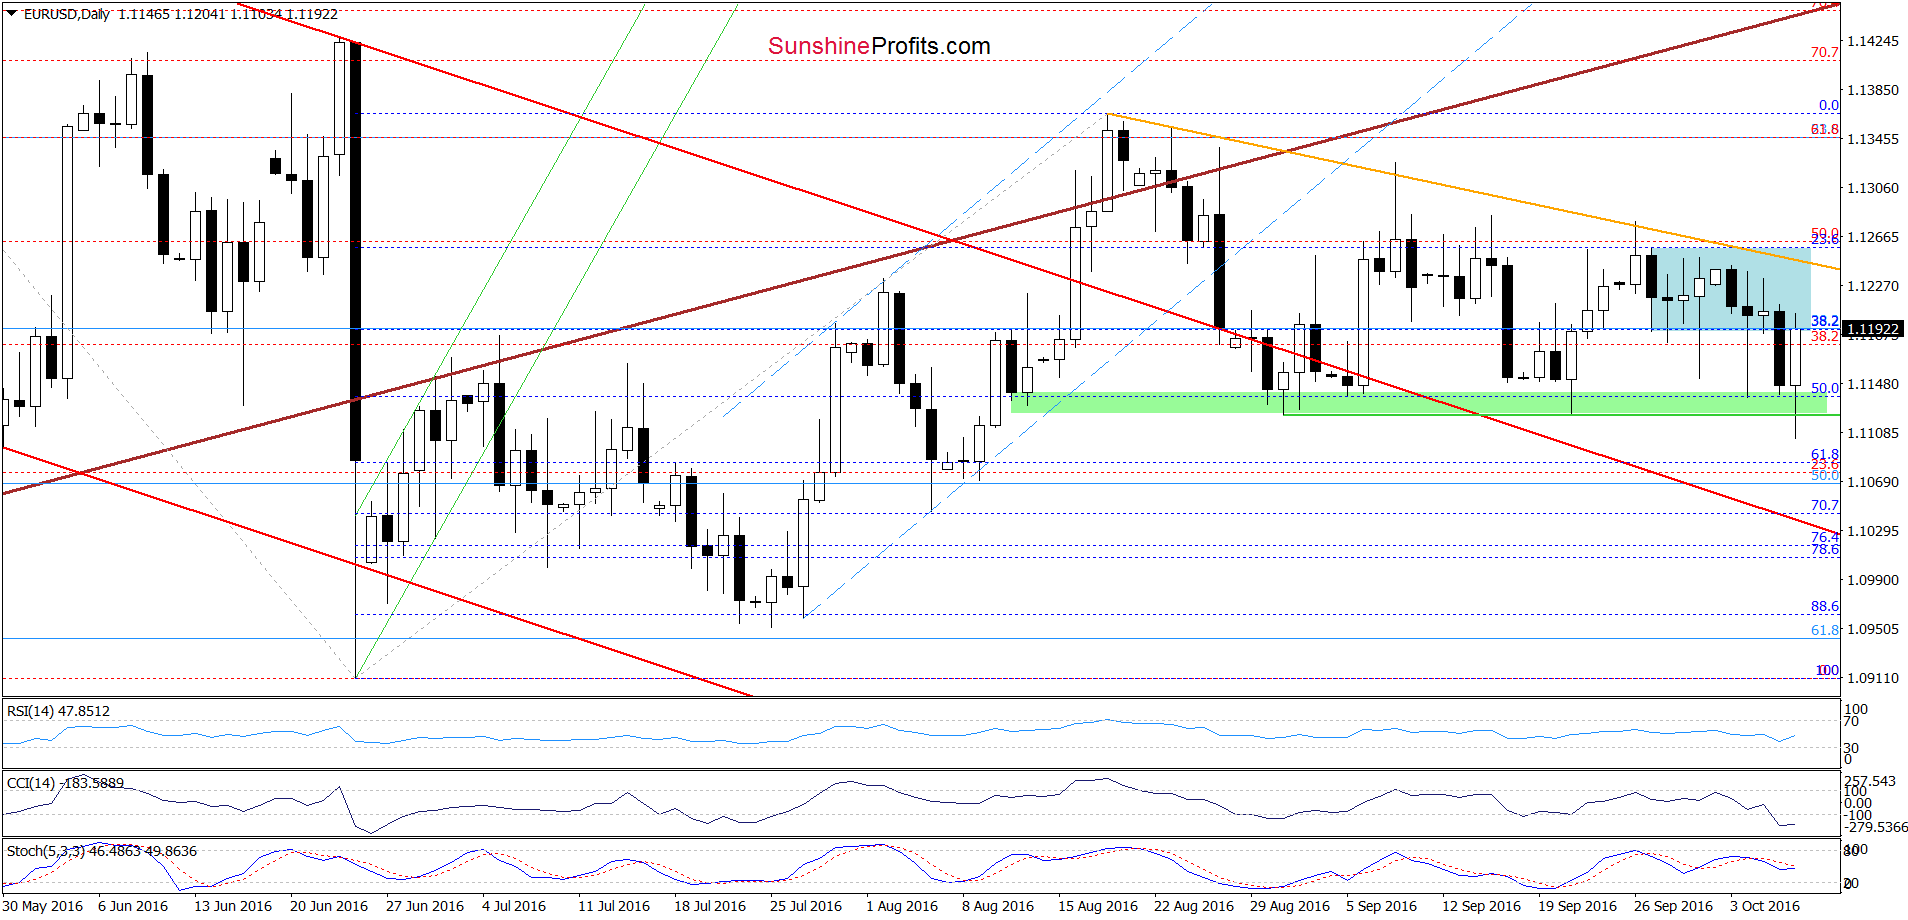
(…) the exchange moved lower (…) re-tested the lower border of the consolidation, which doesn’t bode well for EUR/USD – especially when we factor in sell signals generated by the indicators. Taking all the above into account, we think that the pair will extend losses and test the green support zone once again in the coming day(s).
Looking at the daily chart, we see that currency bears pushed the exchange rate lower as we had expected. With today’s downswing EUR/USD slipped under the green support zone, however, this deterioration was very temporary (similarly to what we saw in recent days) and the pair came back to the previously-broken lower border of the blue consolidation. Although today’s sharp rebound seems to be a bullish event (an invalidation of the breakdown under the green zone), we think that as long as there won’t be a breakout above the orange declining resistance line another bigger move to the upside is not likely to be seen and short-lived moves in both directions should not surprise us.
Very short-term outlook: mixed
Short-term outlook: mixed
MT outlook: mixed
LT outlook: mixed
Trading position (short-term; our opinion): No positions are justified from the risk/reward perspective. We will keep you informed should anything change, or should we see a confirmation/invalidation of the above.
USD/JPY
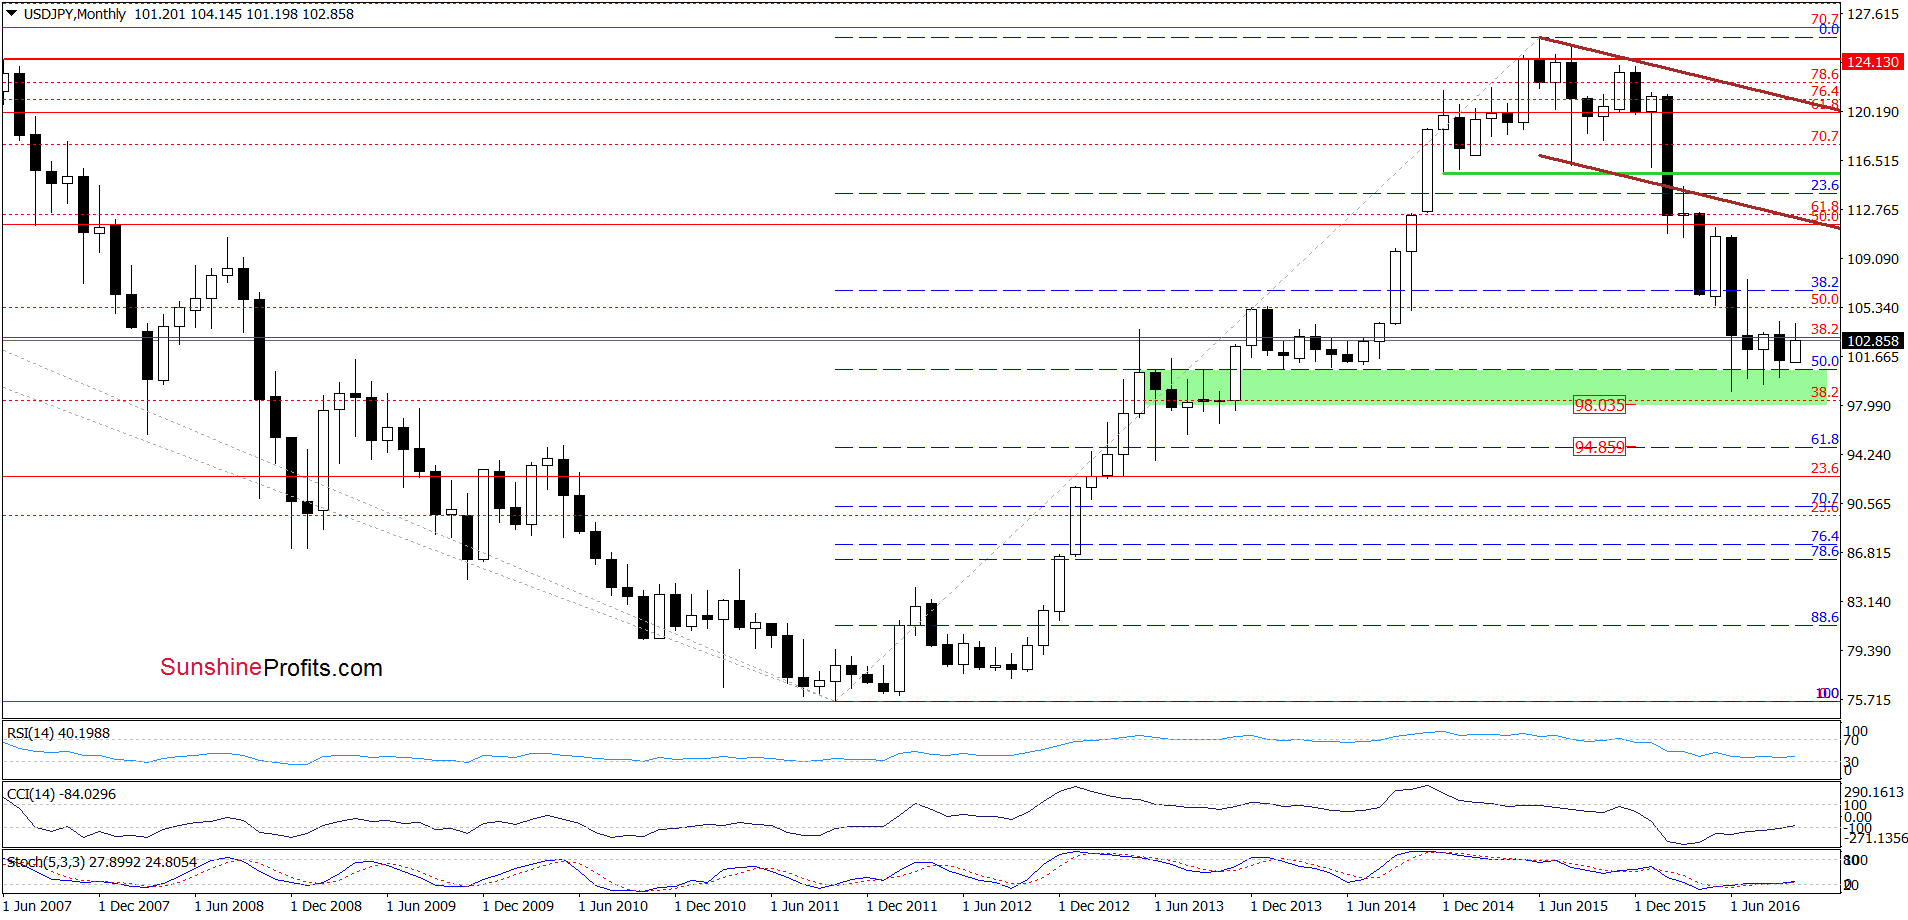
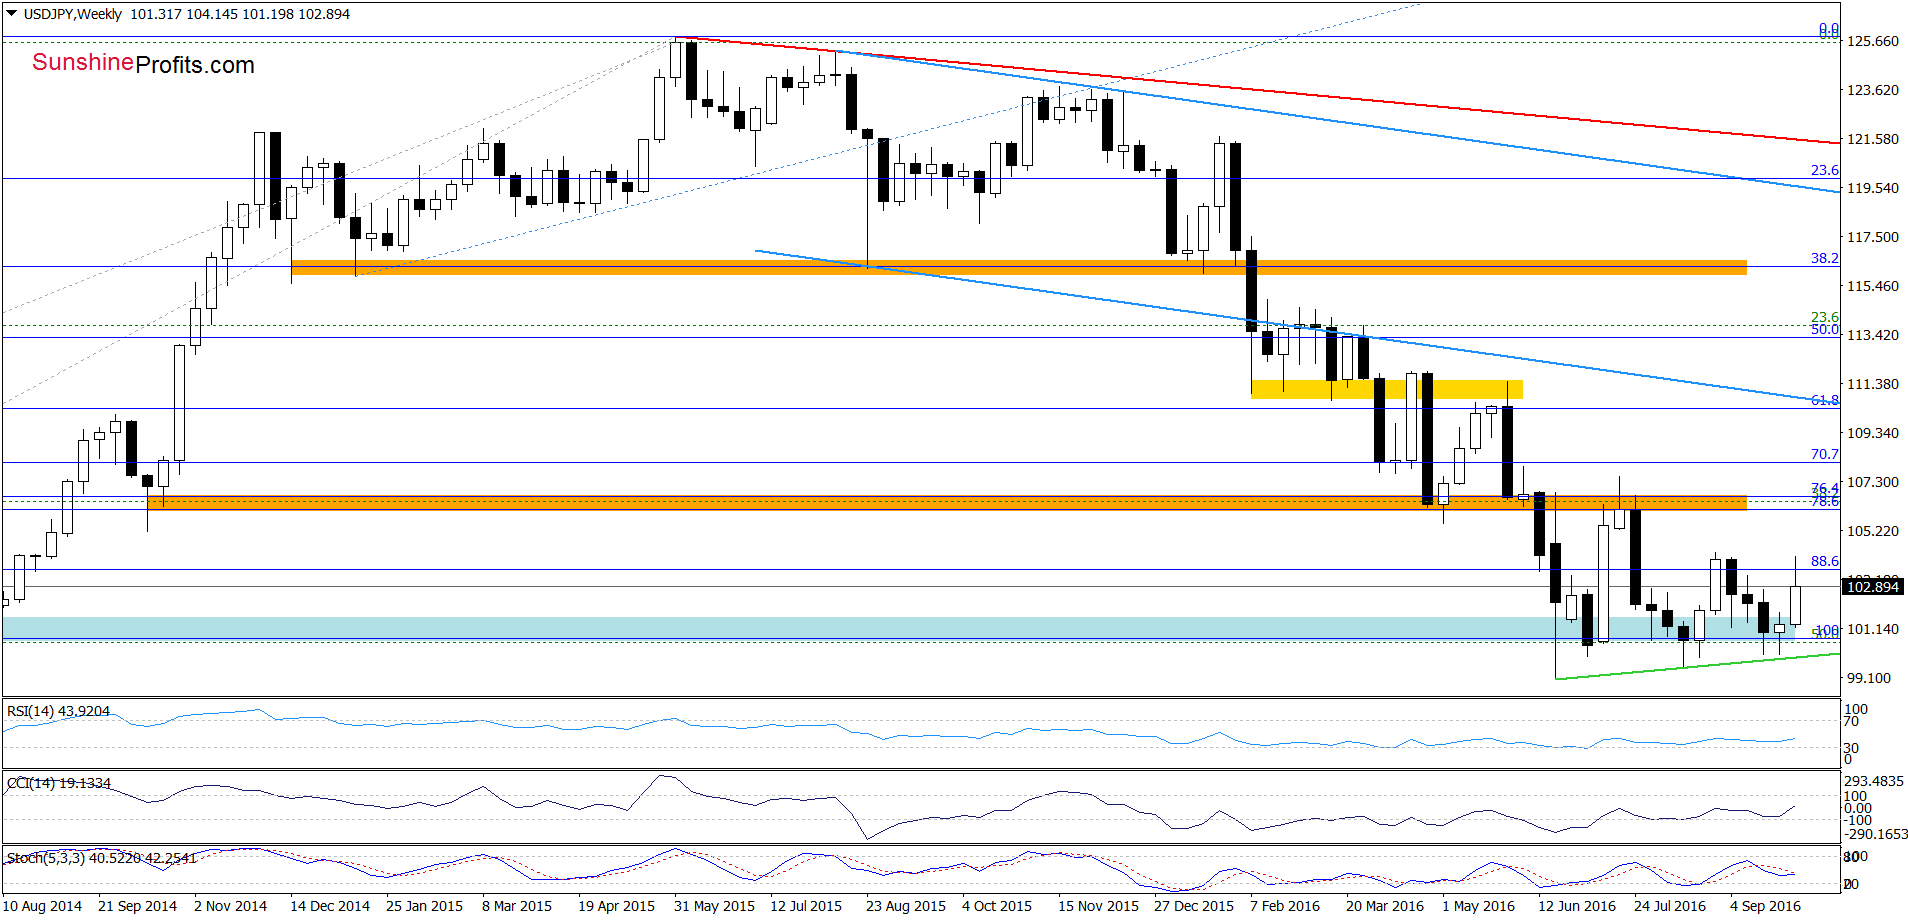
Looking at USD/JPY from the long- and medium-term perspective, we see that the overall situation hasn’t changed much as the exchange rate remains above the green support zone (marked on the monthly chart) and the green support line based on the Jun and Aug lows (seen on the weekly chart).
Is it possible that we’ll see a re-test of these support zones in the coming week? Let’s examine the daily chart and find out.
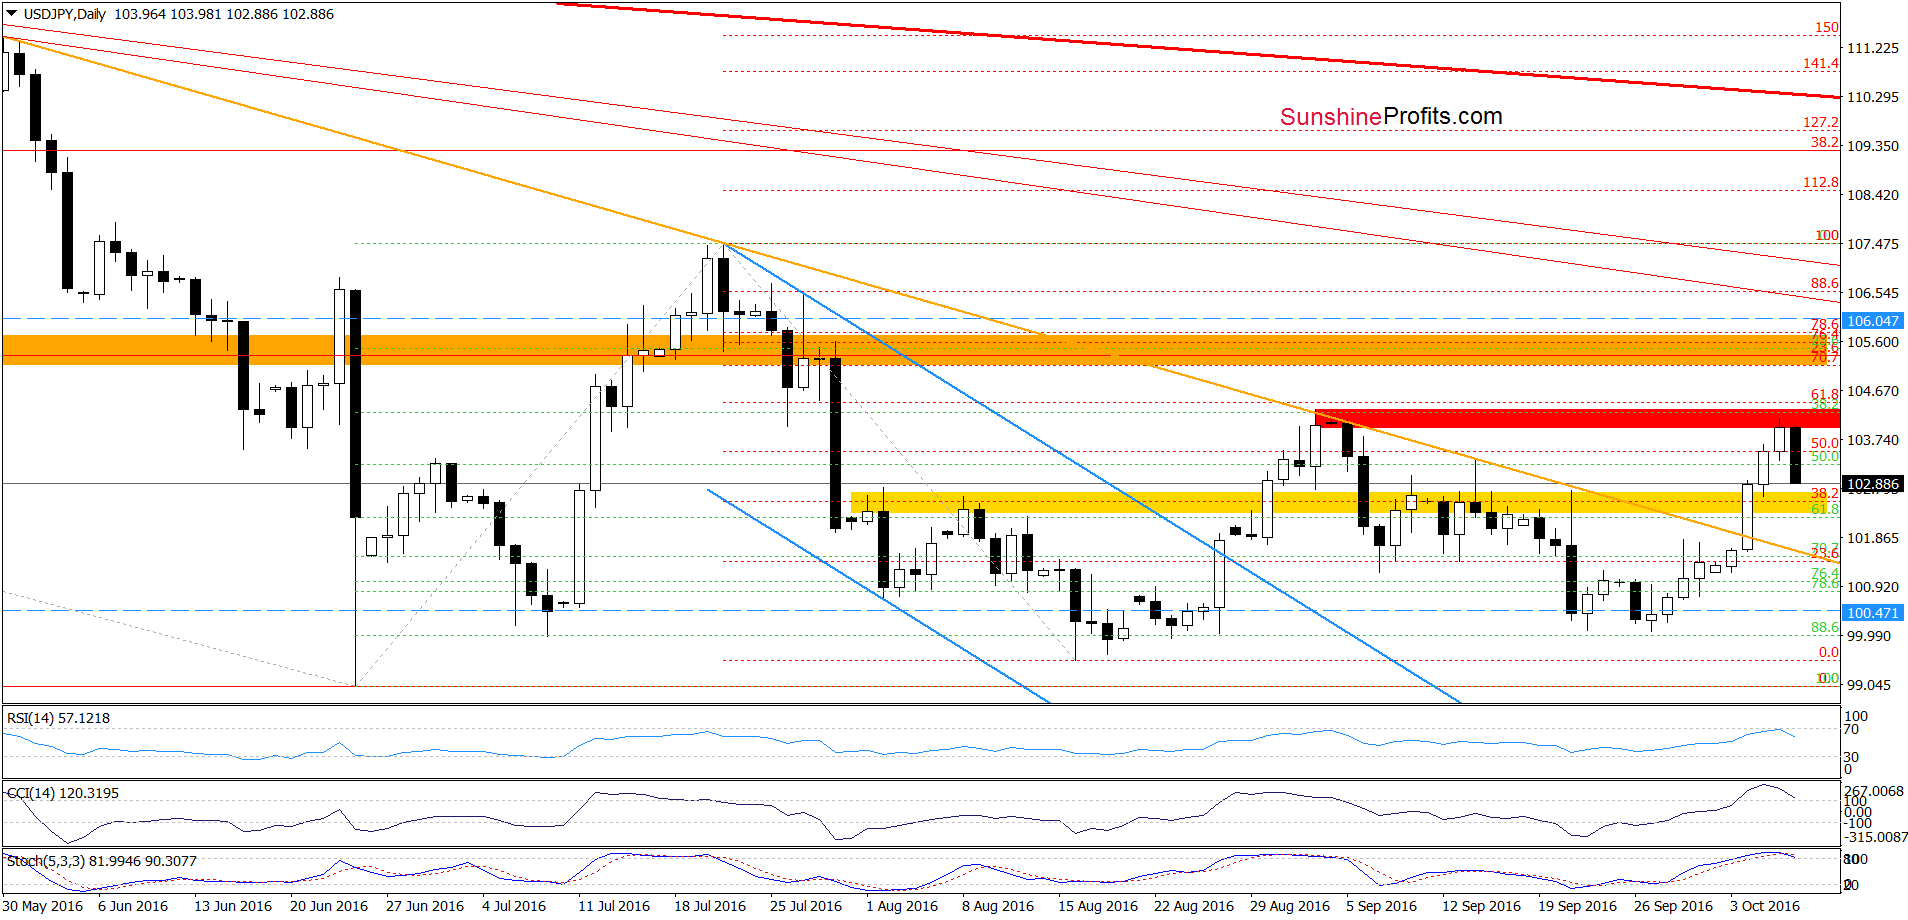
On Wednesday, we wrote the following:
The first thing that catches the eye on the very short-term chart is a breakout not only above the yellow resistance zone, but also above the red and orange declining resistance lines, which successfully stopped currency bulls in previous weeks. Taking this bullish signal into account (…), we think that further improvement is very likely. Nevertheless, the CCI and Stochastic Oscillator are overbought, which increases the probability of a correction in near future – probably after a climb to around 103.79-104.12, where the Sep highs are.
As you see on the above chart, the situation developed in line with the above scenario and USD/JPY reversed after an increase to the red resistance zone (based on Sep highs). Taking this fact into account and combining it with the current positions of the indicators (the RSI moved away from the barrier of 70, while the CCI and Stochastic Oscillator are very close to generating sell signals), we think that further deterioration should not surprise us. How low can the pair go in the coming days? In our onion, the initial downside target would be around 101.60, where the previously-broken orange declining line (which serves now as support) currently is.
Very short-term outlook: bearish
Short-term outlook: mixed
MT outlook: mixed
LT outlook: mixed
Trading position (short-term; our opinion): No positions are justified from the risk/reward perspective. Nevertheless, if the exchange rate drops to our downside target and we see some bullish developments we’ll consider opening long positions. We will keep you informed should anything change, or should we see a confirmation/invalidation of the above.
USD/CAD
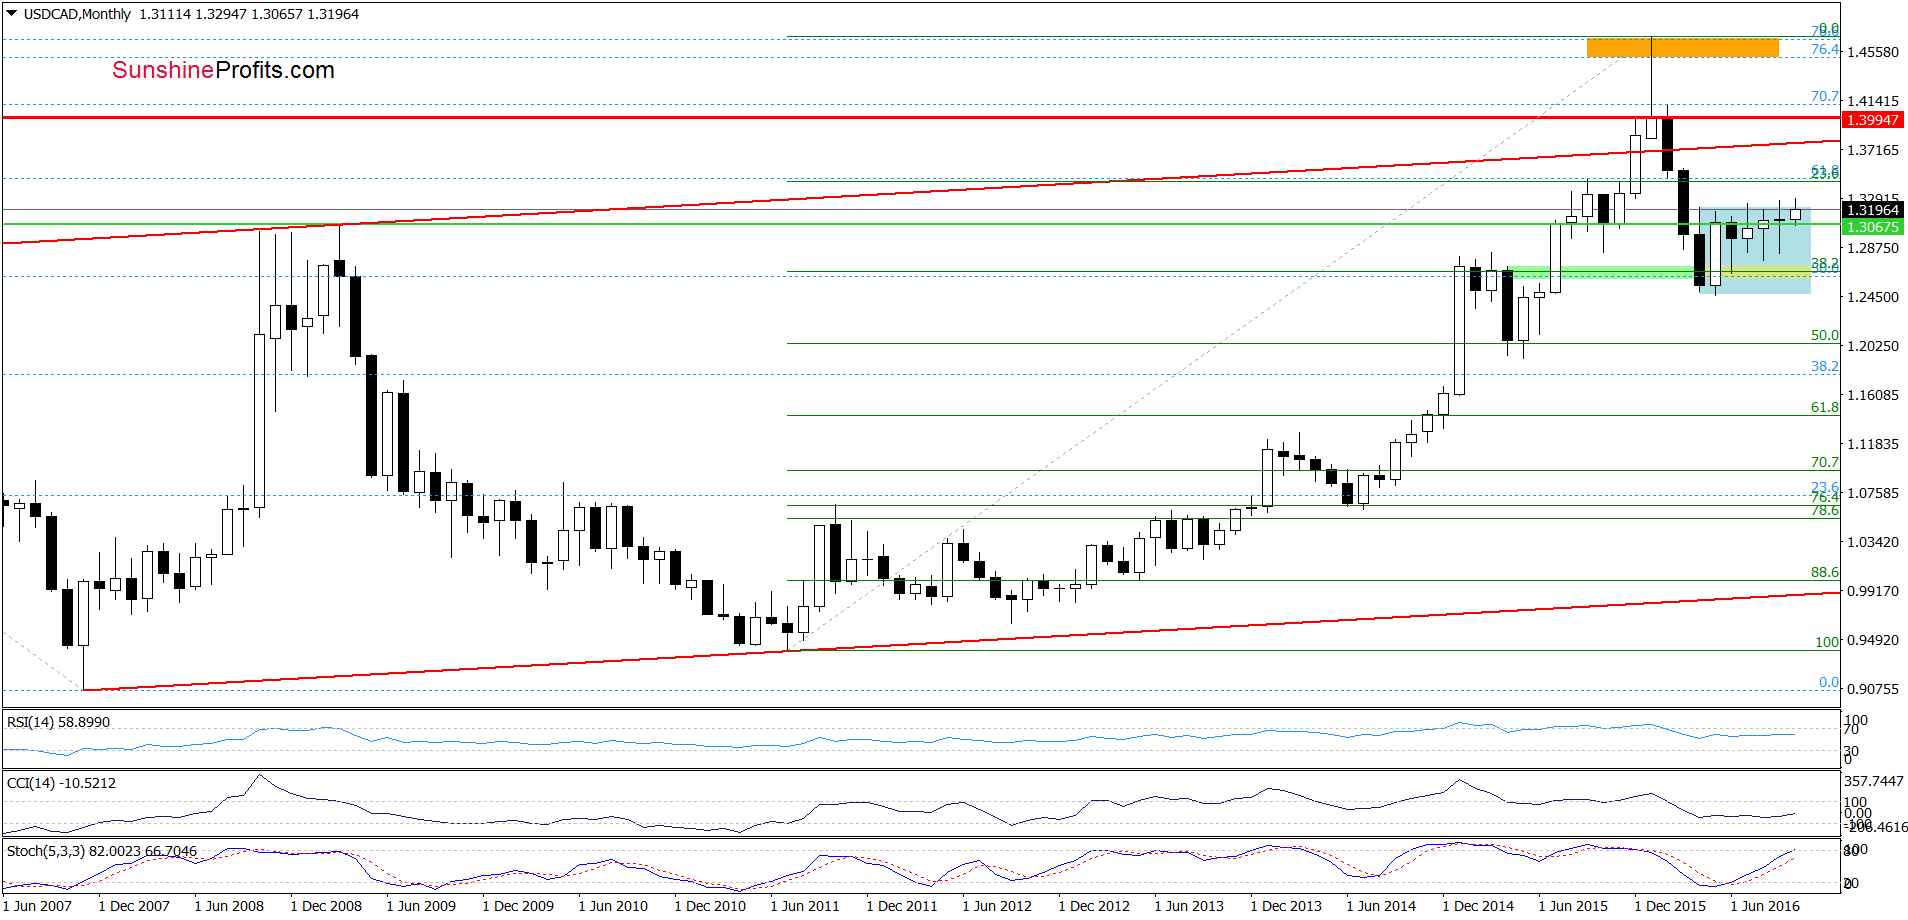
From the long-term perspective, we see that USD/CAD moved higher once again and broke above the upper border of the blue consolidation. Will this positive event be strong enough to trigger further improvement? Or maybe there are some factors, which will encourage currency bears to action? Let’s check the dily chart and find out.
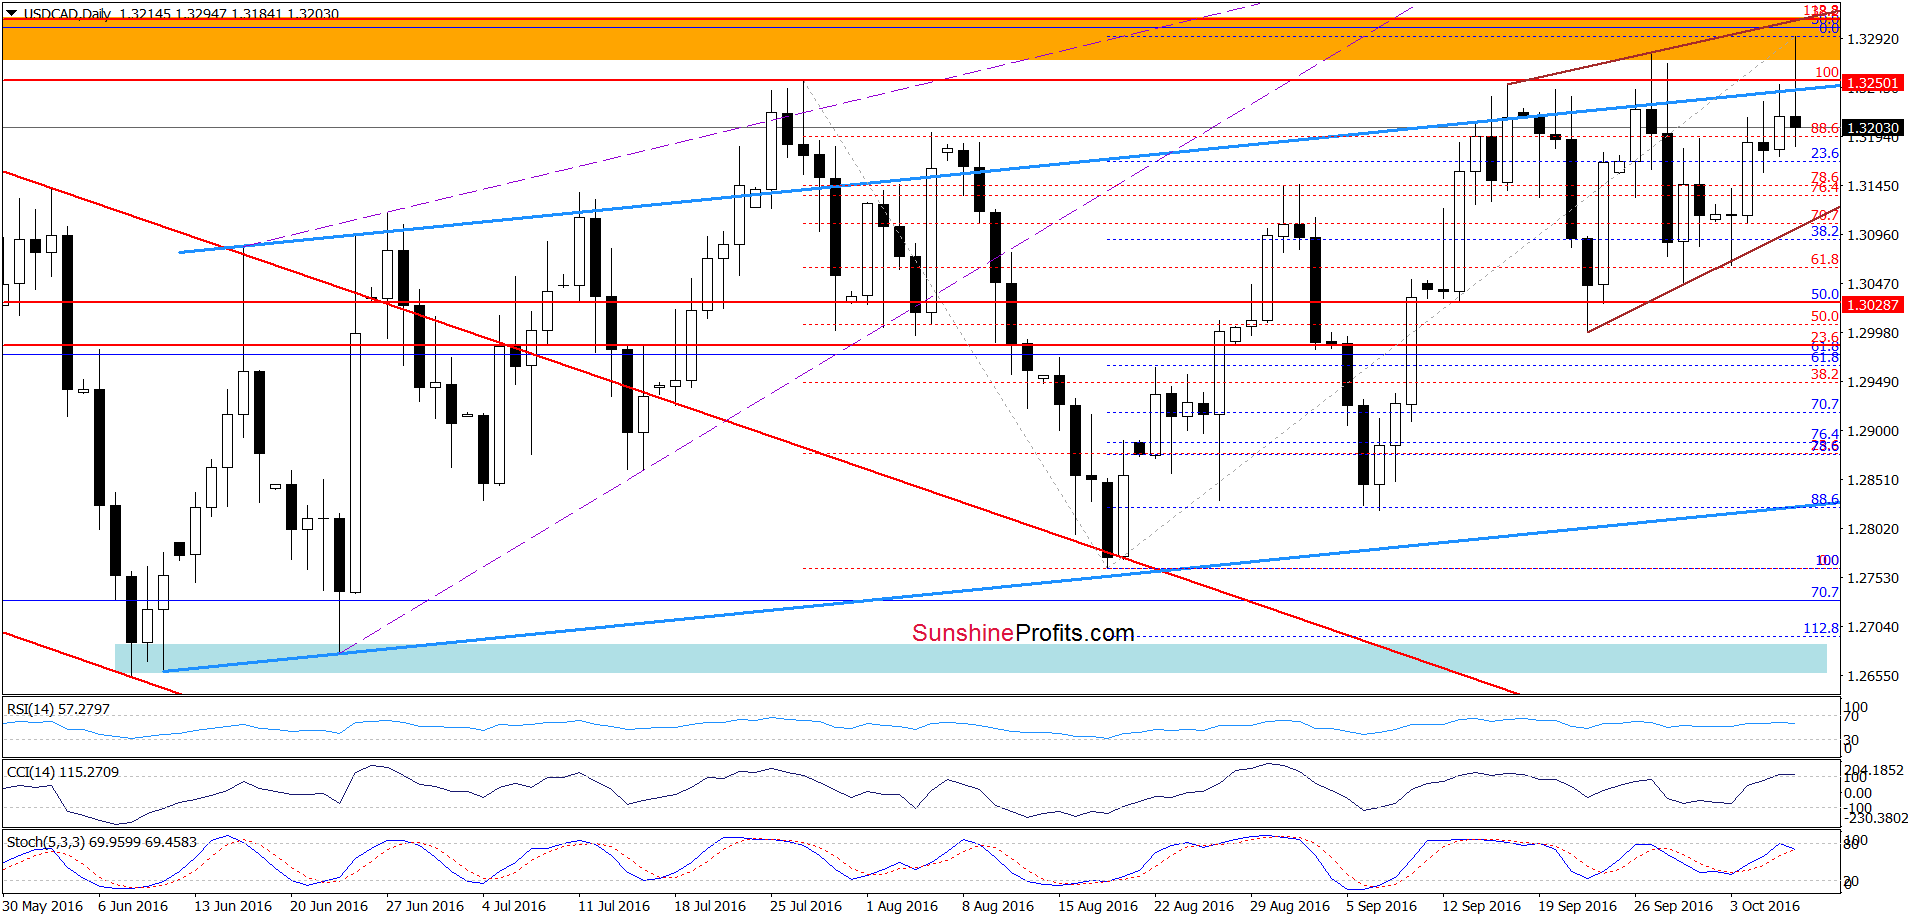
On the daily chart, we see that currency bulls pushed USD/CAD higher once again, but they didn’t manage to hold gained levels, which resulted in a pullback earlier today. In this way, the pair invalidated the breakout above the upper border of the blue rising trend channel (for the third time; for the ninth time in terms of intraday highs), which suggests that further deterioration is more likely than not – especially when we factor in the current position of the indicators (they are very close to generating sell signals). If this is the case and USD/CAD moves lower from current levels, the initial downside target would be around 1.3106, where the lower border of the brown rising wedge currently is.
Very short-term outlook: bearish
Short-term outlook: bearish
MT outlook: mixed
LT outlook: mixed
Trading position (short-term; our opinion): Short positions (with a stop-loss order at 1.3346 and initial downside target at 1.2876) are justified from the risk/reward perspective. We will keep you informed should anything change, or should we see a confirmation/invalidation of the above.
Thank you.
Nadia Simmons
Forex & Oil Trading Strategist
Przemyslaw Radomski, CFA
Founder, Editor-in-chief, Gold & Silver Fund Manager
Gold & Silver Trading Alerts
Forex Trading Alerts
Oil Investment Updates
Oil Trading Alerts

