

Earlier today, the U.S. dollar extended losses against the Swiss franc, which resulted in a drop below the previously-broken resistance line. What impact will this invalidation of a breakout may have on future USD/CHF moves?
In our opinion the following forex trading positions are justified - summary:
- EUR/USD: none
- GBP/USD: short (a stop-loss order at 1.3549 and initial downside target at 1.2231)
- USD/JPY: none
- USD/CAD: short (a stop-loss order at 1.3346; initial downside target at 1.2876)
- USD/CHF: none
- AUD/USD: short (a stop-loss order at 0.7791; initial downside target at 0.7516)
EUR/USD
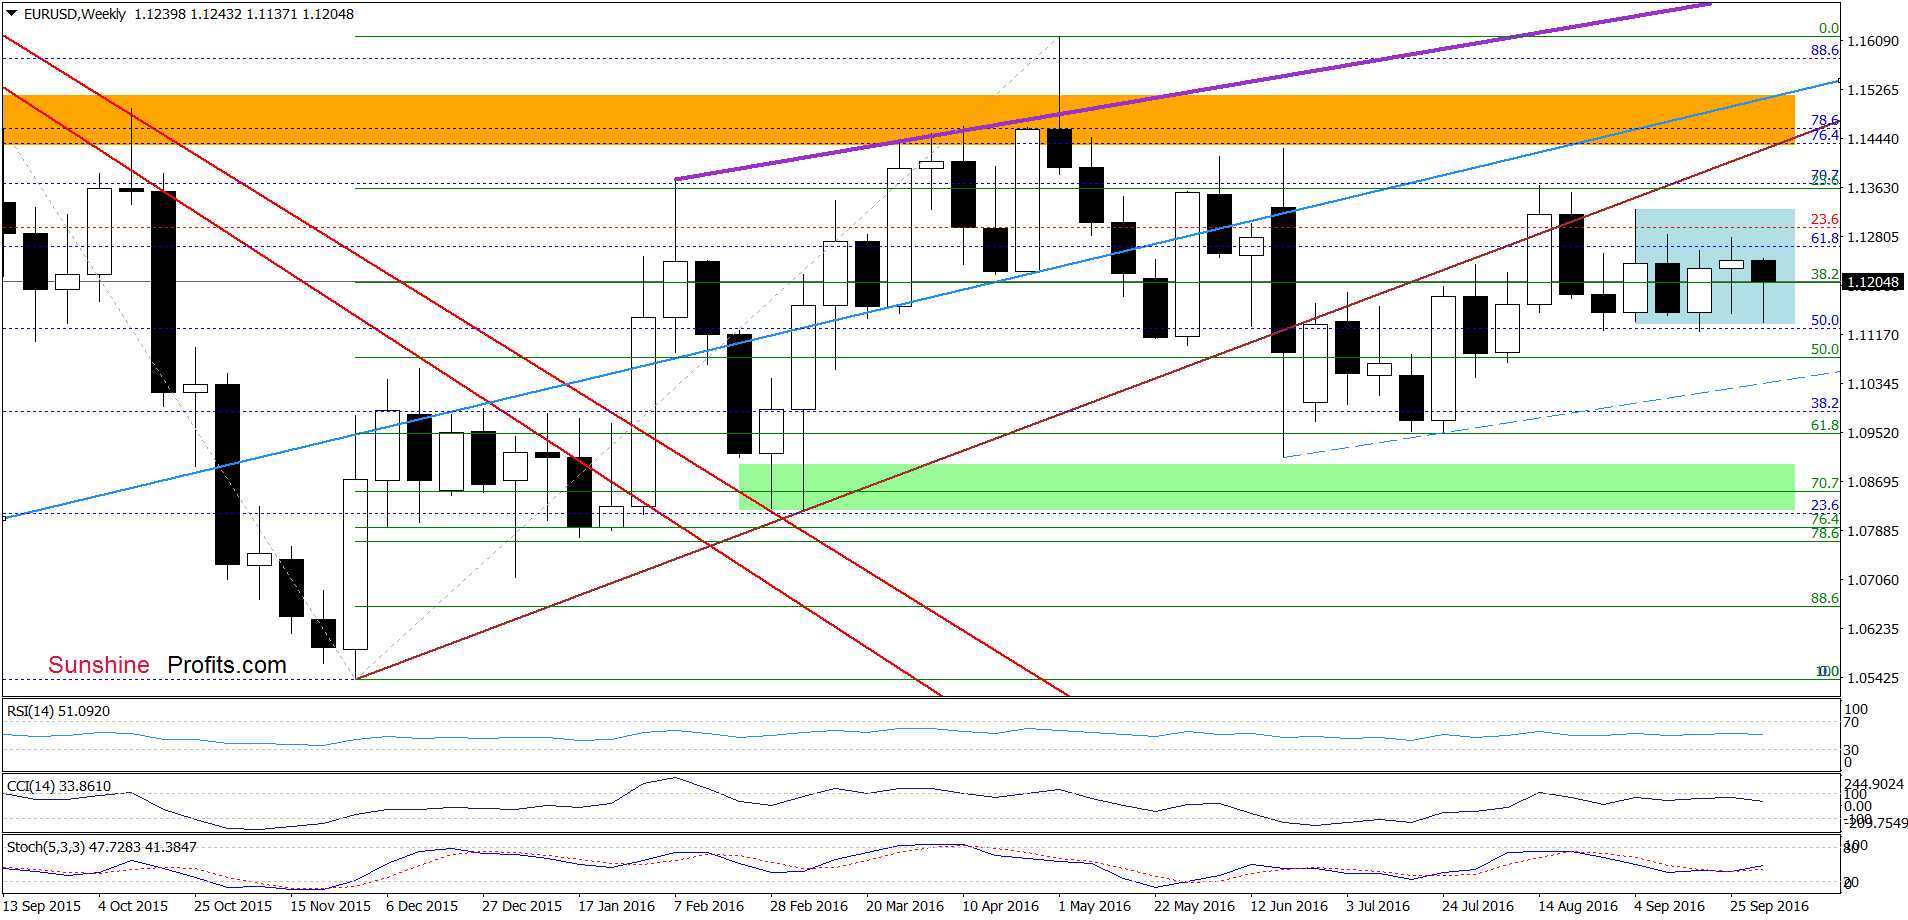
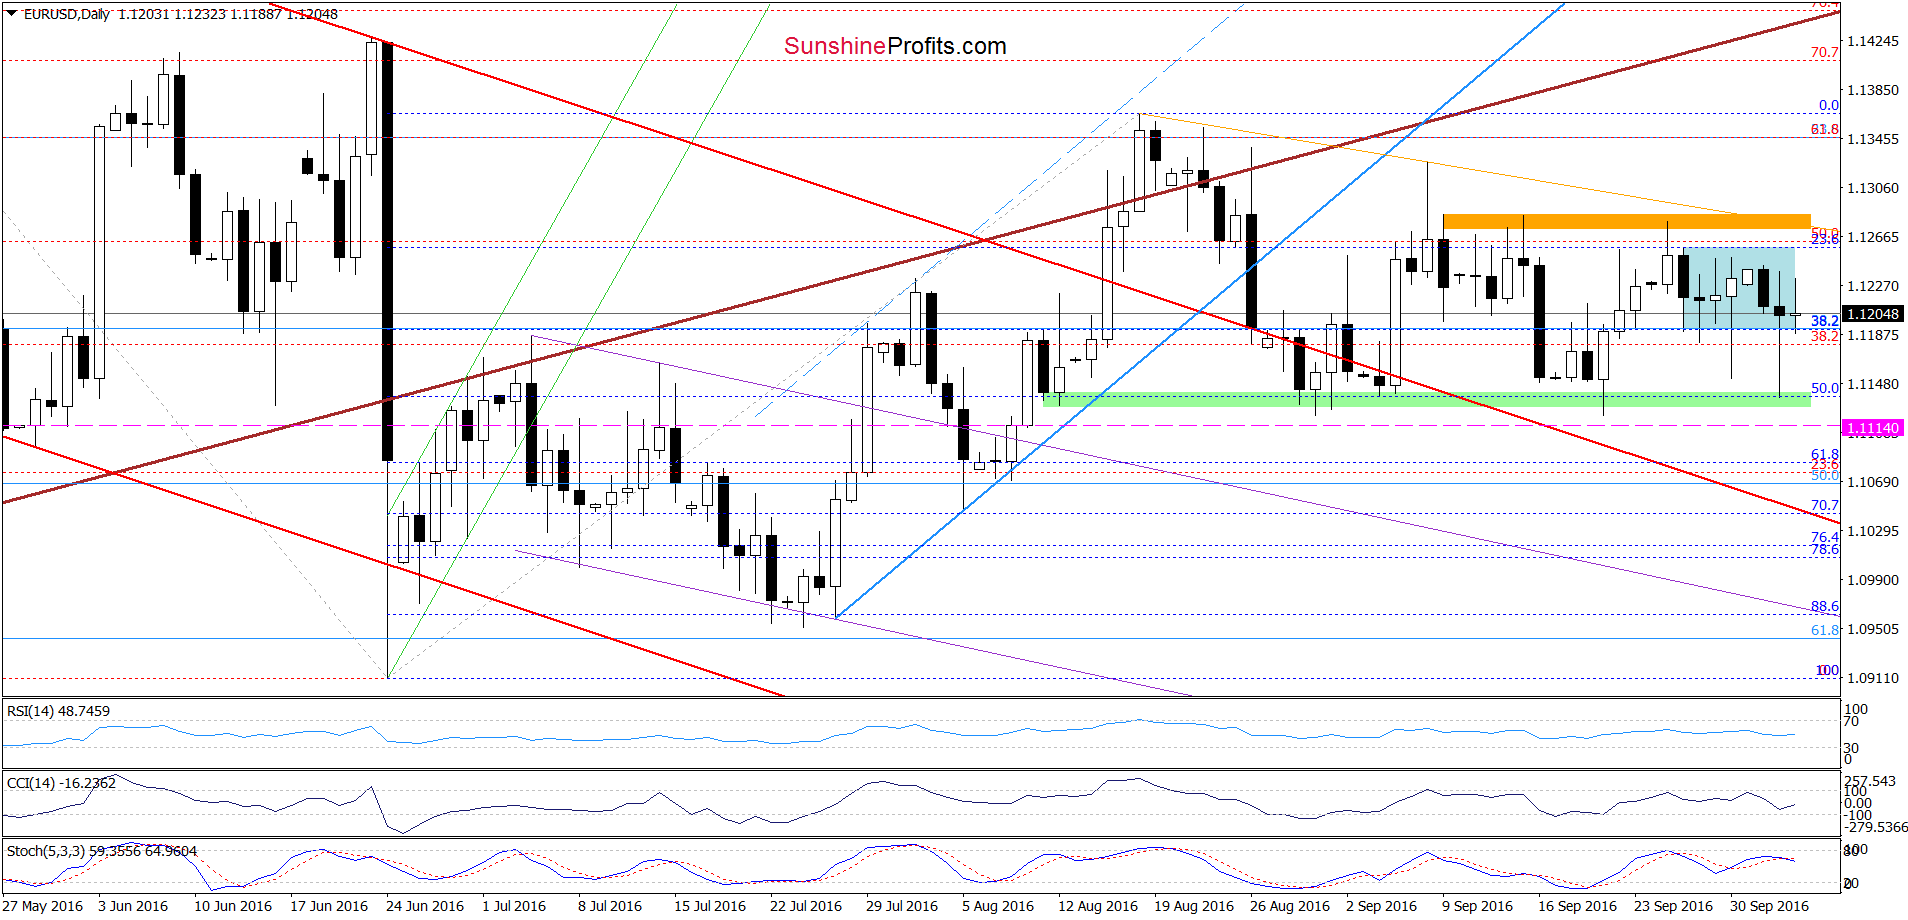
On the daily chart, we see that EUR/USD broke below the lower border of the blue consolidation and declined under the last week’s low. Despite this deterioration, the green support zone stopped currency bears once again, triggering a comeback to the consolidation. Although this is a positive signal, we saw similar price action several days ago, which in combination with a sell signal generated by the Stochastic Oscillator suggests that another attempt to move lower is just around the corner.
Very short-term outlook: mixed with bearish bias
Short-term outlook: mixed
MT outlook: mixed
LT outlook: mixed
Trading position (short-term; our opinion): No positions are justified from the risk/reward perspective. We will keep you informed should anything change, or should we see a confirmation/invalidation of the above.
USD/JPY
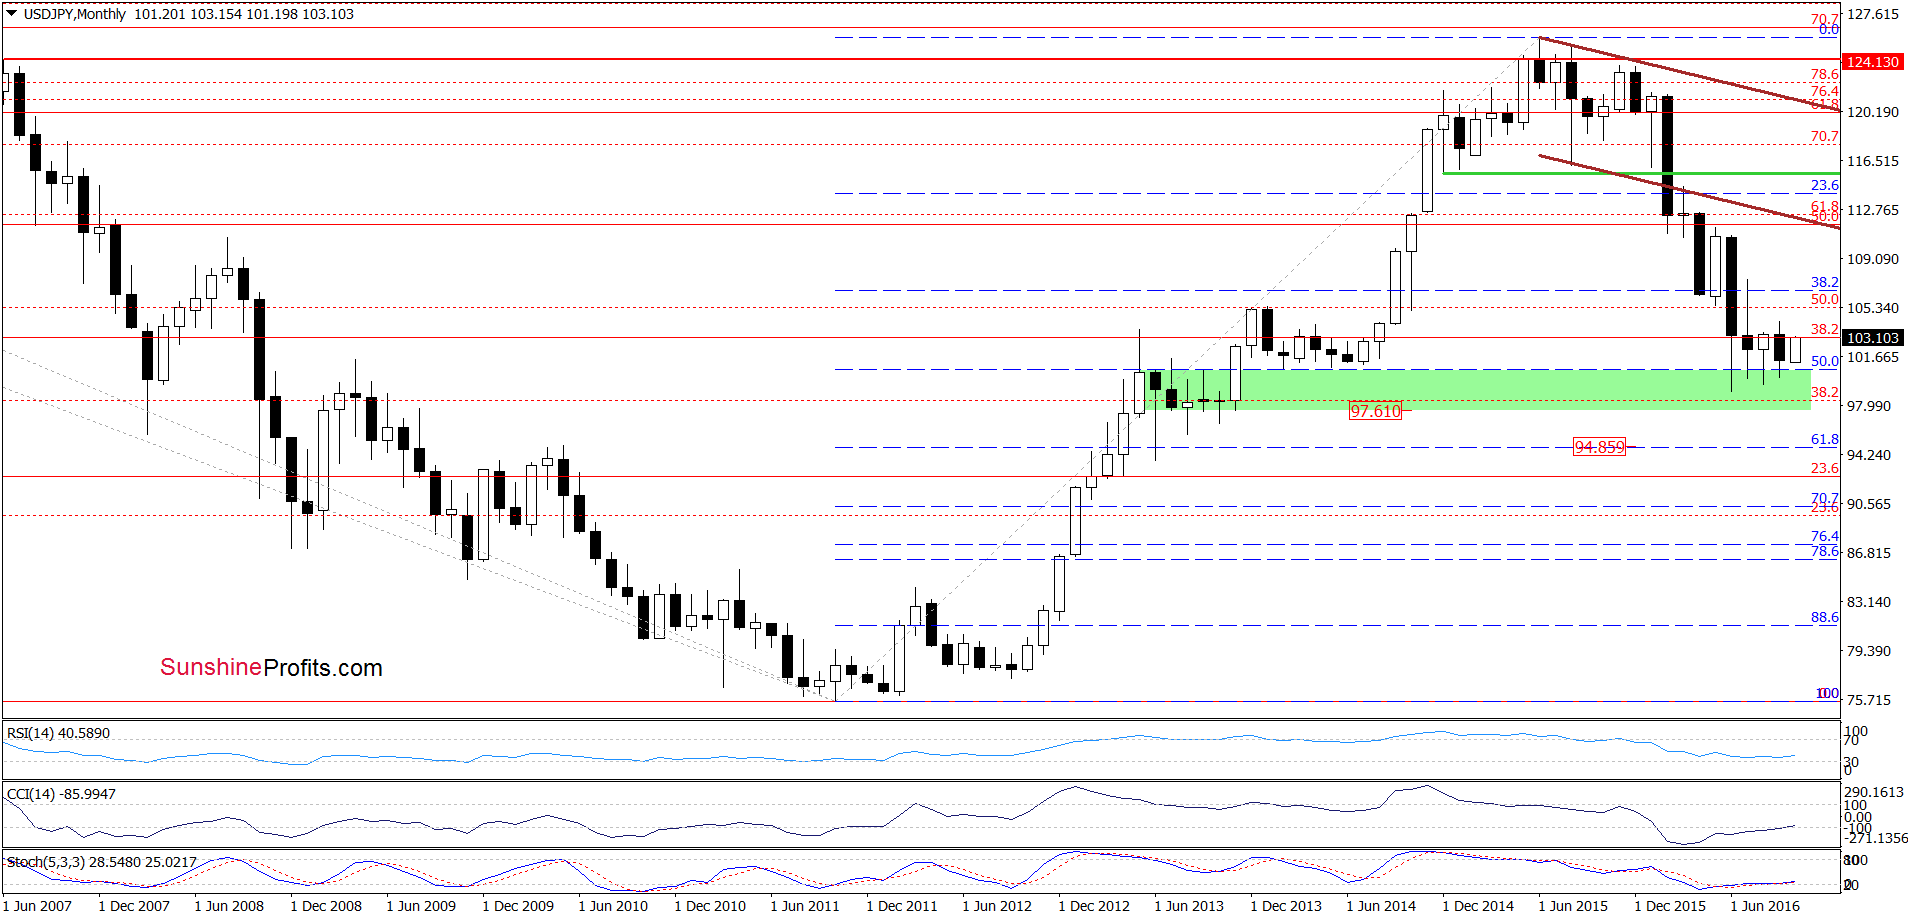
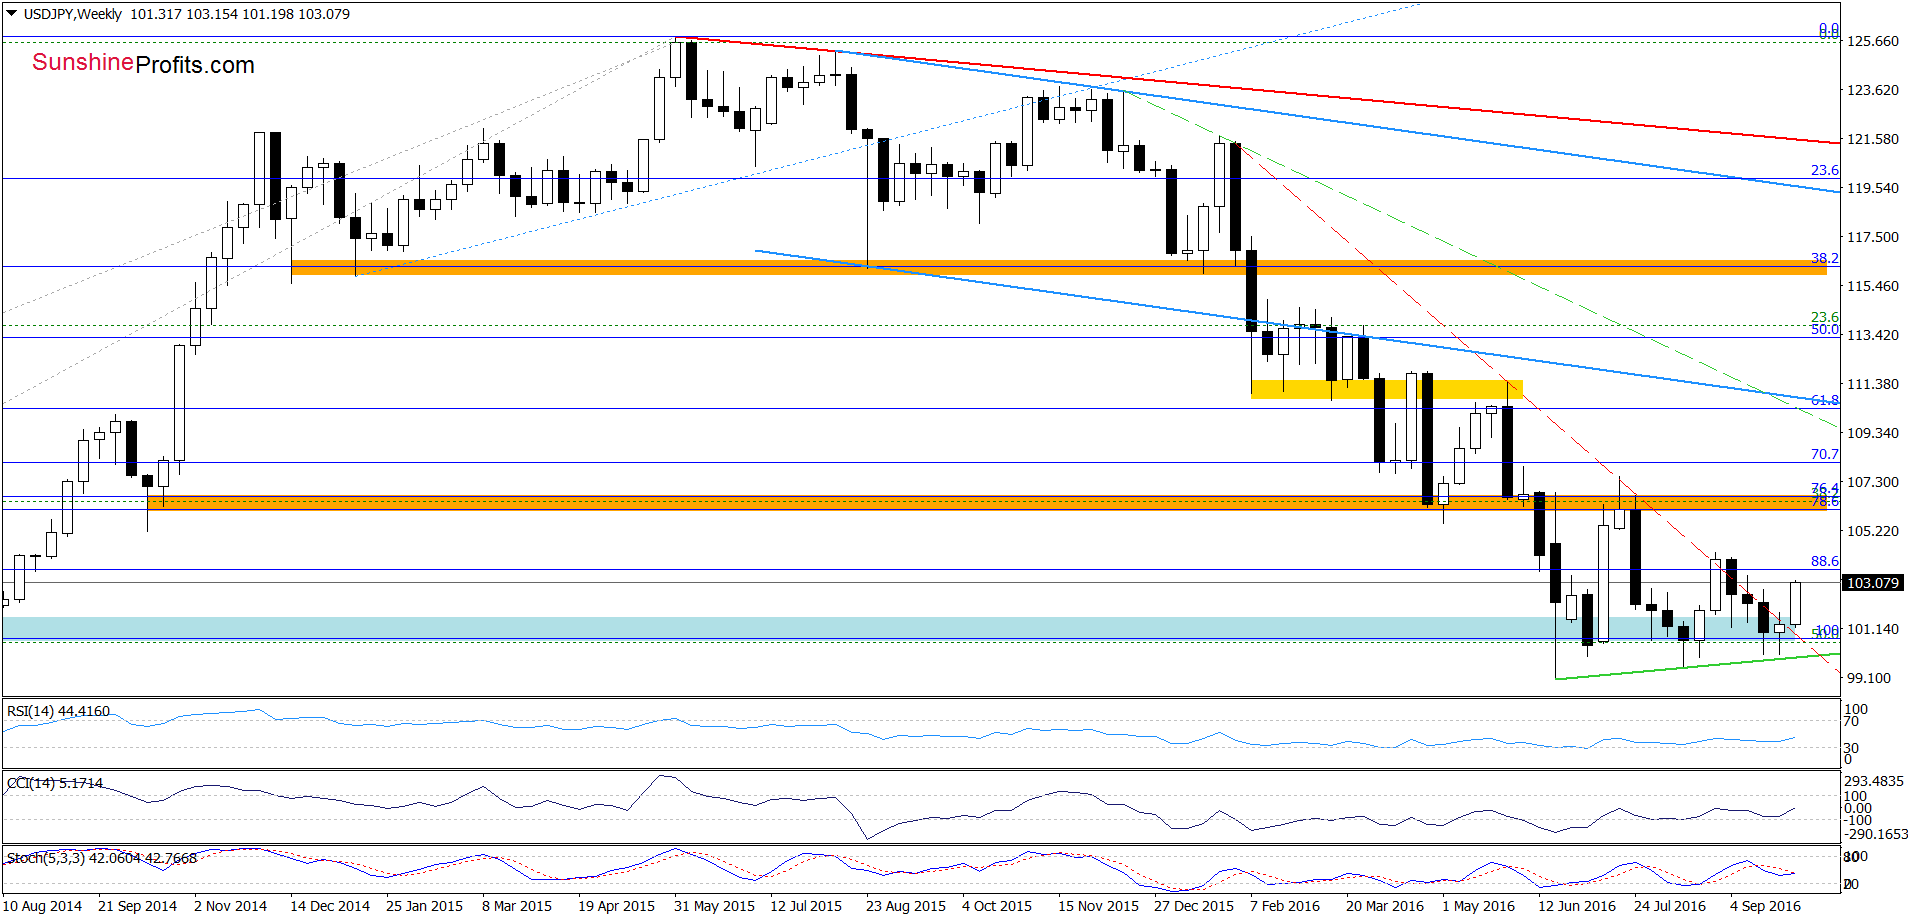
Looking at USD/JPY from the long- and medium-term perspective, we see that the exchange rate bounced off the green support zone (marked on the monthly chart) and the green support line based on the Jun and Aug lows (seen on the weekly chart), which is a positive signal that suggests further improvement – especially when we factor in buy signals generated by the monthly indicators.
But are there any factors that can hinder the realization of the pro-growth scenario? Let’s examine the daily chart and find out.
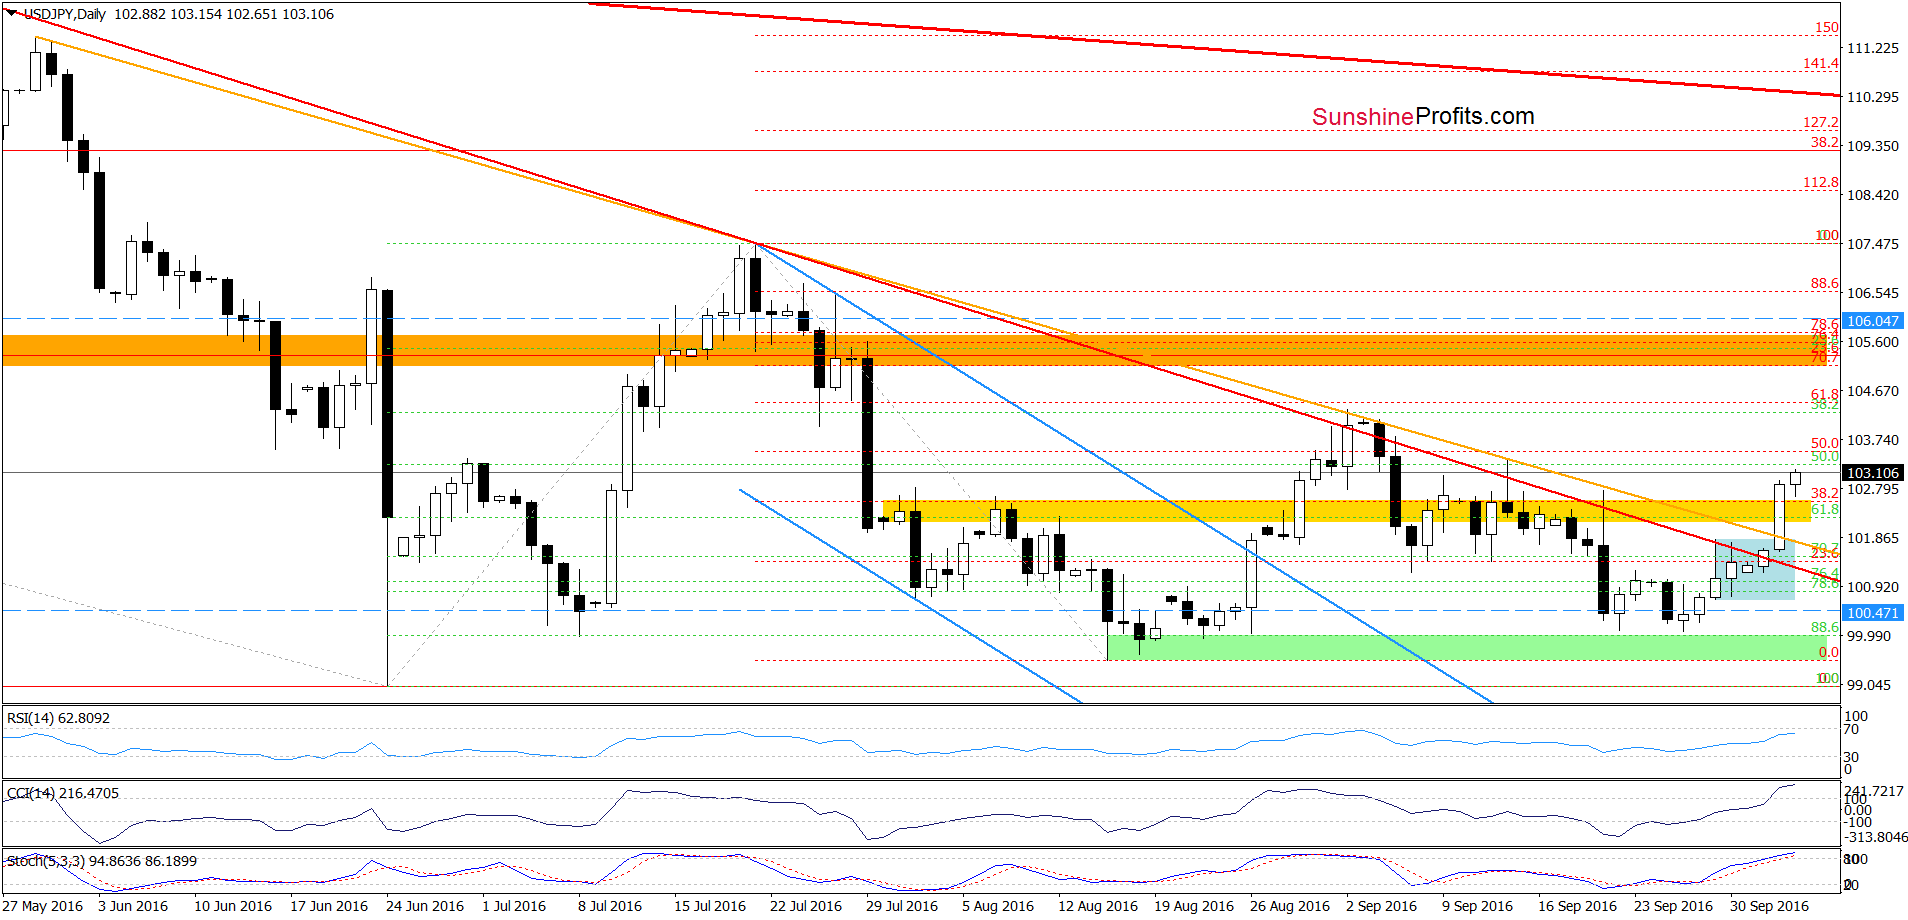
The first thing that catches the eye on the very short-term chart is a breakout not only above the yellow resistance zone, but also above the red and orange declining resistance lines, which successfully stopped currency bulls in previous weeks. Taking this bullish signal into account and combining it with the broader perspective, we think that further improvement is very likely. Nevertheless, the CCI and Stochastic Oscillator are overbought, which increases the probability of a correction in near future – probably after a climb to around 103.79-104.12, where the Sep highs are.
Very short-term outlook: mixed with bullish bias
Short-term outlook: mixed
MT outlook: mixed with bullish bias
LT outlook: mixed with bullish bias
Trading position (short-term; our opinion): No positions are justified from the risk/reward perspective. Nevertheless, if we see a pullback after increase to the Sep highs, we’ll consider opening long positions. We will keep you informed should anything change, or should we see a confirmation/invalidation of the above.
USD/CHF
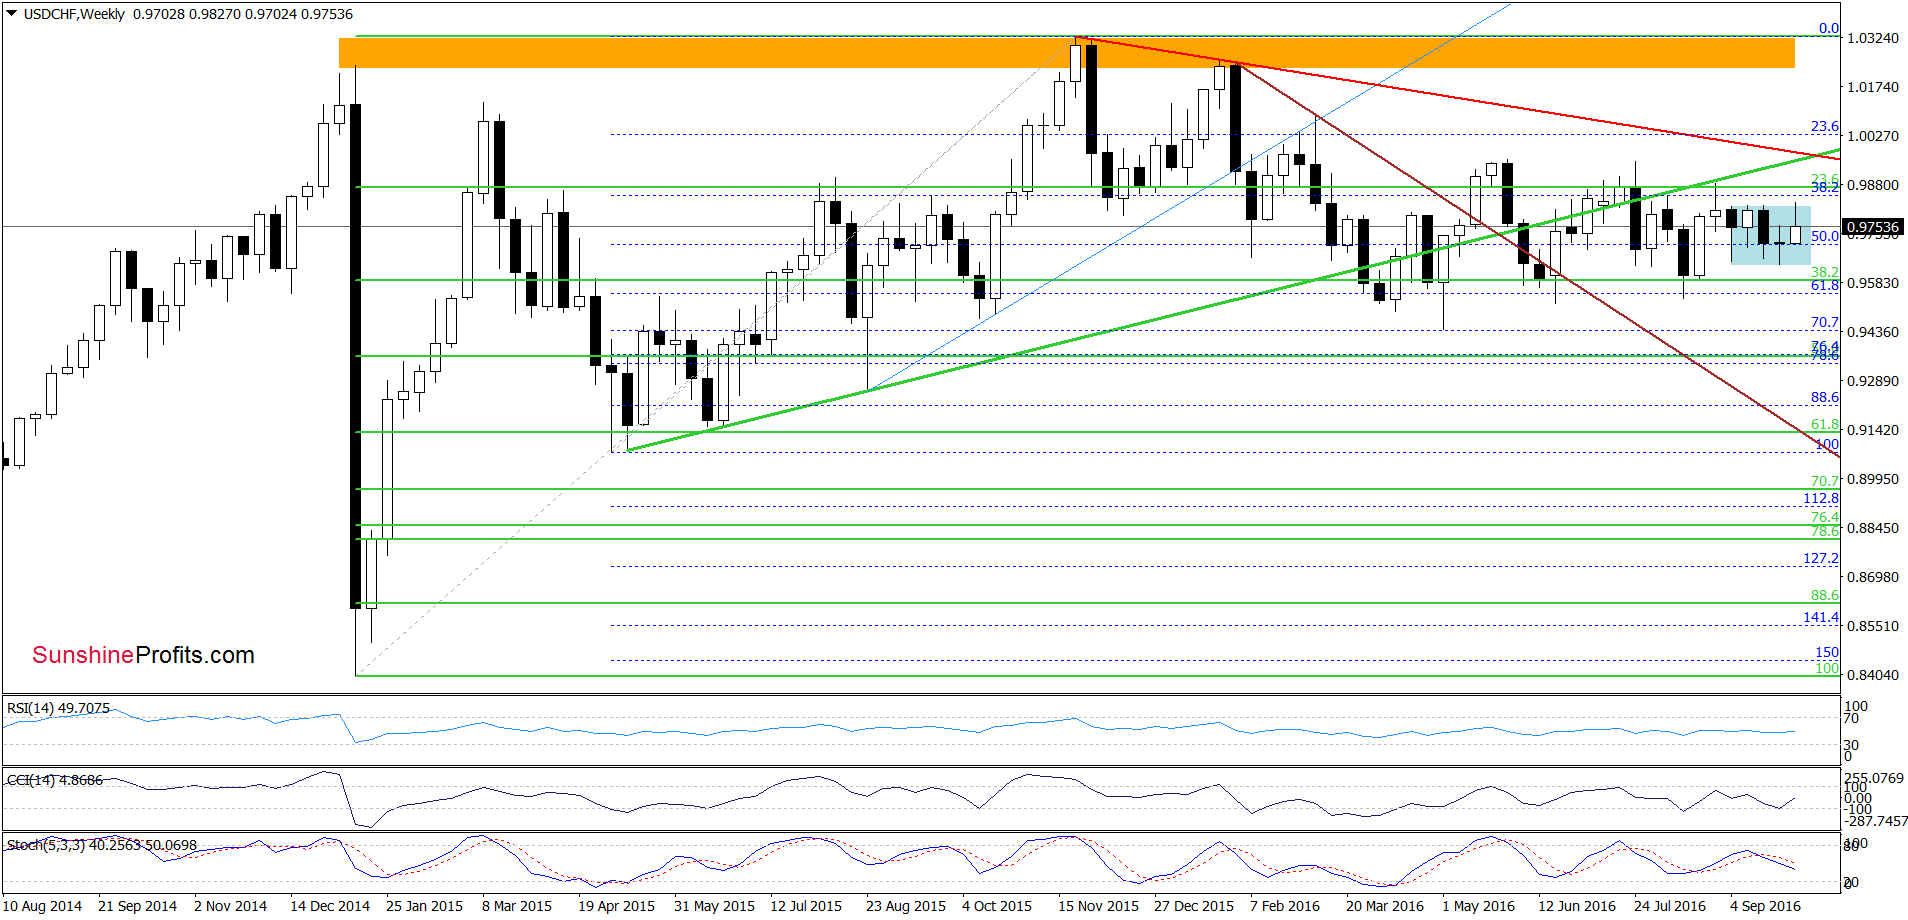
Looking at the weeky chart, we see that although USD/CHF clibed slithtly above the upper line of the consolidation, this improvement was very temporary and the pair invallidated this small breakout very quickly. In our opinion, this is a negative signal, which suggests further deterioration in the coming days.
What impact did this price action have on the very short-term picture? Lets check.
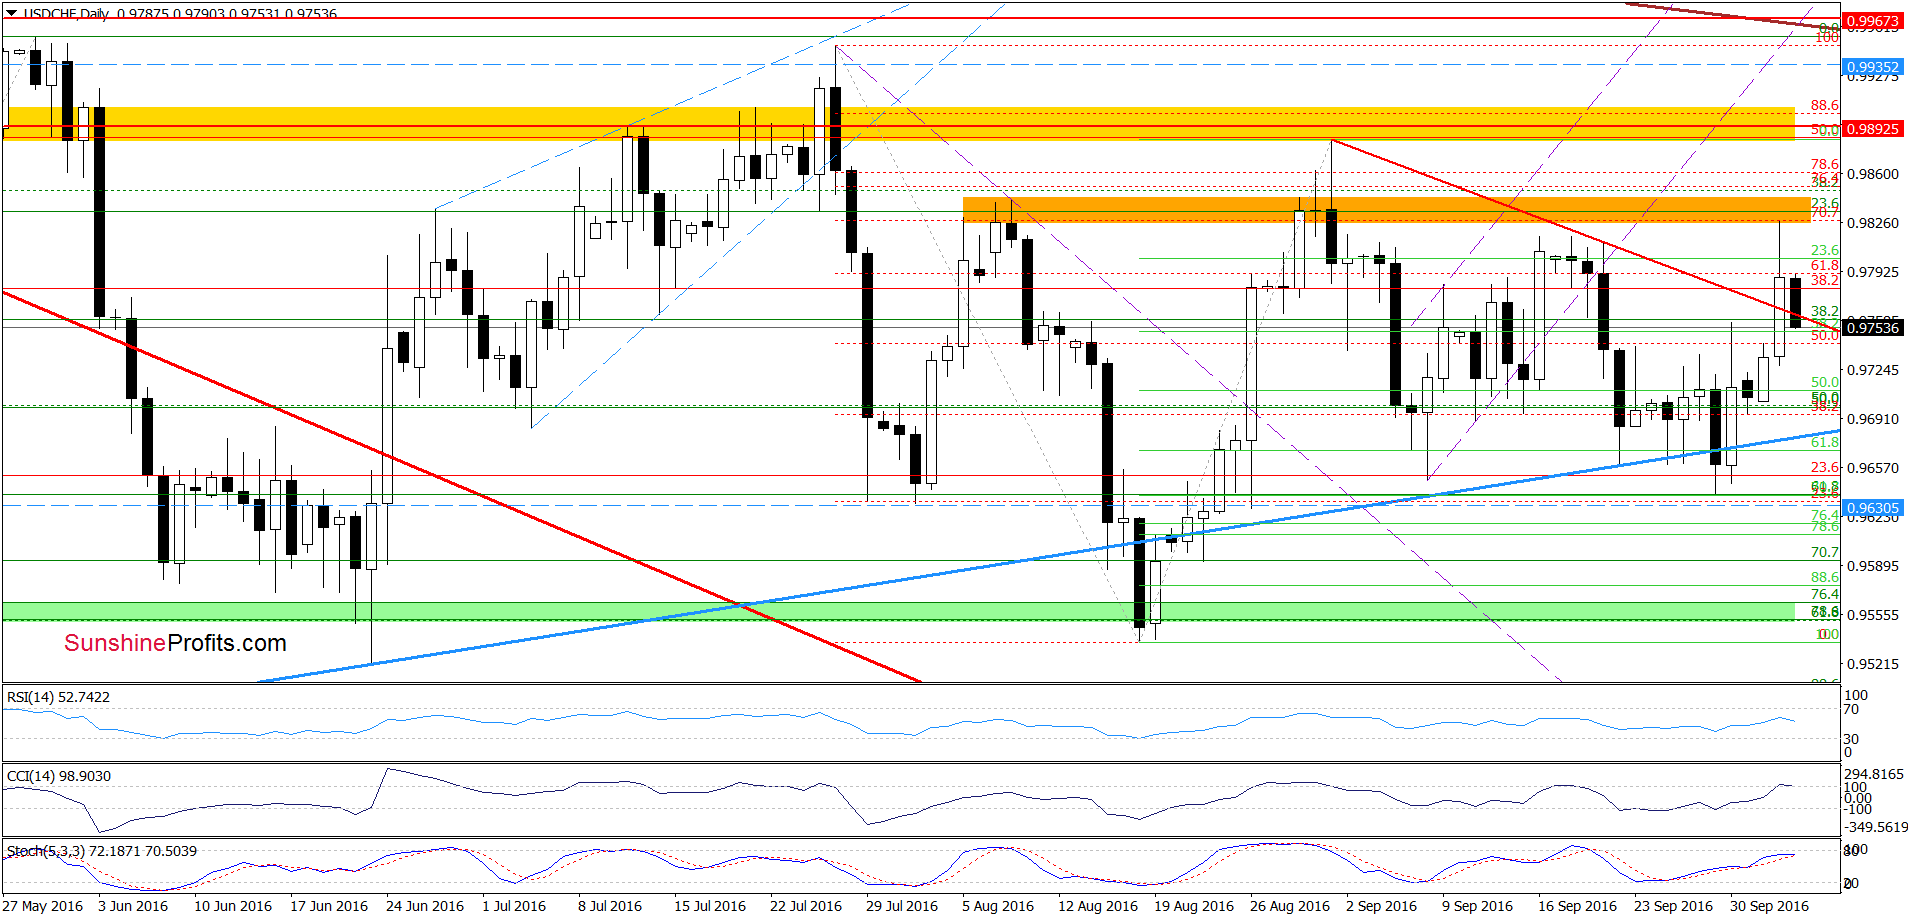
On the daily chart, we see that the pair extended gains and broke above the red declining resistance line based on the Sep highs, which triggered an increase to the orange resistance zone. In previous weeks, this area was strong enough to stop upward moves several times, which translated into another pullback yesterday. Earlier today, the pair moved even lower, which resulted in an invalidation of a breakout above the red resistance declining line. In our opinion, this is a bearish event, which in combination with the current position of the indicators suggests further deterioration in the coming days. If this is the case, USD/CHF may decline even to the blue rising support line and re-test its strength in the coming days.
Very short-term outlook: bearish
Short-term outlook: mixed
MT outlook: mixed
LT outlook: mixed
Trading position (short-term; our opinion): No positions are justified from the risk/reward perspective. We will keep you informed should anything change, or should we see a confirmation/invalidation of the above.
Thank you.
Nadia Simmons
Forex & Oil Trading Strategist
Przemyslaw Radomski, CFA
Founder, Editor-in-chief, Gold & Silver Fund Manager
Gold & Silver Trading Alerts
Forex Trading Alerts
Oil Investment Updates
Oil Trading Alerts

