

Earlier today, official data showed that Canadian gross domestic product rose 0.5% in Jul, beating analysts’ expectations. Thanks to this increase USD/CAD verified earlier breakdown under the resistance zone and eased some of yesterday’s gains. What happened at the same time with our other five currency pairs?
In our opinion the following forex trading positions are justified - summary:
- EUR/USD: long (a stop-loss order at 1.1114; initial upside target at 1.1327)
- GBP/USD: none
- USD/JPY: none
- USD/CAD: short (a stop-loss order at 1.3346; initial downside target at 1.2876)
- USD/CHF: none
- AUD/USD: none
EUR/USD
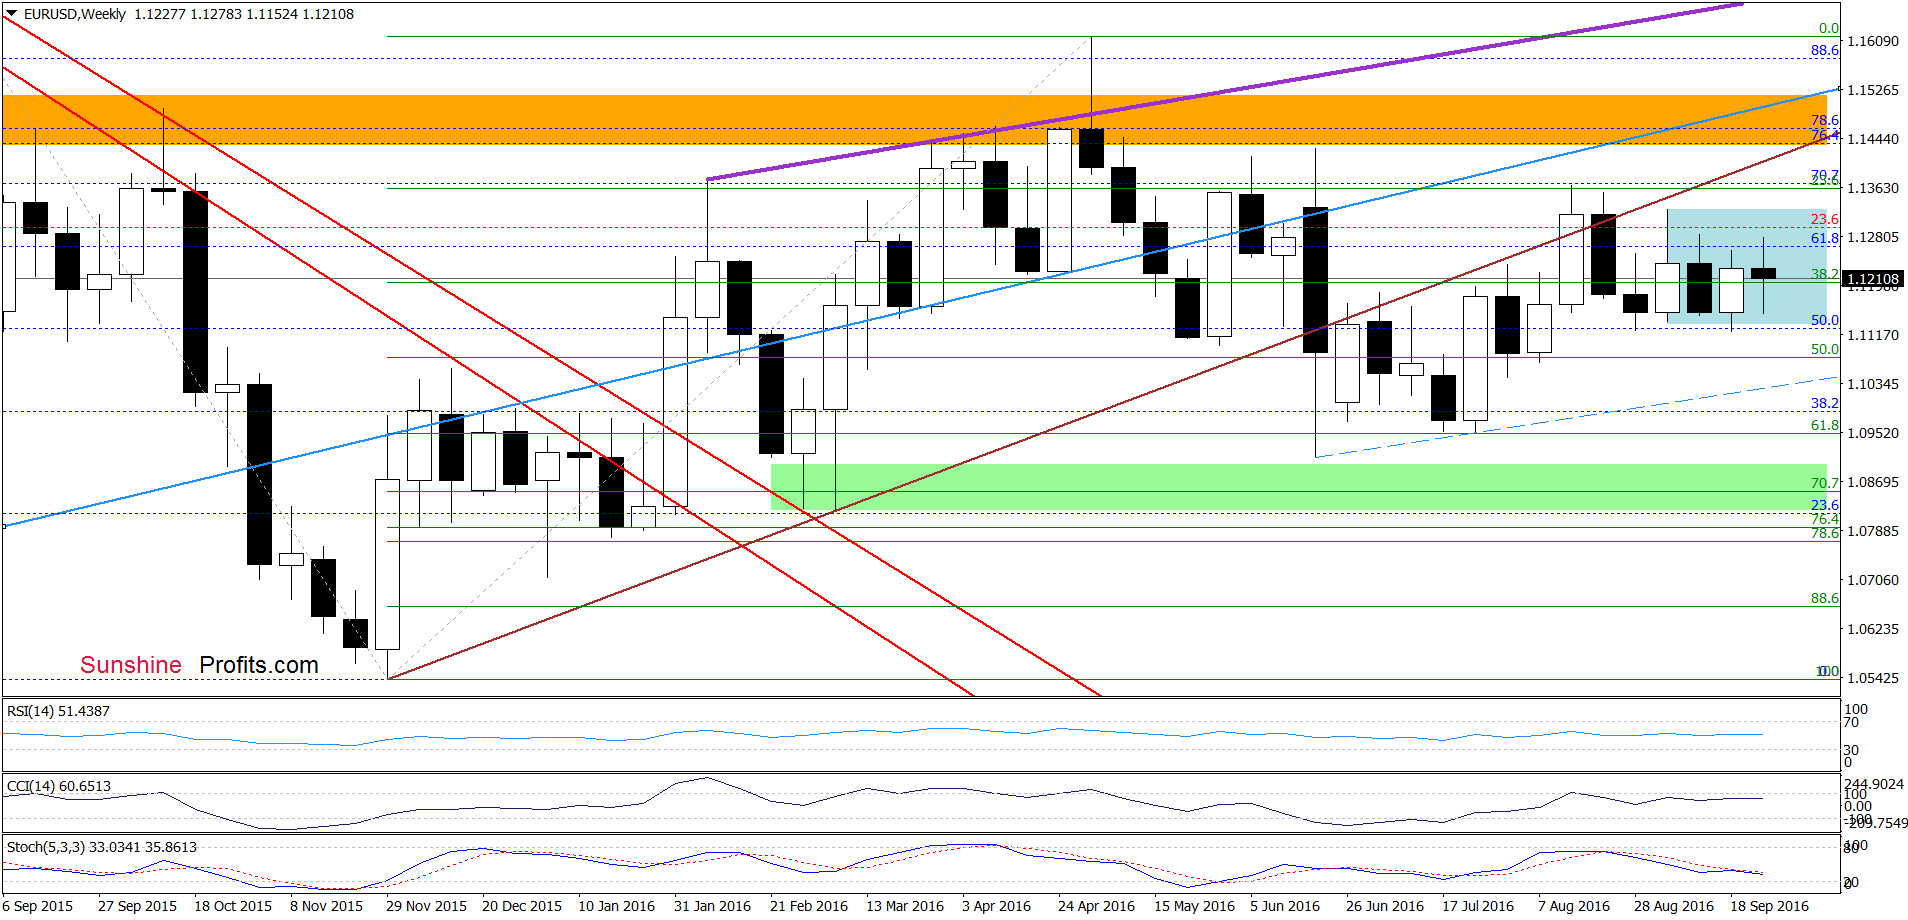
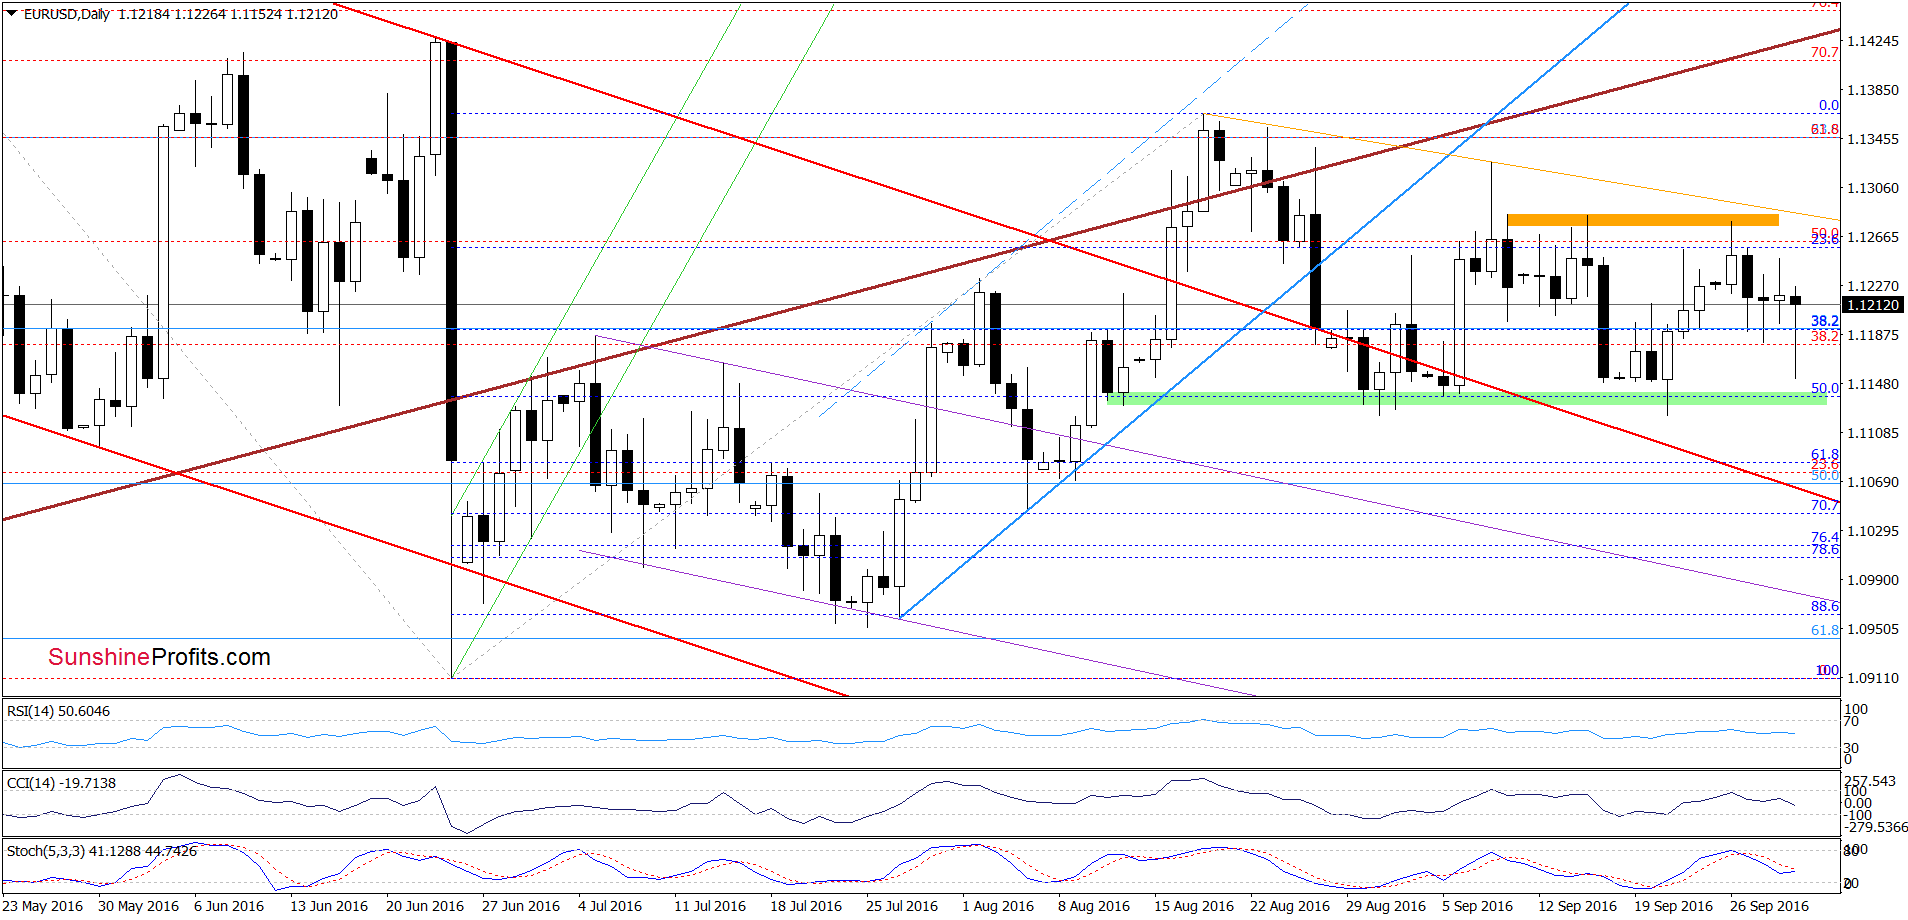
On the daily chart, we see that although EUR/USD moved sharply lower earlier today, the proximity to the previous Sep lows and the green support zone encouraged currency bulls to act, which resulted in a quick rebound. In this way, the exchange rate came back to yesterday’s levels, which means that another attempt to move higher is likely – especially if the Stochastic Oscillator generates a buy signal in the coming day(s).
Very short-term outlook: bullish
Short-term outlook: mixed with bullish bias
MT outlook: mixed
LT outlook: mixed
Trading position (short-term; our opinion): Long positions (with a stop-loss order at 1.1114 and initial upside target at 1.1327) are justified from the risk/reward perspective. We will keep you informed should anything change, or should we see a confirmation/invalidation of the above.
GBP/USD
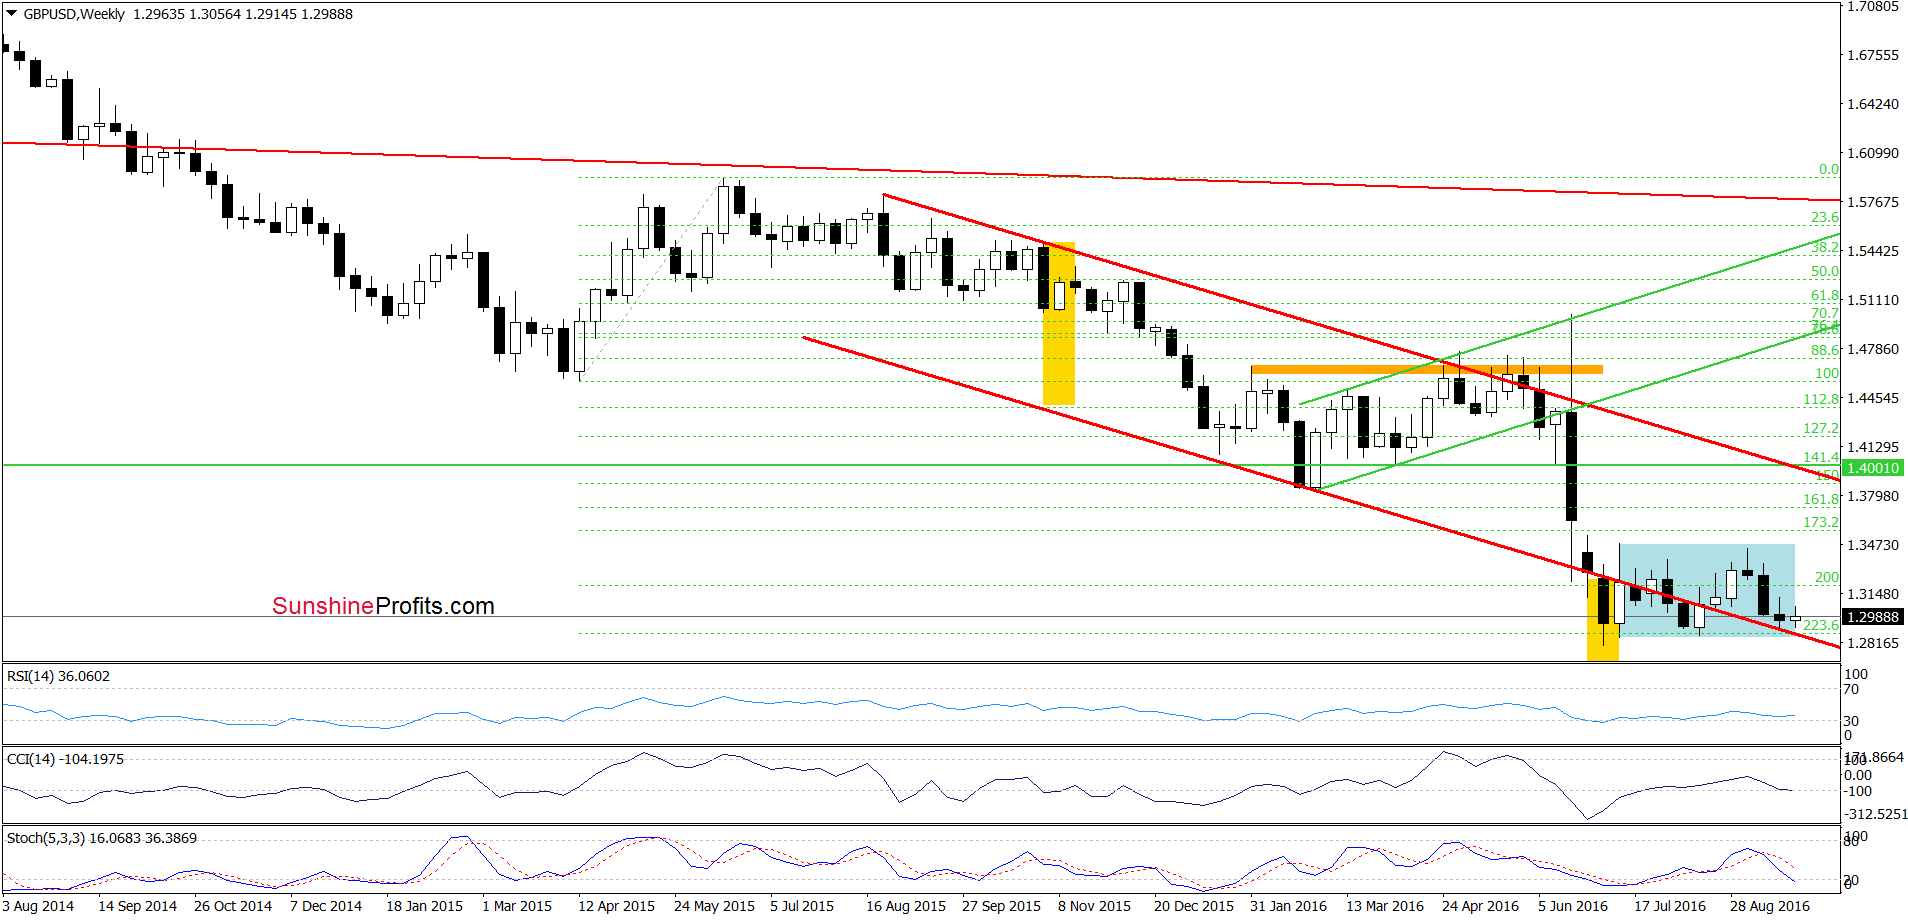
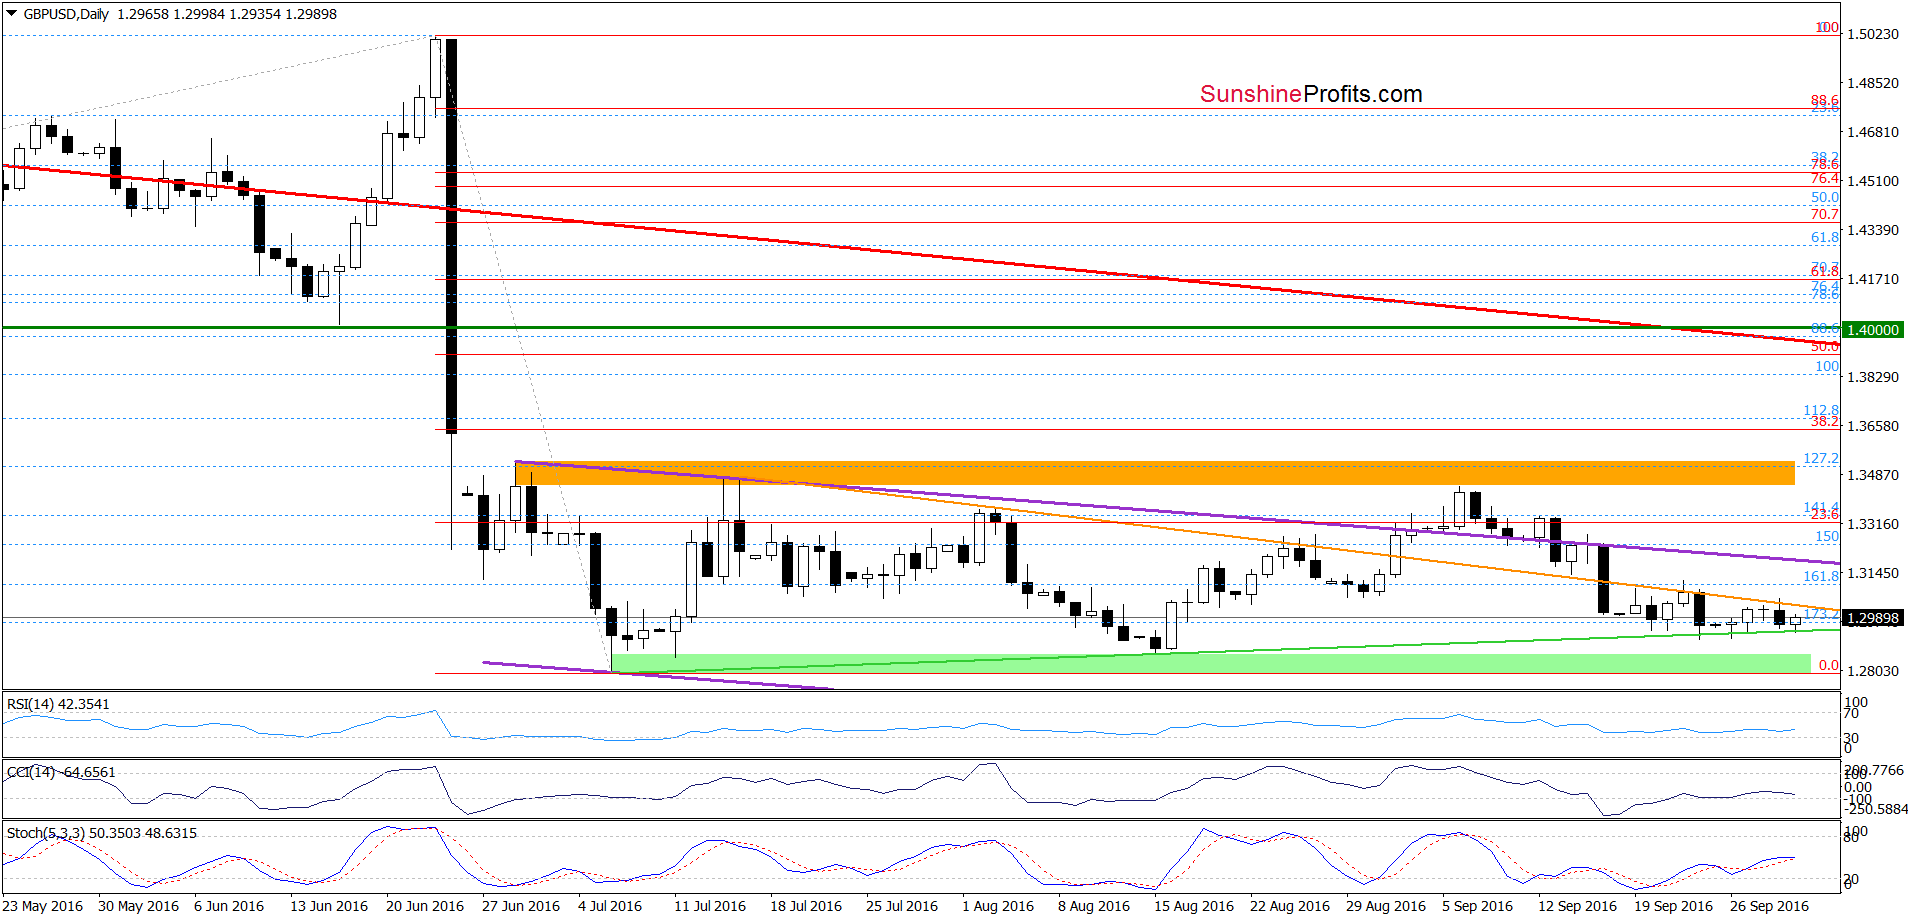
Yesterday, we wrote the following:
(…) GBP/USD reached the orange resistance line, which could pause further improvement – similarly to what we saw a week ago.
From today’s point of view, we see that the situation developed in tune with yesterday’s assumptions and GBP/USD gave up some gains. However, earlier today, the pair rebounded slightly, which means that our previous commentary on this currency pair remains up-to-date:
(…) in our opinion, as long as there won’t be invalidation of the breakdown under this resistance line another bigger move to the upside is not likely to be seen. Nevertheless, we should keep in mind that buy signals generated by the indicators remain in play, supporting another attempt to move higher.
Very short-term outlook: mixed
Short-term outlook: mixed
MT outlook: mixed
LT outlook: bearish
Trading position (short-term; our opinion): No positions are justified from the risk/reward perspective. We will keep you informed should anything change, or should we see a confirmation/invalidation of the above.
USD/JPY
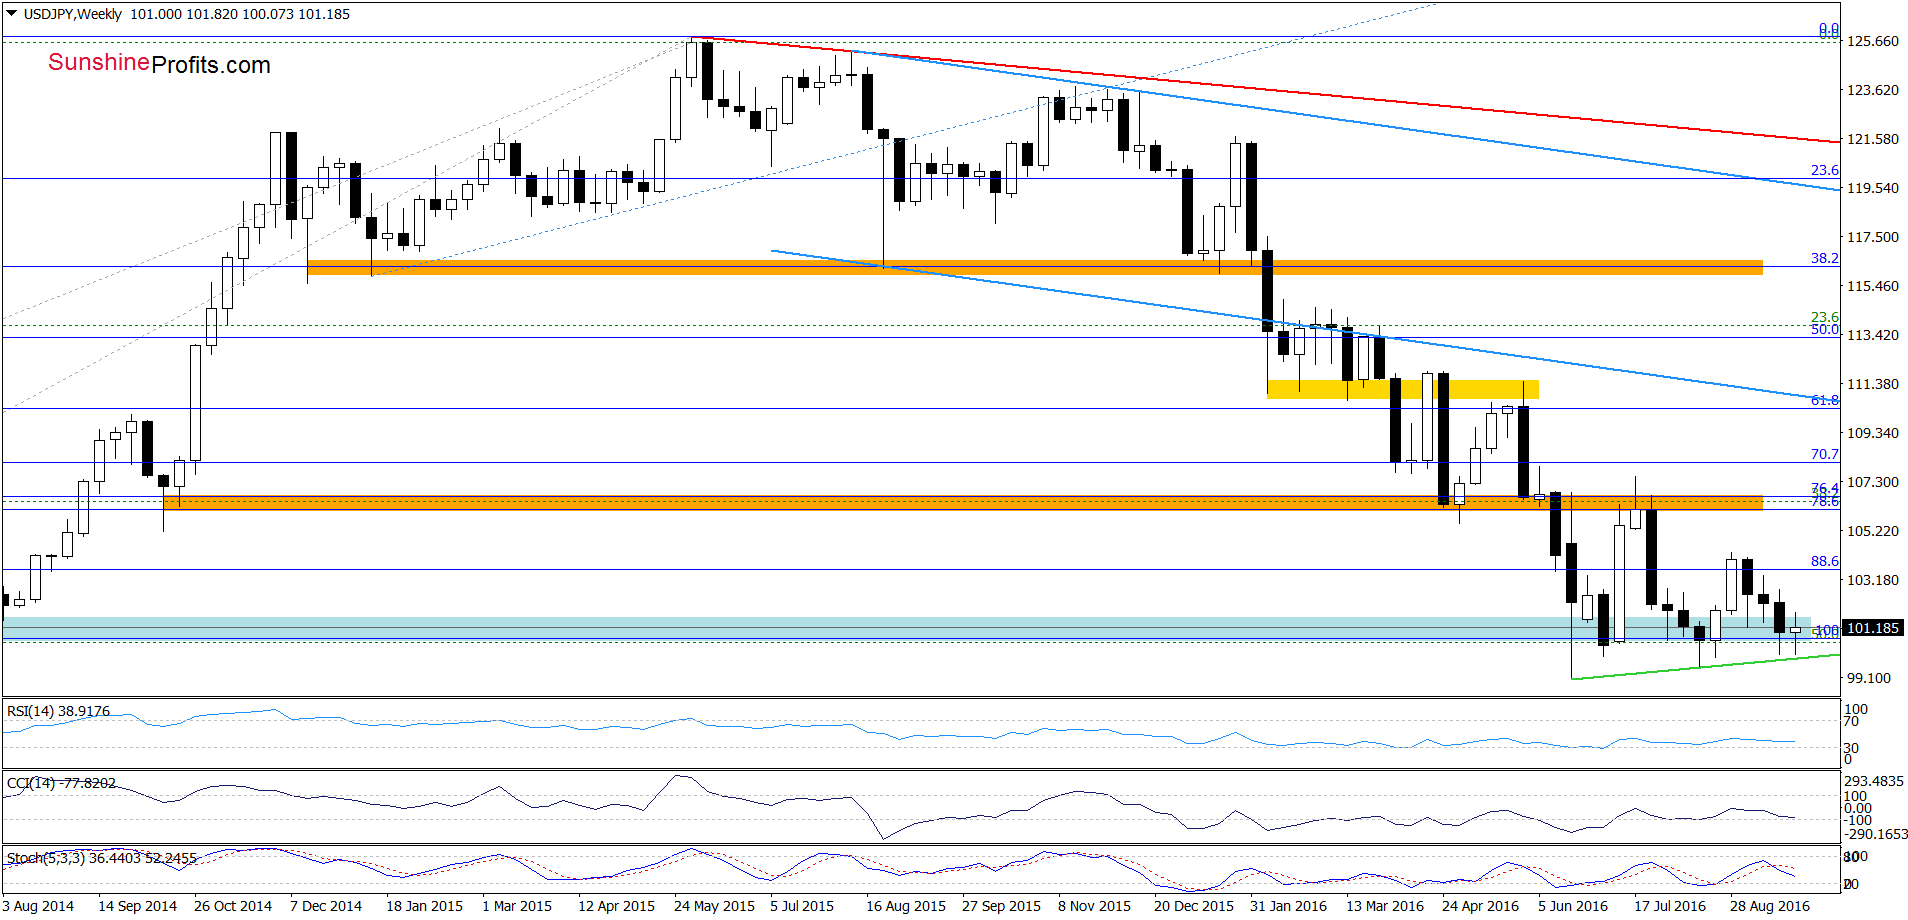
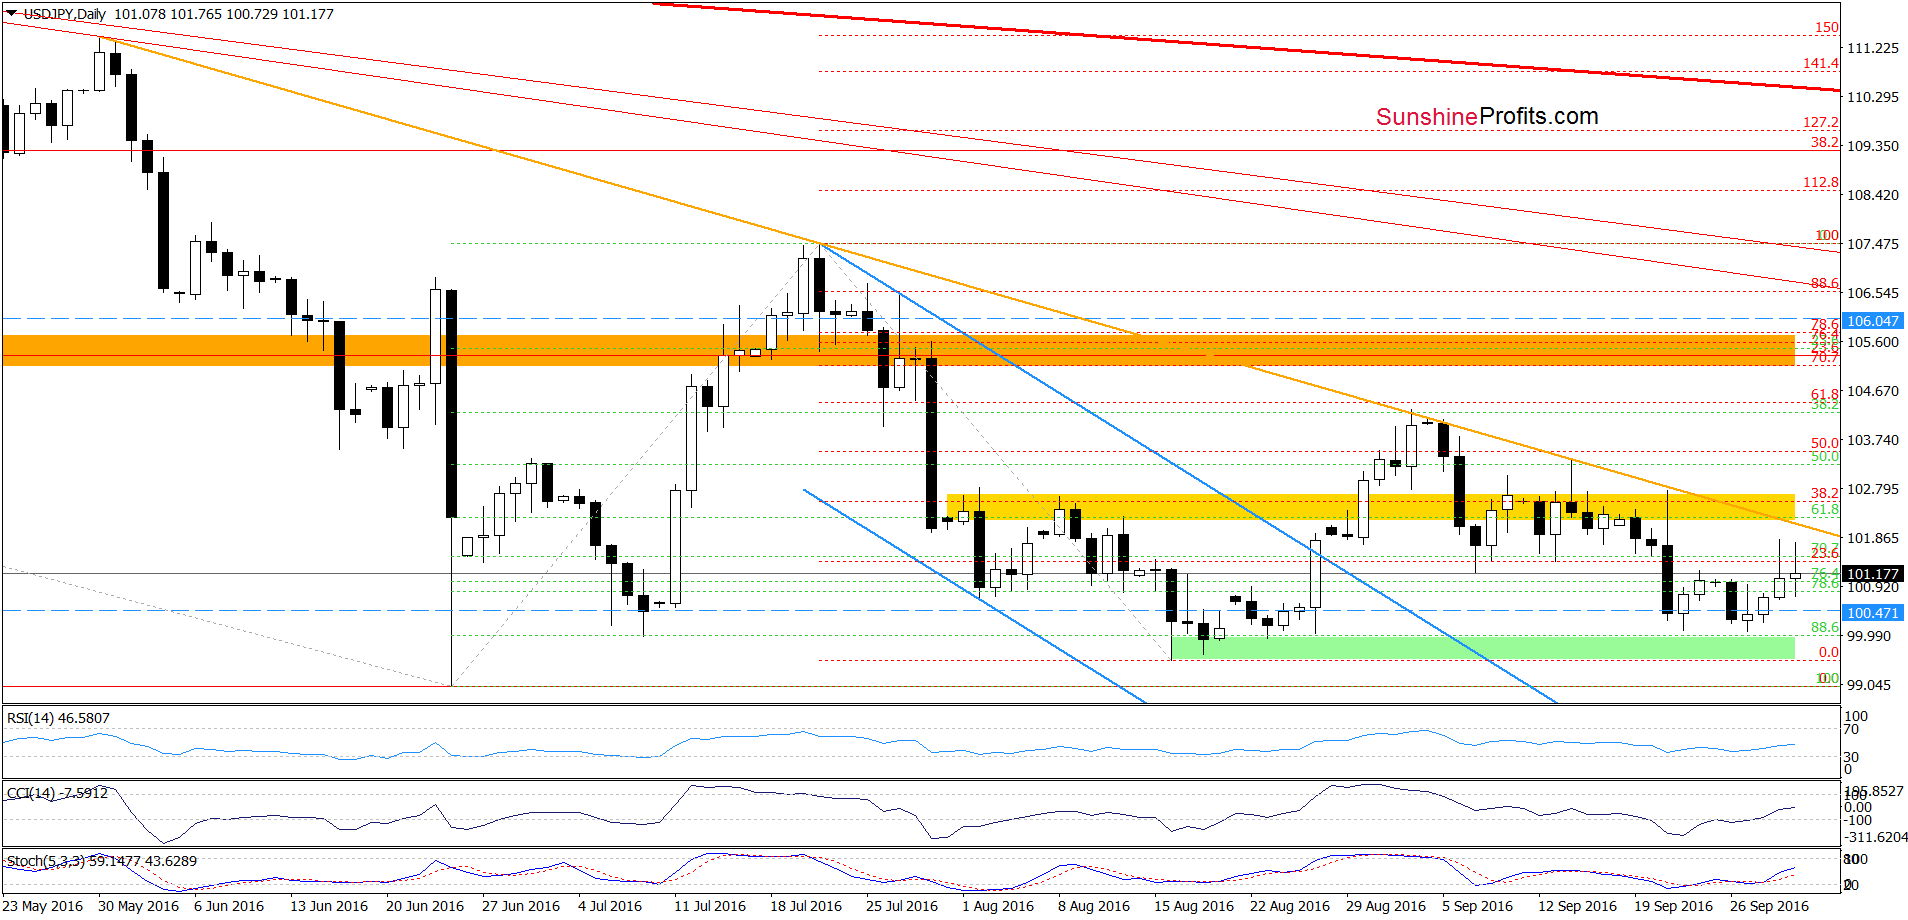
Looking at the daily chart, we see that USD/JPY is wavering around the last Friday high of 101.22, which suggests that what we wrote on Thursday is still valid:
(…) the green support line based on the Jun and Aug lows triggered a rebound in recent days, however, we saw similar price action in the previous week. Therefore, in our opinion, as long as there won’t be breakout above the orange declining resistance line (…) another bigger move to the upside is not likely to be seen.
Nevertheless, (…) the CCI generated a buy signal, while the Stochastic Oscillator is very close to doing the same, which suggests that further improvement is just around the corner.
Very short-term outlook: mixed with bullish bias
Short-term outlook: mixed
MT outlook: mixed
LT outlook: mixed
Trading position (short-term; our opinion): No positions are justified from the risk/reward perspective. We will keep you informed should anything change, or should we see a confirmation/invalidation of the above.
USD/CAD
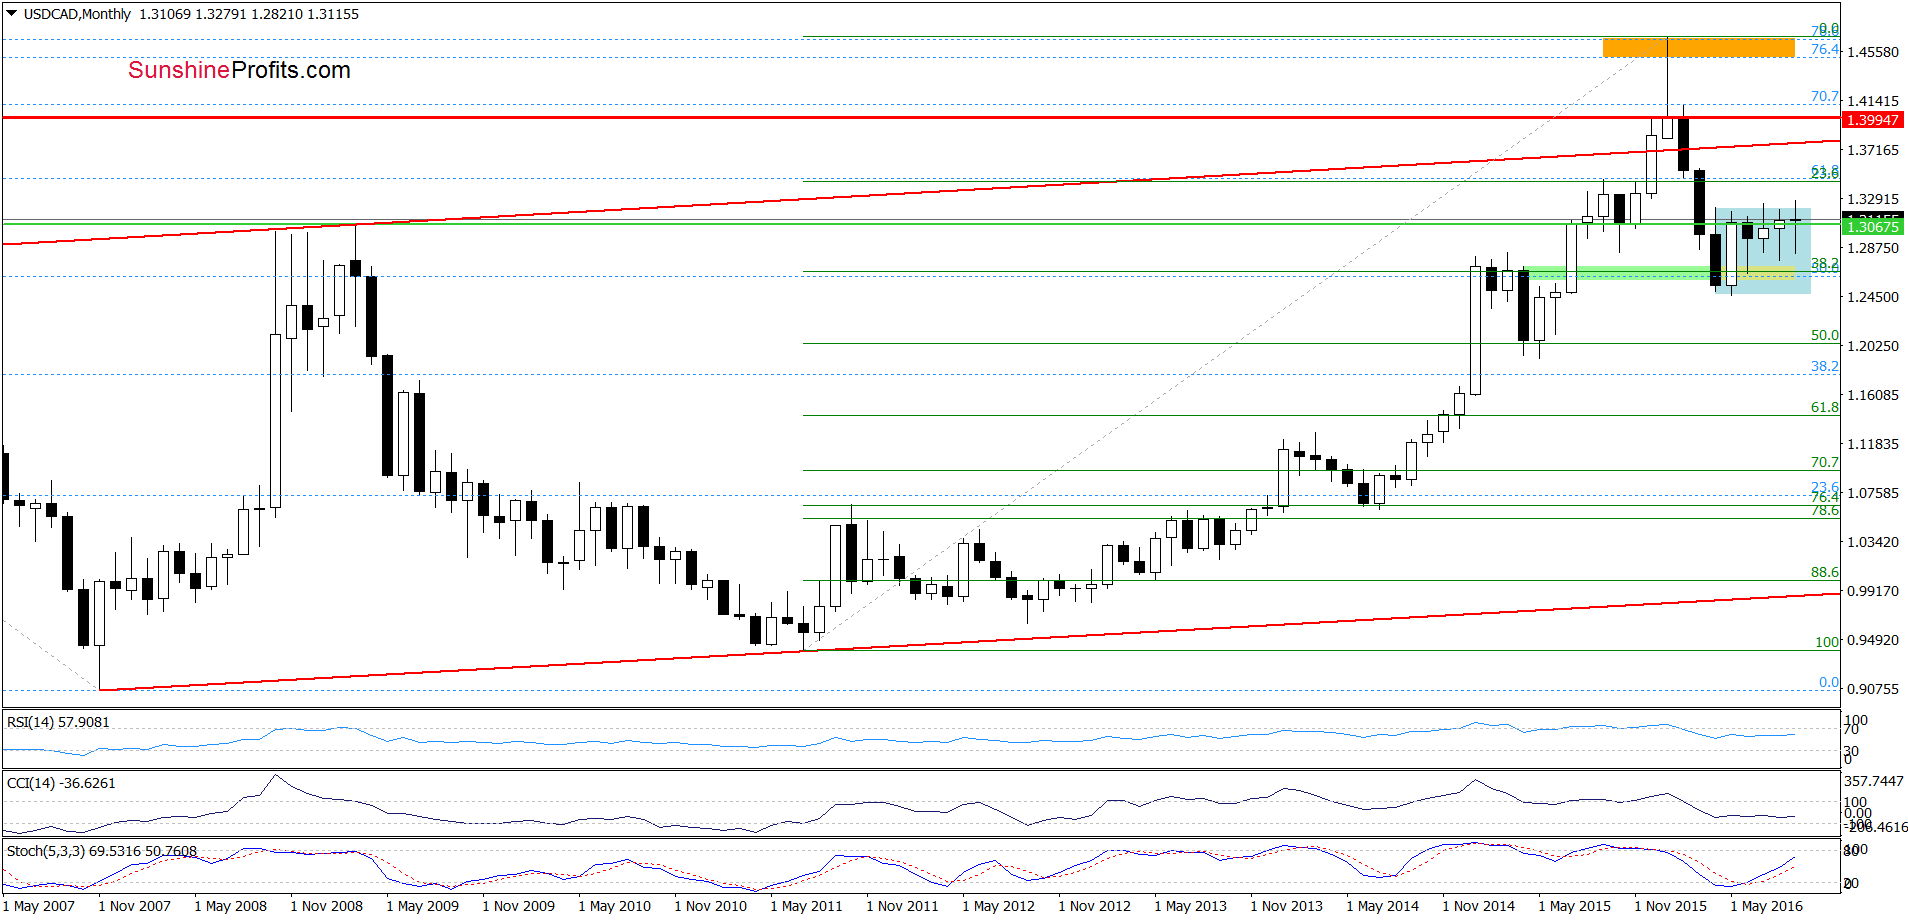
On the monthly chart, we see that USD/CAD came back to the blue consolidation and invalidated earlier breakout above the upper border of the formation. Such price action is a negative signal, which suggests further deterioration in the coming week – especially if the exchange rate closes today’s session (and the whole month) under 1.3214 (the Apr peak).
Will the very short-term chart confirm this scenario? Let’s check.
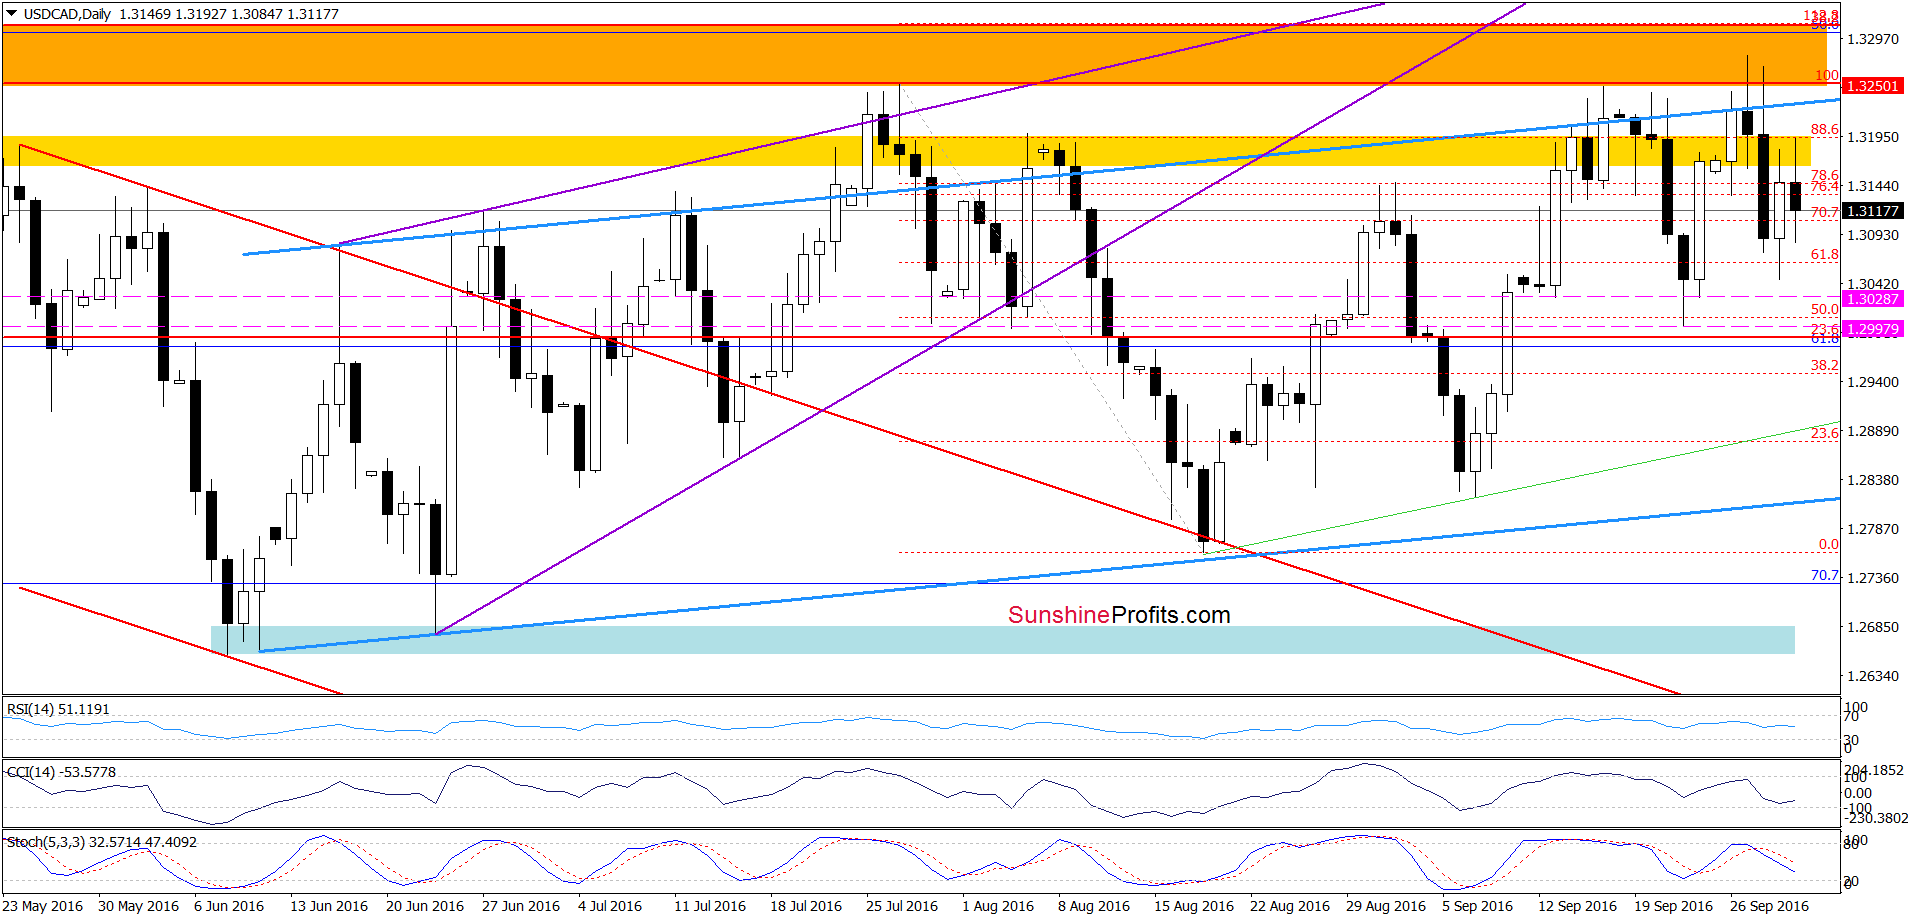
Yesterday (and also earlier today), currency bulls pushed USD/CAD higher, but they didn’t manage to hold gained levels, which resulted in a pullback. In this way, the pair verified earlier breakdown under the yellow resistance zone, which in combination with sell signals generated by the indicators increases the probability of further declines. If this is the case and the pair moves lower from current levels, the first downside target would be around 1.3000-1.3028, where the last week’s lows are.
Very short-term outlook: bearish
Short-term outlook: mixed with bearish bias
MT outlook: mixed
LT outlook: mixed
Trading position (short-term; our opinion): Short positions (with a stop-loss order at 1.3346 and initial downside target at 1.2876) are justified from the risk/reward perspective. We will keep you informed should anything change, or should we see a confirmation/invalidation of the above.
USD/CHF
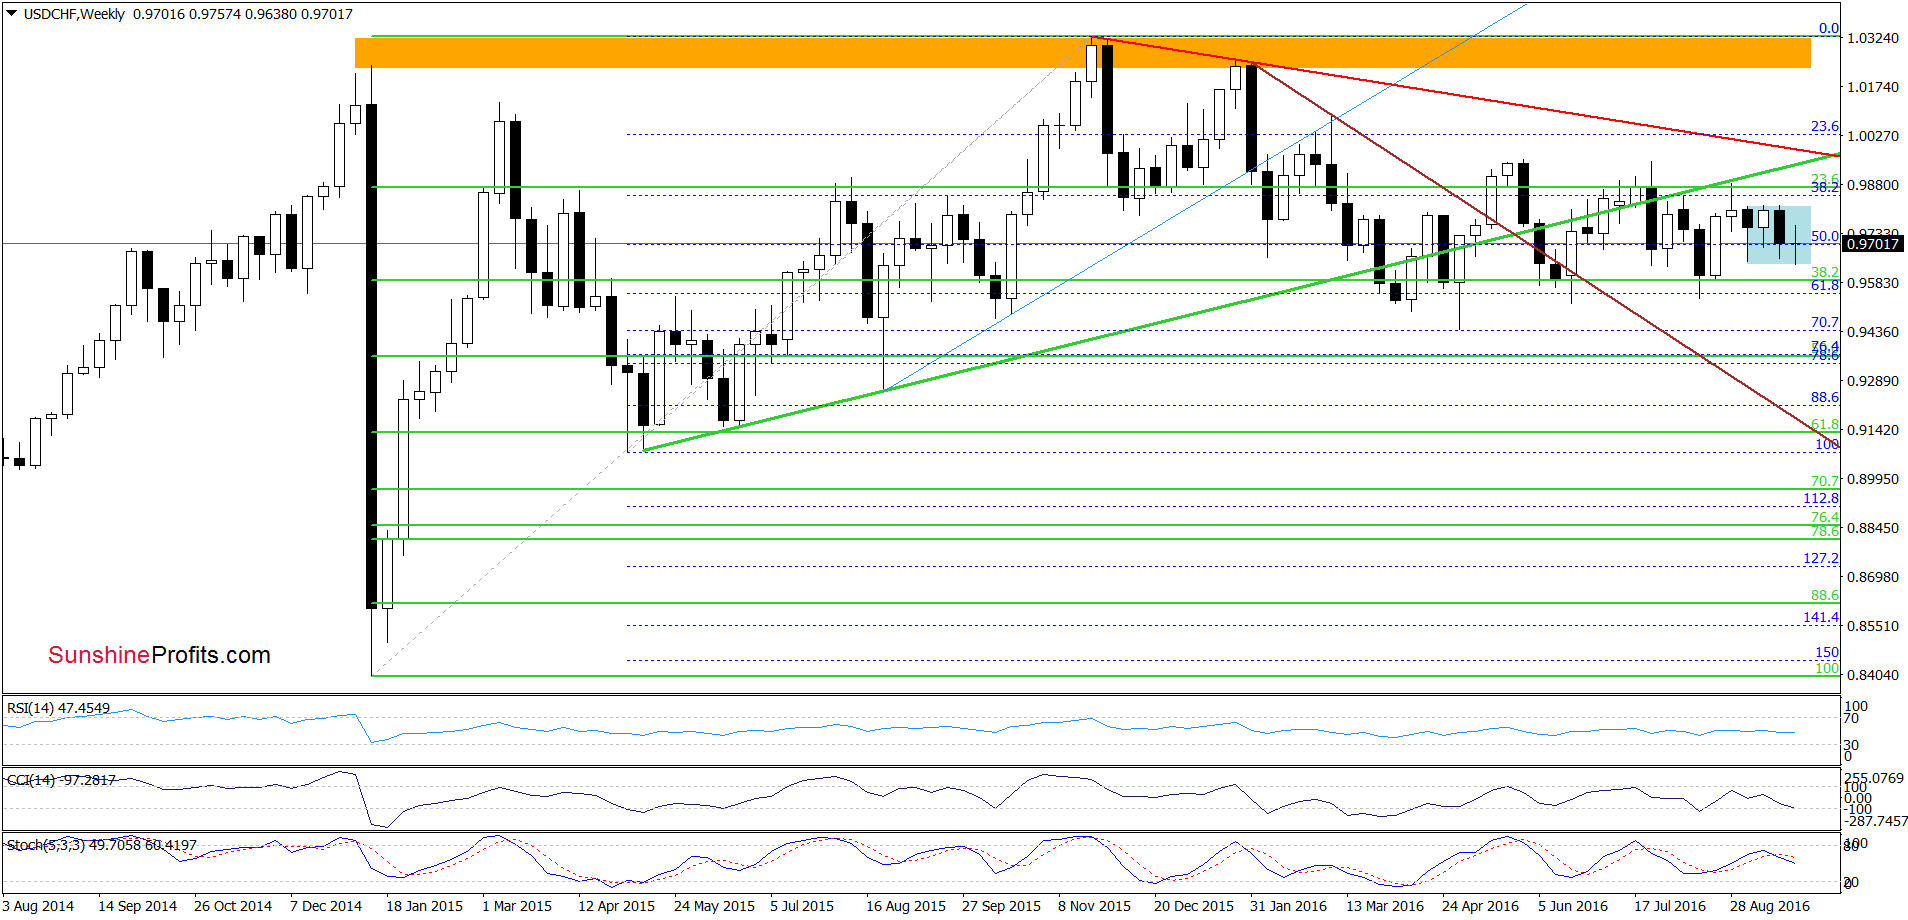
The situation in the medium term remains almost unchanged as USD/CHF is still wavering between Sep high and low.
Will the very short-term chart give us more clues about future moves? Let’s check.
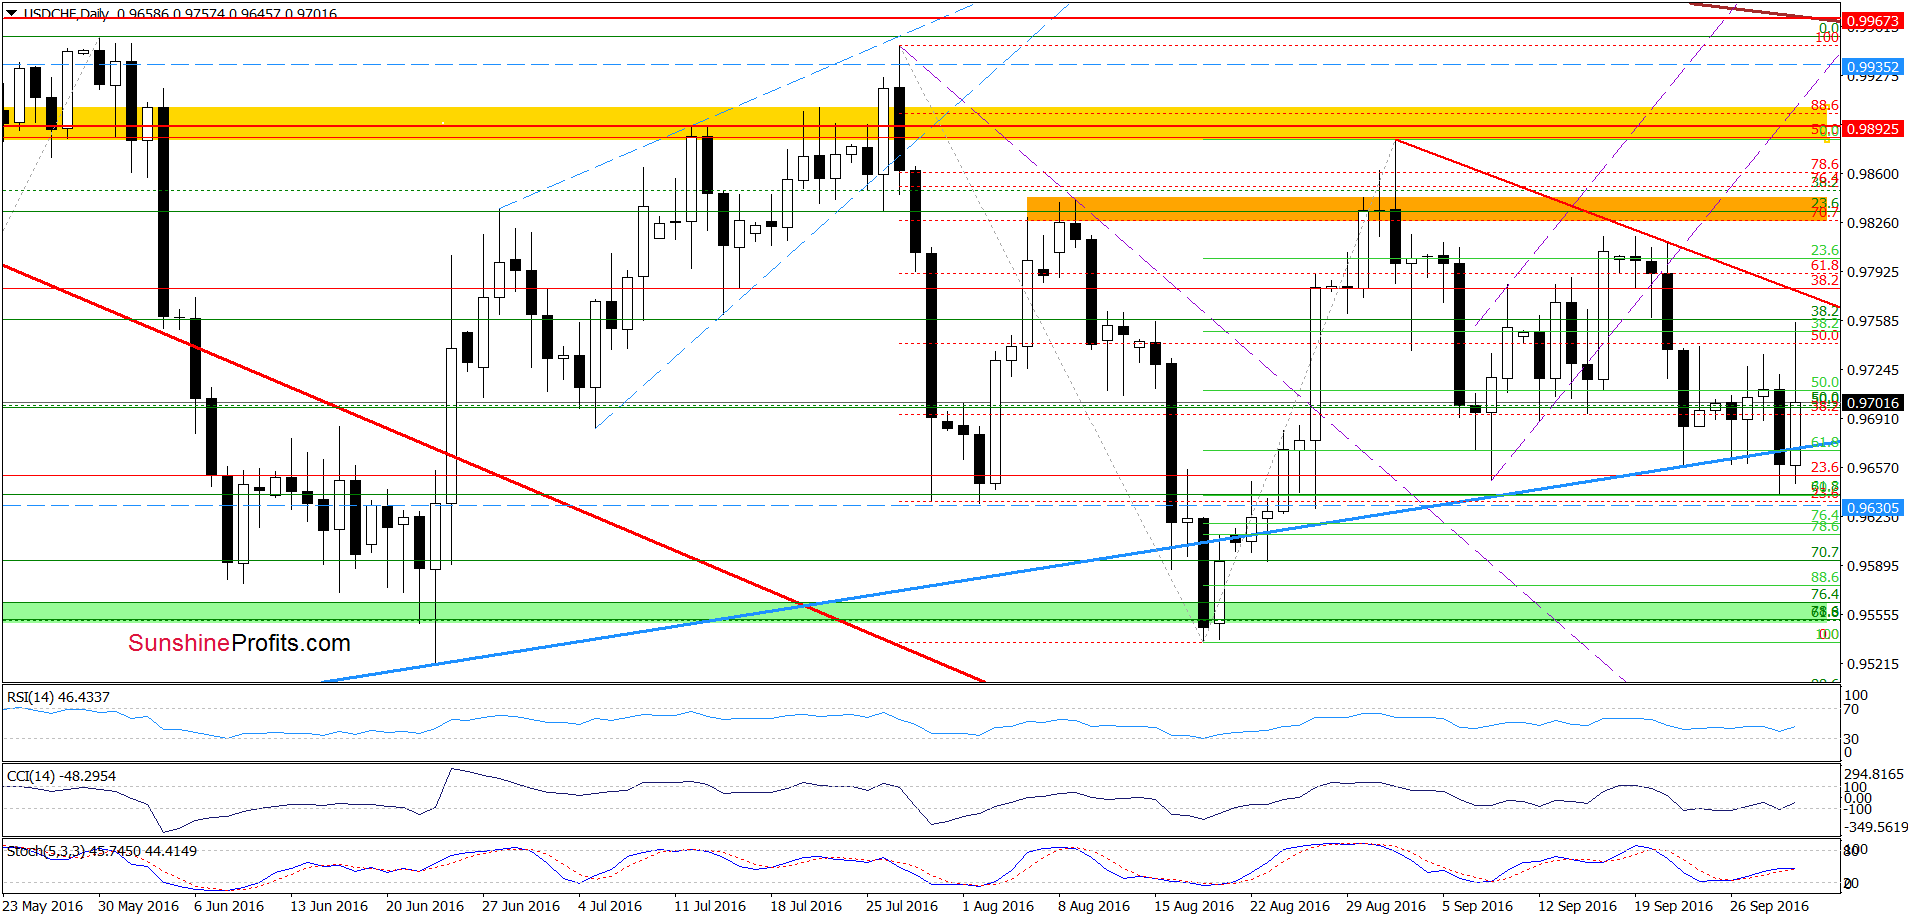
On Monday, we wrote:
(…) Although, the blue support line triggered a rebound, sell signals are still in play, which suggests that another downswing and a re-test of the blue line is likely in the coming days.
Looking at the daily chart, we see that the situation developed in line with the above scenario and USD/CHF re-tested the blue line several times in recent days. Although the exchange rate declined sharply and closed the day below it yesterday, currency bulls came back to the market and triggered a sharp rebound, which erased Thursday’s losses. What’s next? Taking into account today’s invalidation of the breakdown and buy signals generated by the indicators, we think that the pair will extend gains and (at least) climb to the red declining resistance line based on the Sep highs in the coming week.
Very short-term outlook: bullish
Short-term outlook: mixed
MT outlook: mixed
LT outlook: mixed
Trading position (short-term; our opinion): No positions are justified from the risk/reward perspective. We will keep you informed should anything change, or should we see a confirmation/invalidation of the above.
AUD/USD
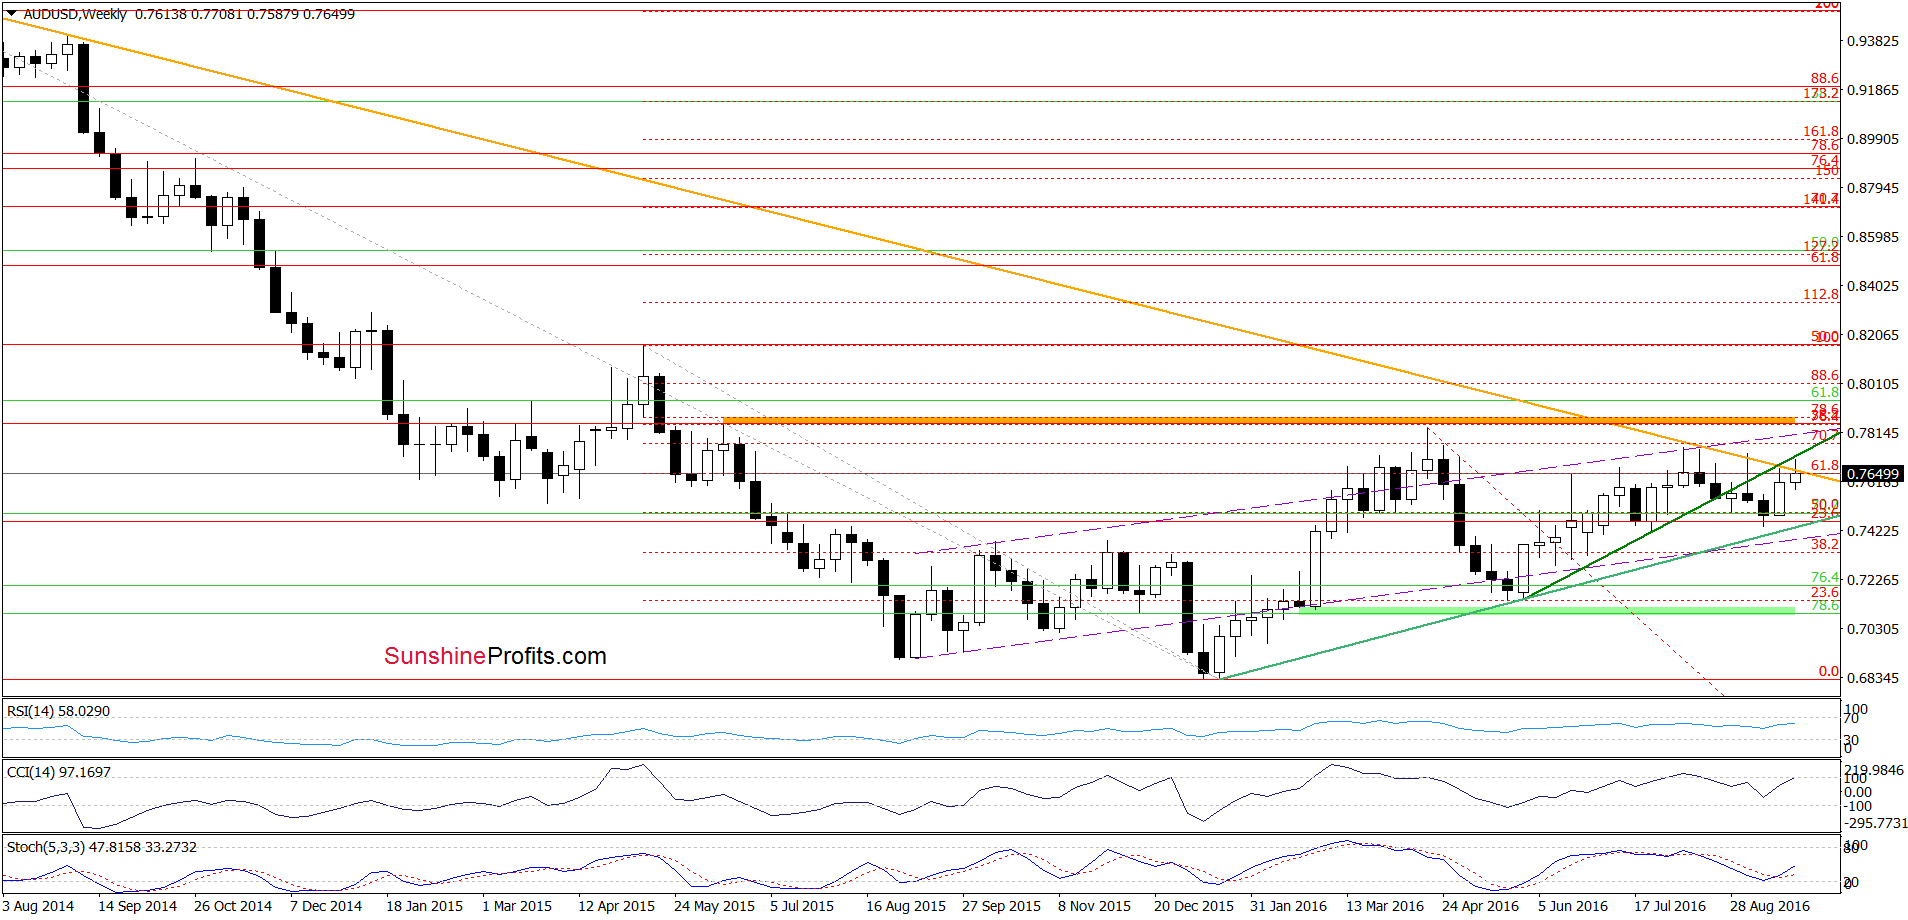
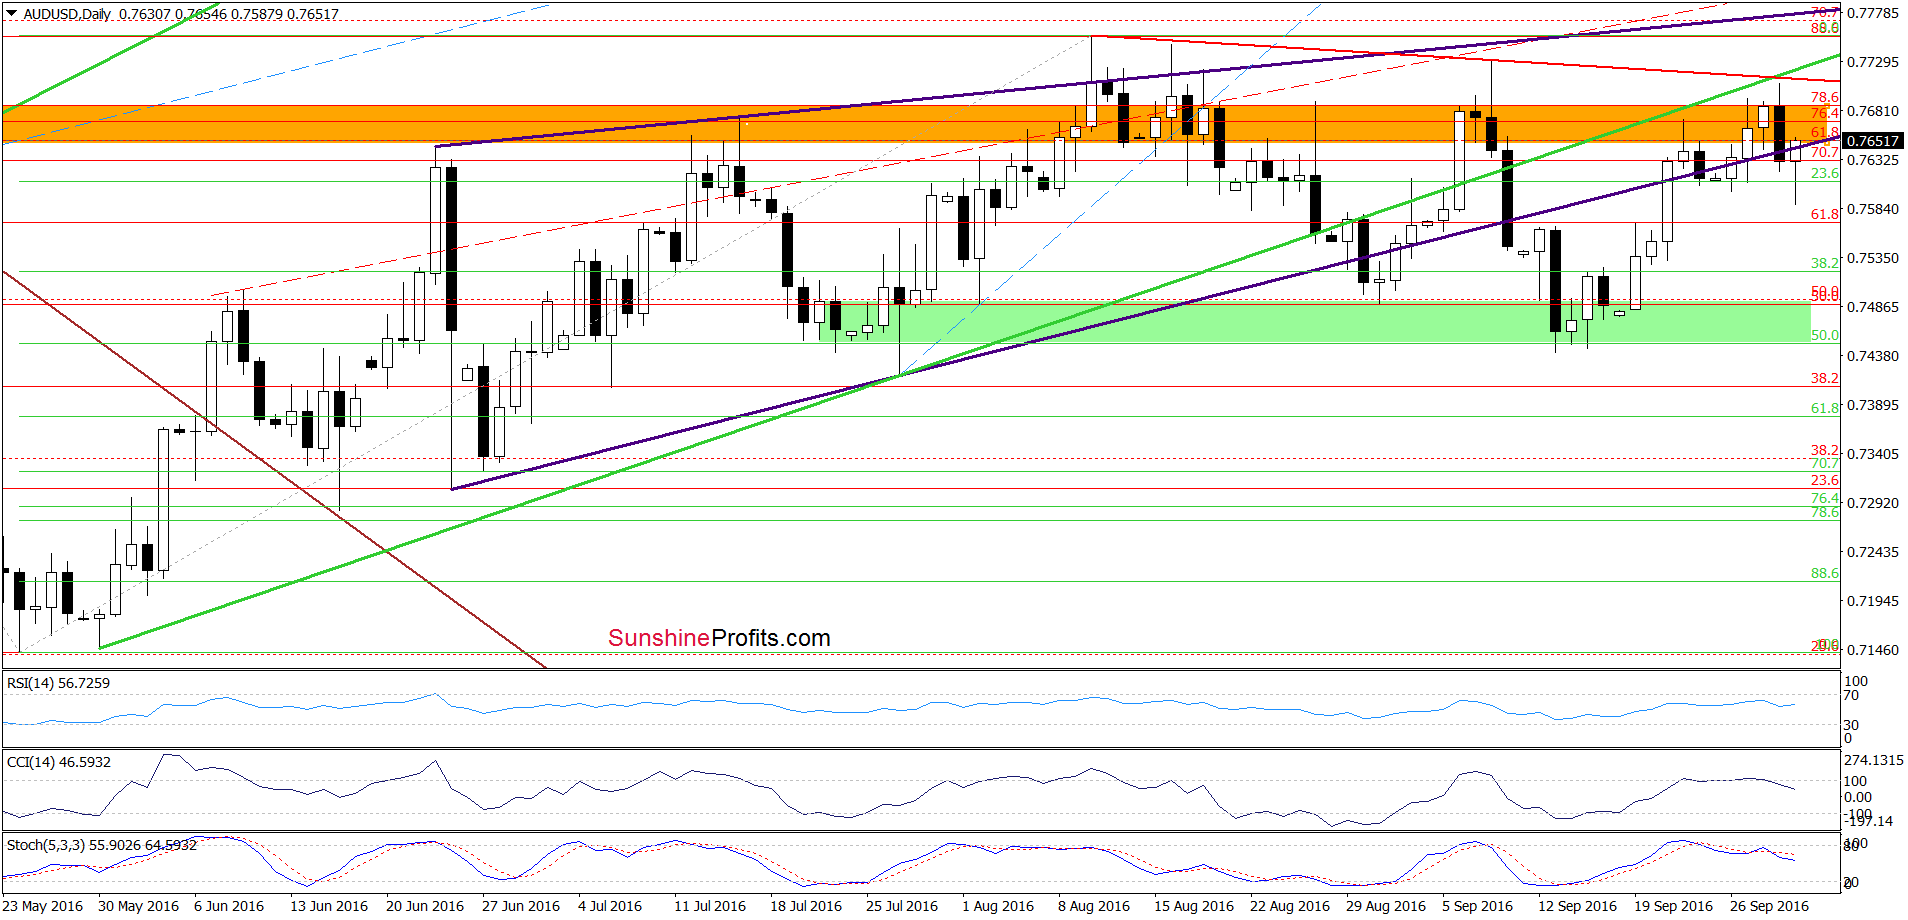
Looking at the above charts, we see that AUD/USD declined and slipped under the purple support line yesterday. However, despite this deterioration, currncy bulls pushed the pair higher earlier today, which resulted in invalidation of the breakdown. Although this is a positive signl that suggests further deterioration, we should keep in mind that sell signals generated by the indicators are still in play. Additionally, the medium-term green rising line and the long-term declining orange resistance line (both marked on the weekly chart) and the orange resistance zone (seen on the daily chart) coninue to keep gains in check. Therefore, in our opinion, the space for potential gains is limited and another attempt to move lower is just around the corner.
Very short-term outlook: mixed with bearish bias
Short-term outlook: mixed with bearish bias
MT outlook: mixed
LT outlook: mixed
Trading position (short-term; our opinion): No positions are justified from the risk/reward perspective. We will keep you informed should anything change, or should we see a confirmation/invalidation of the above.
Thank you.
Nadia Simmons
Forex & Oil Trading Strategist
Przemyslaw Radomski, CFA
Founder, Editor-in-chief, Gold & Silver Fund Manager
Gold & Silver Trading Alerts
Forex Trading Alerts
Oil Investment Updates
Oil Trading Alerts

