

Although the U.S. dollar increased against its Canadian counterpart on declining crude oil prices, USD/CAD reversed and decline after disappointing U.S. housing sector data. Did this move change anything in the technical picture of the exchange rate?
In our opinion the following forex trading positions are justified - summary:
- EUR/USD: none
- GBP/USD: none
- USD/JPY: none
- USD/CAD: short (a stop-loss order at 1.3346; initial downside target at 1.2876)
- USD/CHF: none
- AUD/USD: none
EUR/USD
The situation in the medium-term hasn’t changed much as EUR/USD is trading between last week’s high and low. Today, we’ll focus on the very short-term changes.
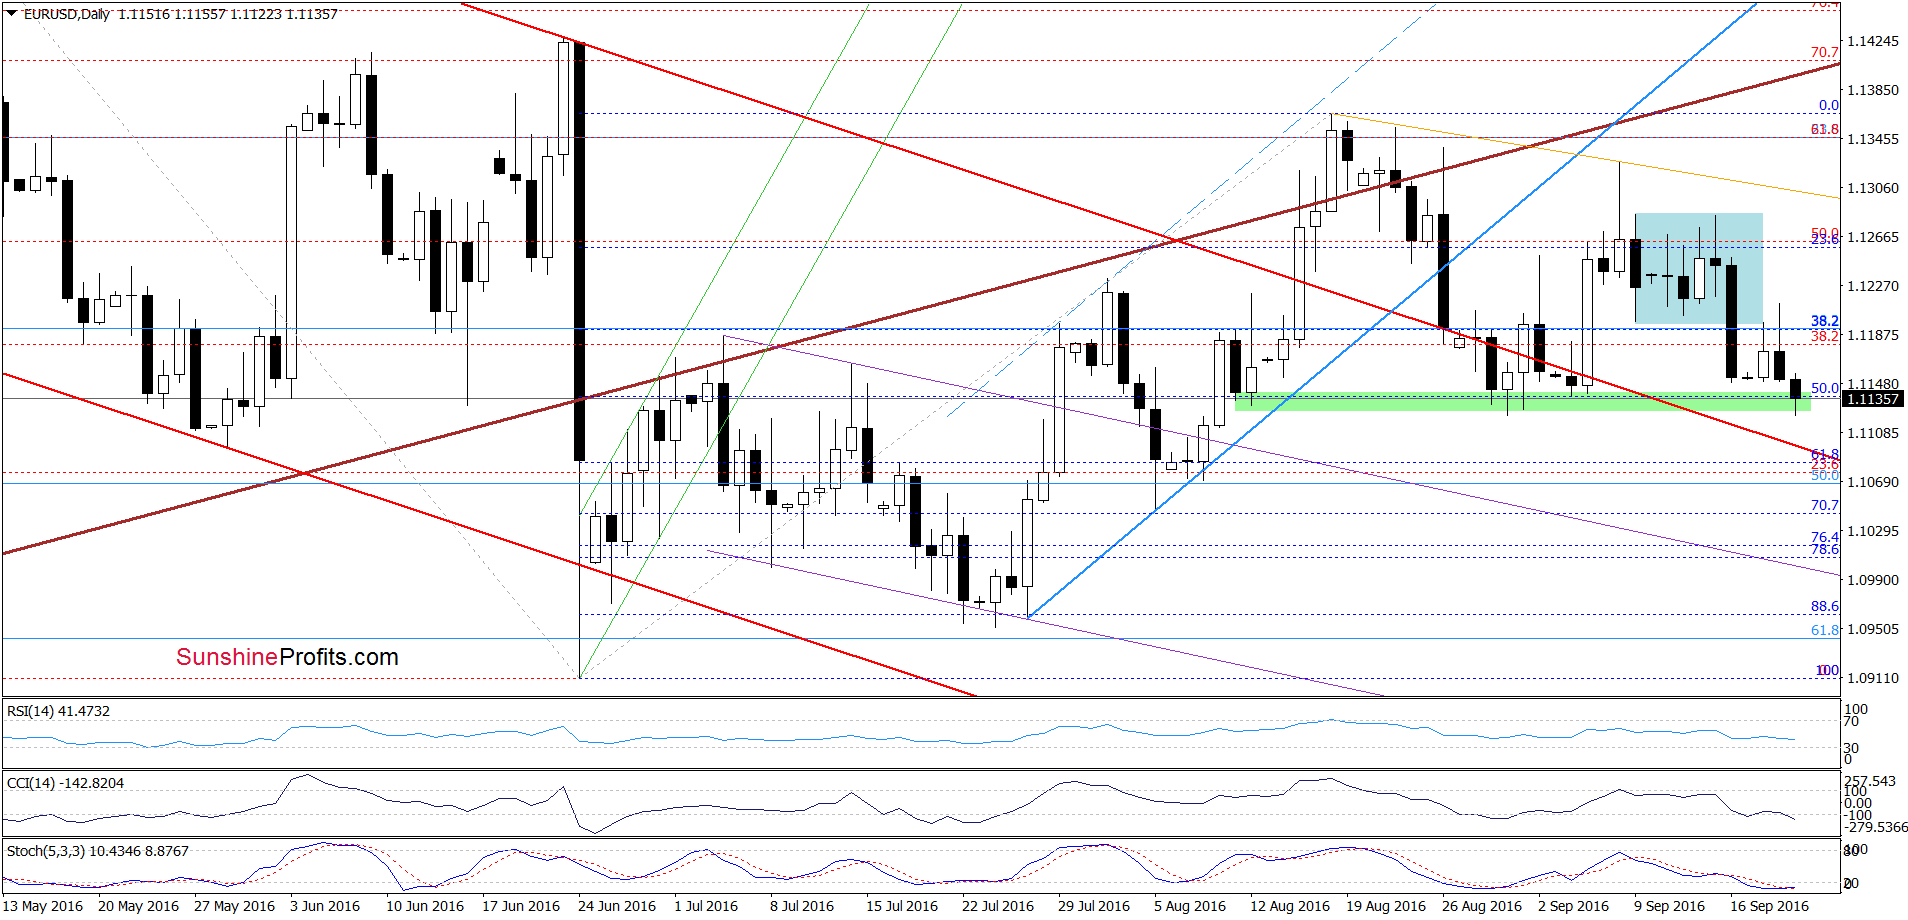
Looking at the daily chart, we see that EUR/USD extended losses earlier today, which means that what we wrote yesterday is up-to-date:
(…) the pair climbed to the previously-broken lower line of the formation, which looks like a verification of the breakdown. If this is the case, we’ll likely see another downswing and a re-test of the green zone (or even the upper border of the red declining trend channel). Nevertheless, the current position of the indicators (the CCI generated a buy signal, while the Stochastic Oscillator is very close to doing the same) suggests that the space for declines is limited and reversal in the coming day (maybe even later in the day) is very likely.
Very short-term outlook: mixed
Short-term outlook: mixed
MT outlook: mixed
LT outlook: mixed
Trading position (short-term; our opinion): No positions are justified from the risk/reward perspective. However, if we see more bullish developments, we’ll likely open long positions). We will keep you informed should anything change, or should we see a confirmation/invalidation of the above.
USD/CAD
Yesterday, we wrote the following:
(…) USD/CAD is trading in the blue consolidation and currently increased to the upper line of the formation. As you see, this area was strong enough to stop bulls in the previous months, which suggests that history will likely repeat itself once again and we’ll see a reversal and decline in the coming week.
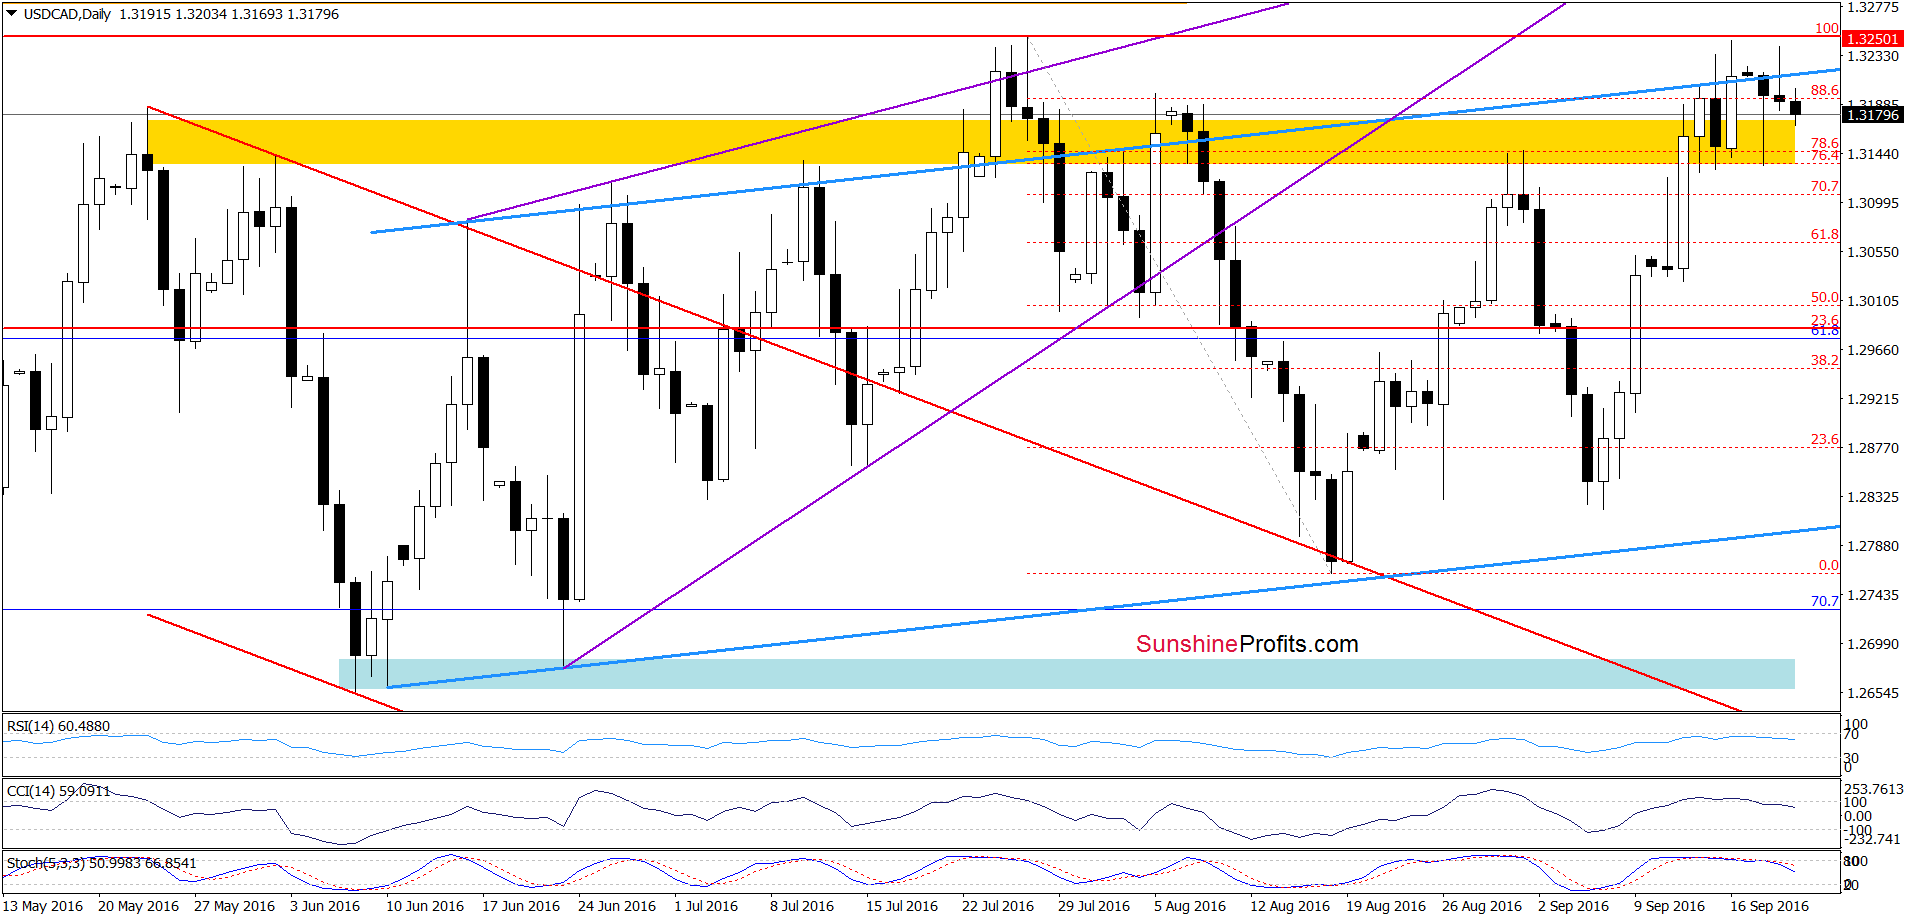
(…) USD/CAD declined and invalidated earlier breakout above the upper border of the blue rising trend channel yesterday. Although the pair rebounded after a drop to the yellow zone (which serves now as support), erasing most of earlier losses, we think that as long as there won’t be a daily closure above the blue resistance line all upswings will be nothing more than verification of yesterday’s breakdown. Additionally, the current position of the indicators suggests that the space for gains is limited and lower values of the exchange rate in the coming week are very likely (even if currency bulls re-test the recent highs).
Finishing our yesterday’s commentary we also added:
(…) No positions are justified from the risk/reward perspective. Nevertheless, if we see another daily closure under the upper line of the blue rising trend channel (seen on the daily chart), we’ll consider opening short positions.
Looking at the daily chart, we see that although currency bulls pushed USD/CAD higher (in line with our assumptions) yesterday, they didn’t manage to hold gained levels, which resulted in another pullback and invalidation of the breakout above the upper border of the blue rising trend channel. Additionally, the pair closed yesterday’s session under this line, which encouraged currency bears to act earlier today. Taking all the above into account and combining it with sell signals generated by the indicators, we think that further deterioration is more likely than not and opening short positions is justified from the risk/reward perspective.
How low could the exchange rate go in the coming days? In our opinion, the first downside target would be around 1.3028-1.3030, where the last week’s lows are. If this area is broken, we’ll see further deterioration and a drop to the 61.8% Fibonacci retracement based on the Aug-Sep upward move (around 1.2949) or even a decline to the support zone created by the 76.4% and 78.6% Fibonacci retracements (around (1.2865-1.2876).
Very short-term outlook: bearish
Short-term outlook: bearish
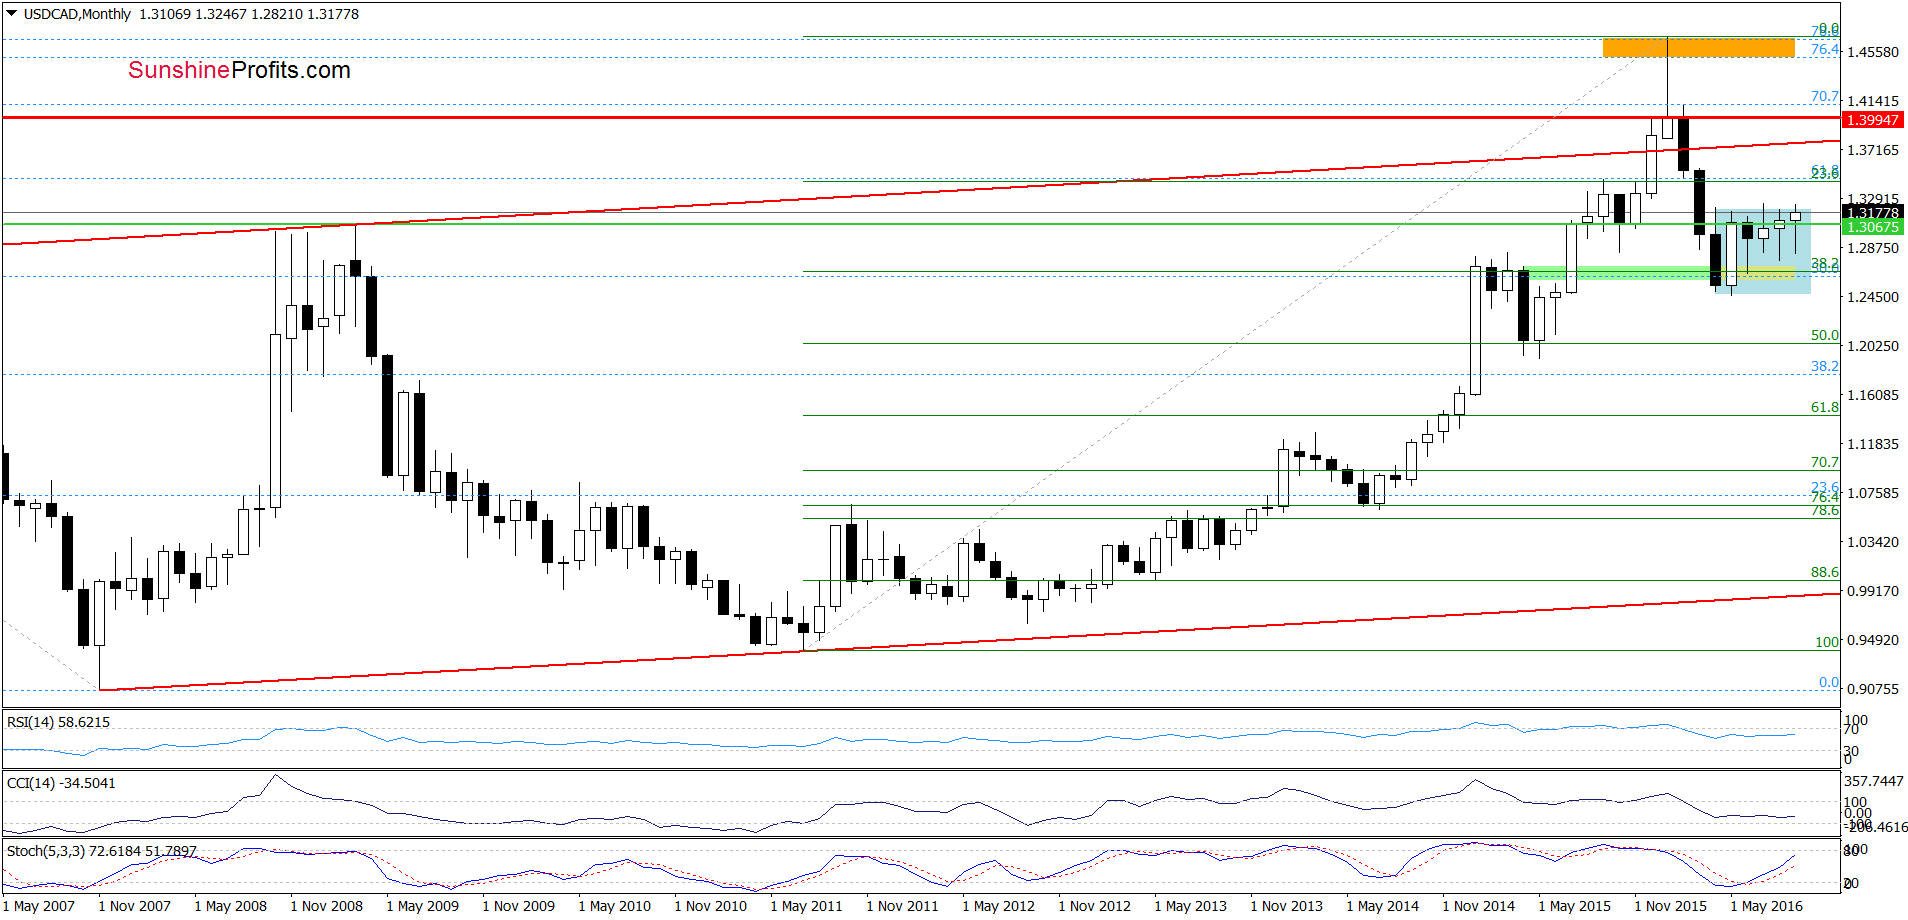
MT outlook: mixed
LT outlook: mixed with bearish bias
Trading position (short-term; our opinion): Short positions (with a stop-loss order at 1.3346 and initial downside target at 1.2876) are justified from the risk/reward perspective. We will keep you informed should anything change, or should we see a confirmation/invalidation of the above.
AUD/USD
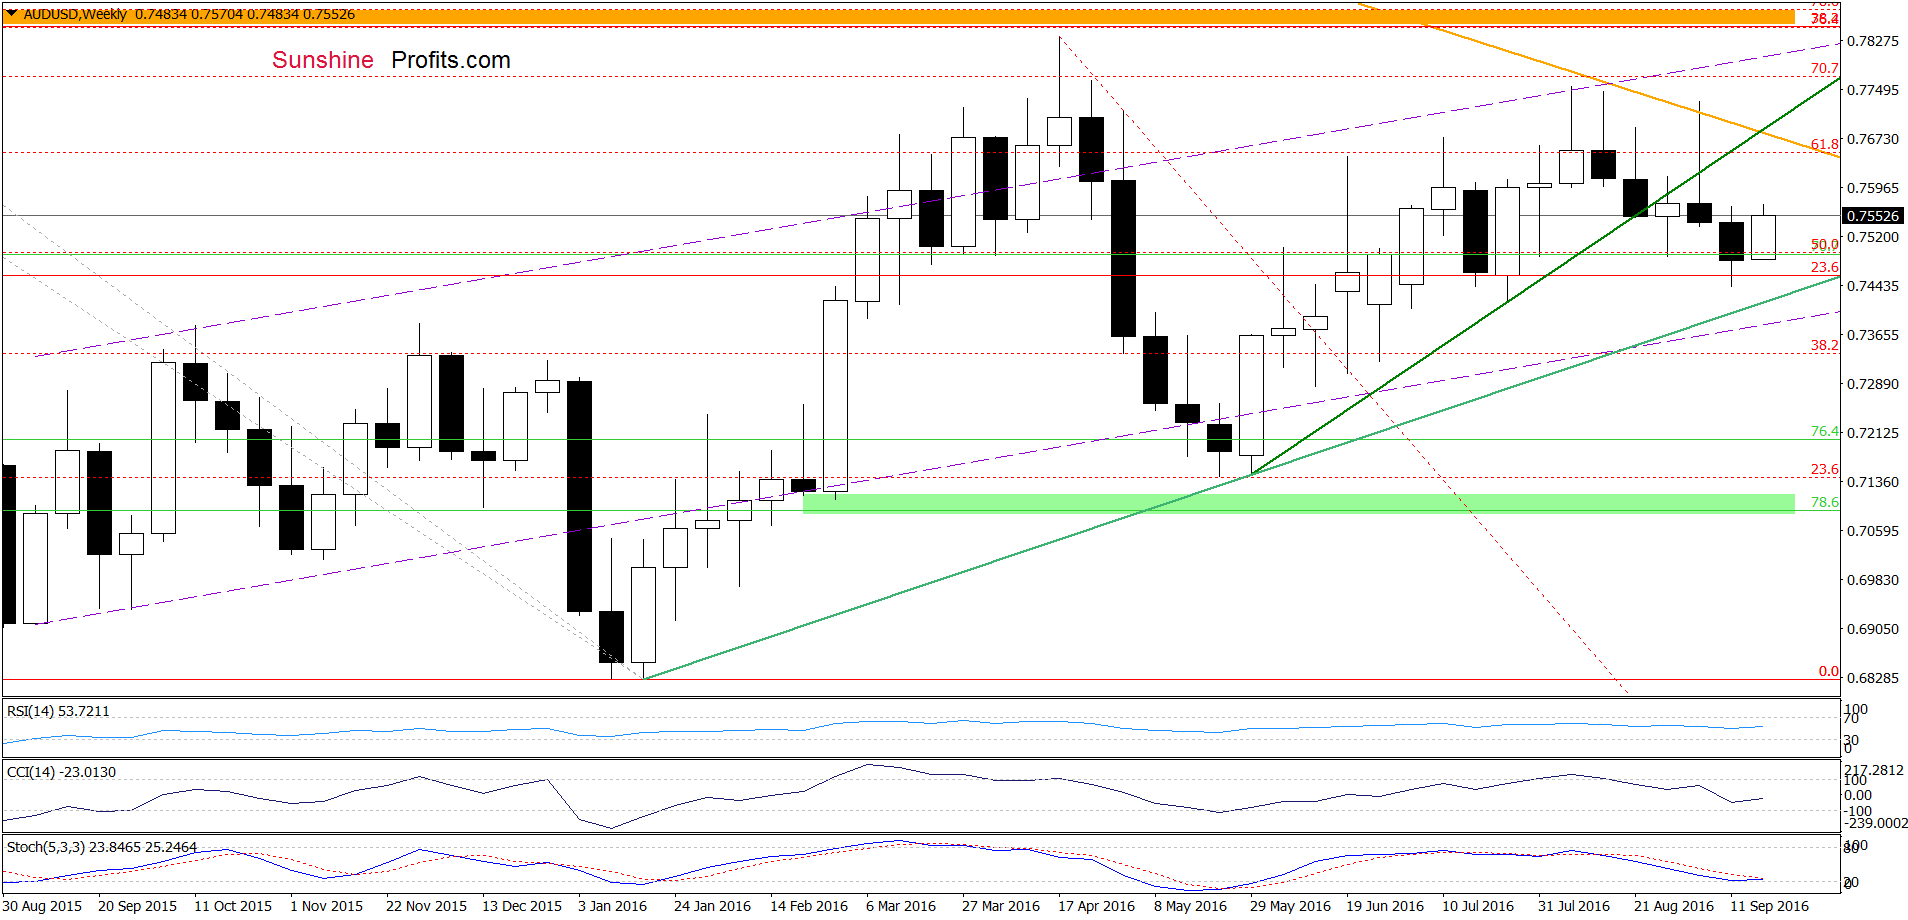
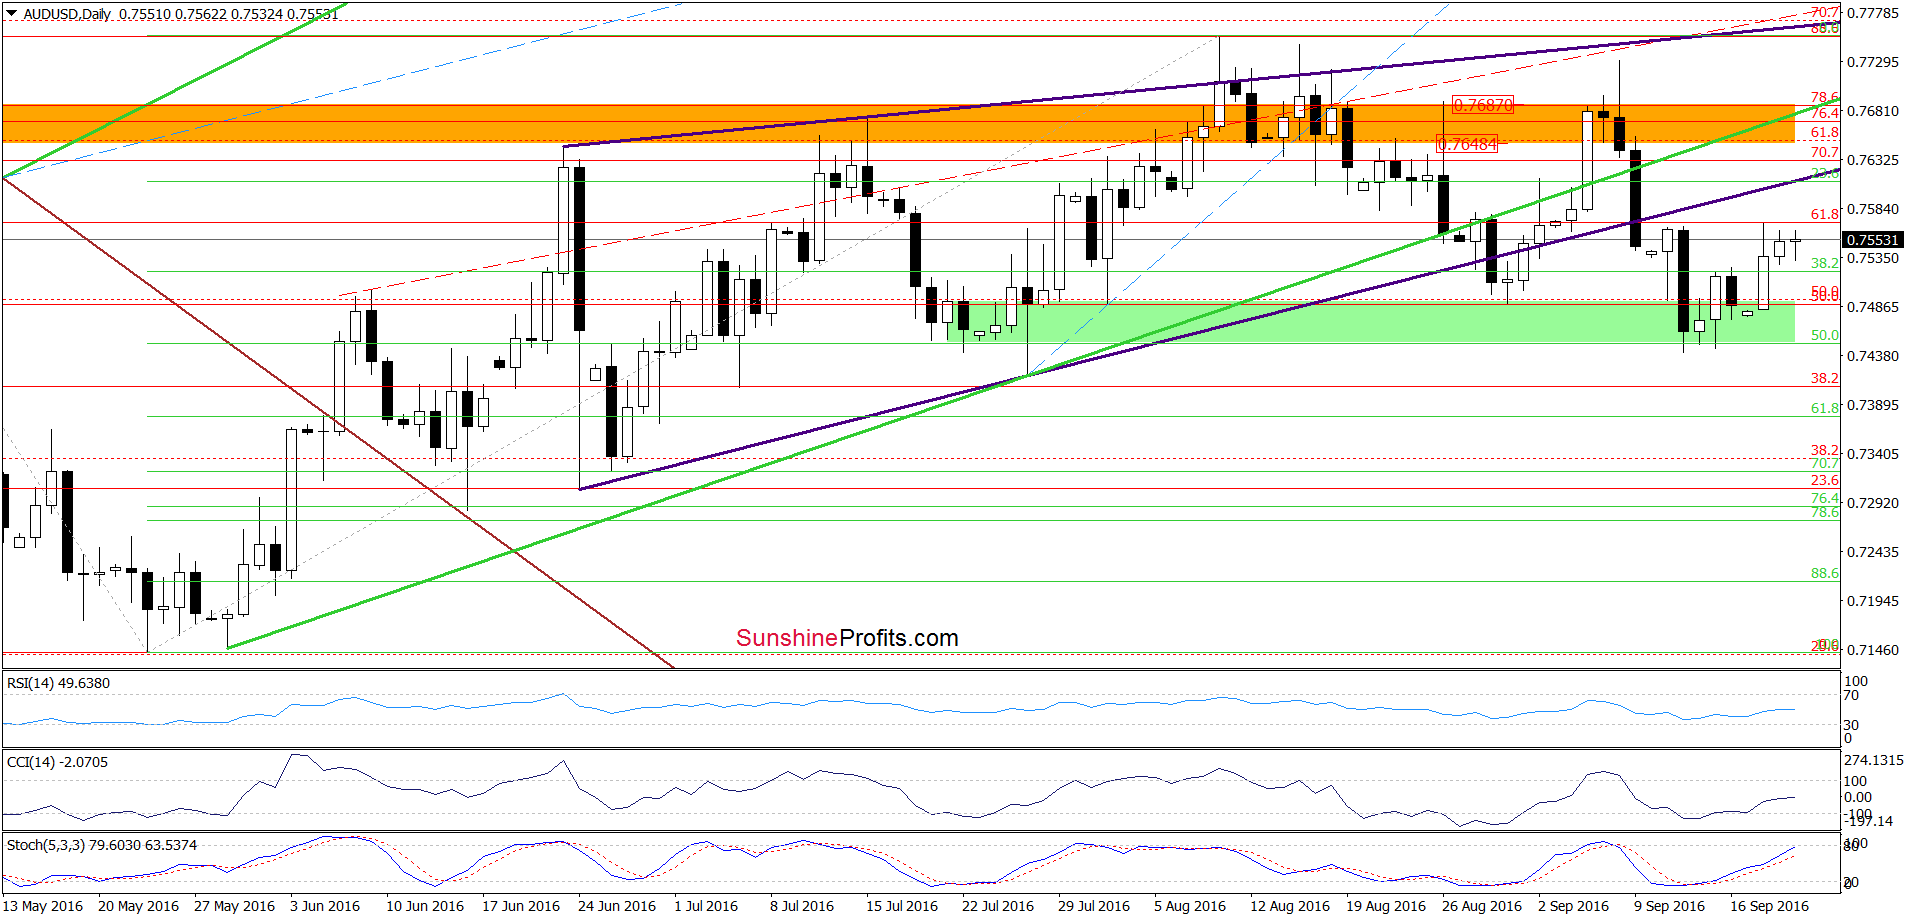
On the daily chart, we see that the situation in the very short term hasn’t changed much as AUD/USD remains at yesterday’s levels, which means that our previous commentary on this currency pair is up-to-date:
(…) What’s next? Taking into account buy signals generated by the indicators, we think that the exchange rate will extend gains in the coming days and test the previously-broken lower border of the purple rising wedge or even the orange resistance zone, which is currency intersected by the medium-term green line.
Very short-term outlook: bulish
Short-term outlook: mixed
MT outlook: mixed
LT outlook: mixed
Trading position (short-term; our opinion): No positions are justified from the risk/reward perspective. We will keep you informed should anything change, or should we see a confirmation/invalidation of the above.
Thank you.
Nadia Simmons
Forex & Oil Trading Strategist
Przemyslaw Radomski, CFA
Founder, Editor-in-chief, Gold & Silver Fund Manager
Gold & Silver Trading Alerts
Forex Trading Alerts
Oil Investment Updates
Oil Trading Alerts

