

Although the USD Index moved lower against the basket of major currency pairs ahead of the Federal Reserve and Bank of Japan’s upcoming policy meetings, the greenback remains near mid- Aug and Sep highs. Will we see a breakout above these levels? Will the Fed’s outcome be supporting or damaging to the U.S. currency? Before we know answers to these questions, let’s check what the current picture of our six currency pairs is.
In our opinion the following forex trading positions are justified - summary:
EUR/USD
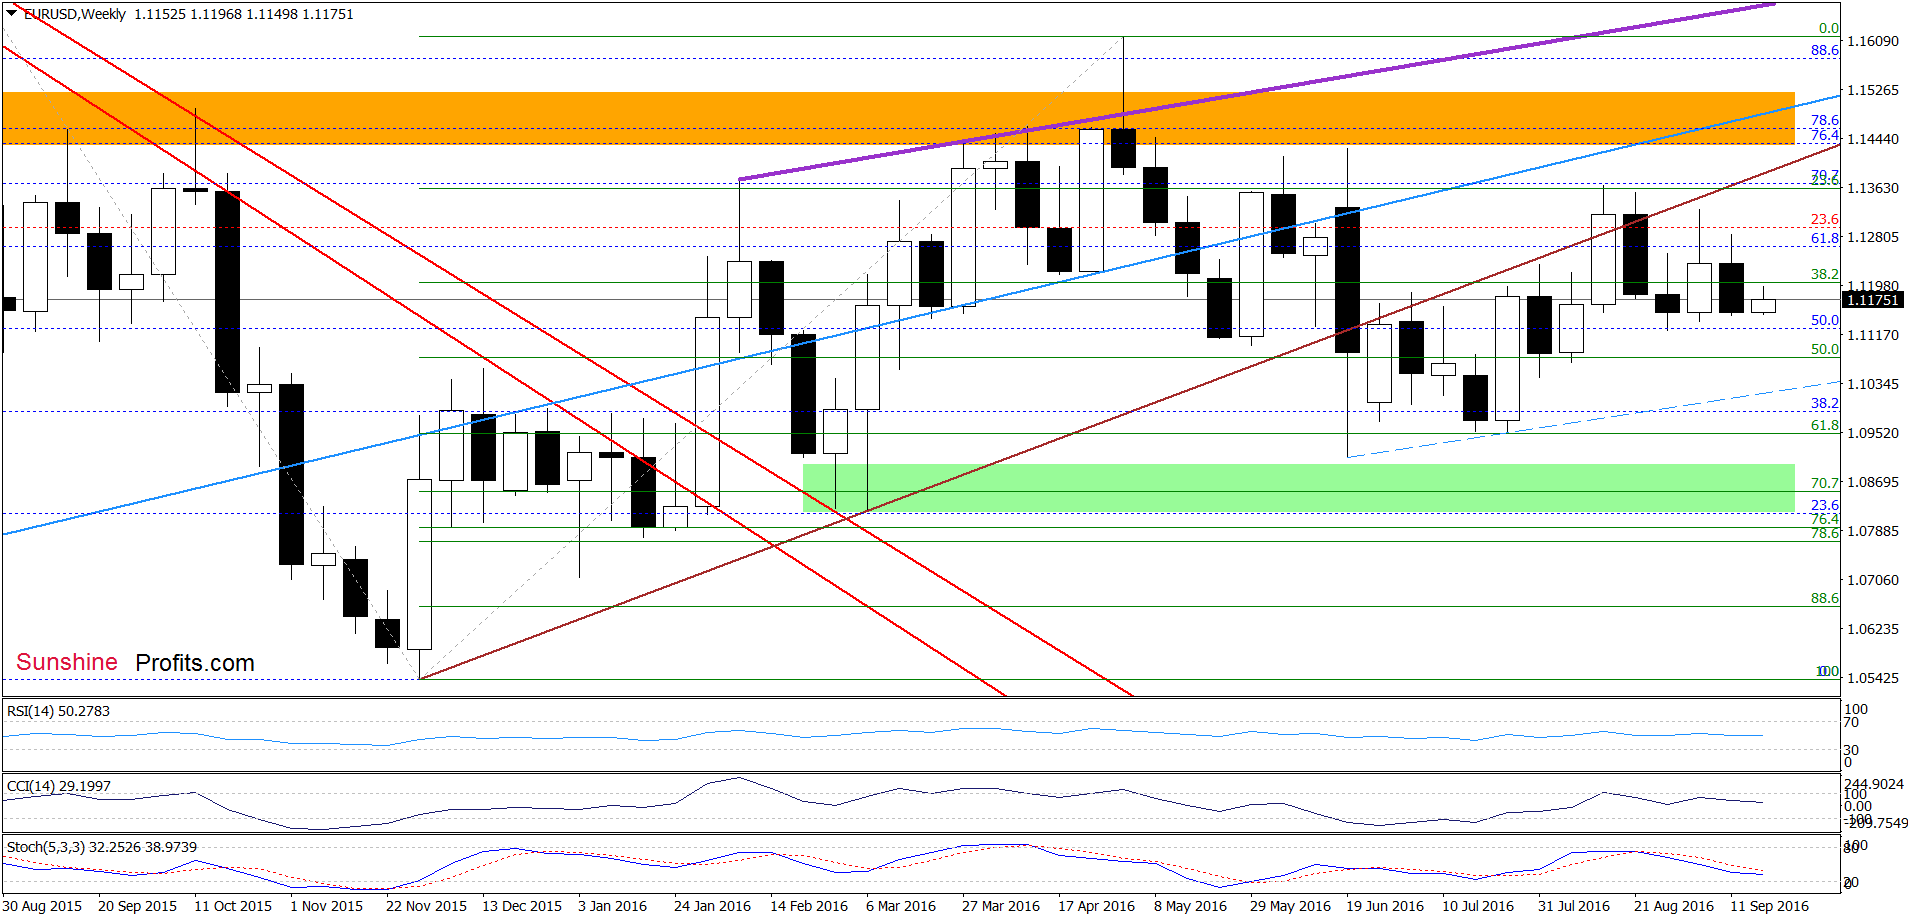
Looking at the weekly chart, we see that the situation in the medium-term hasn’t changed much as EUR/USD is trading between last week’s high and low.
Will the very short-term chart give us more clues about future moves? Let’s check.
Last Wednesday, we wrote the following:
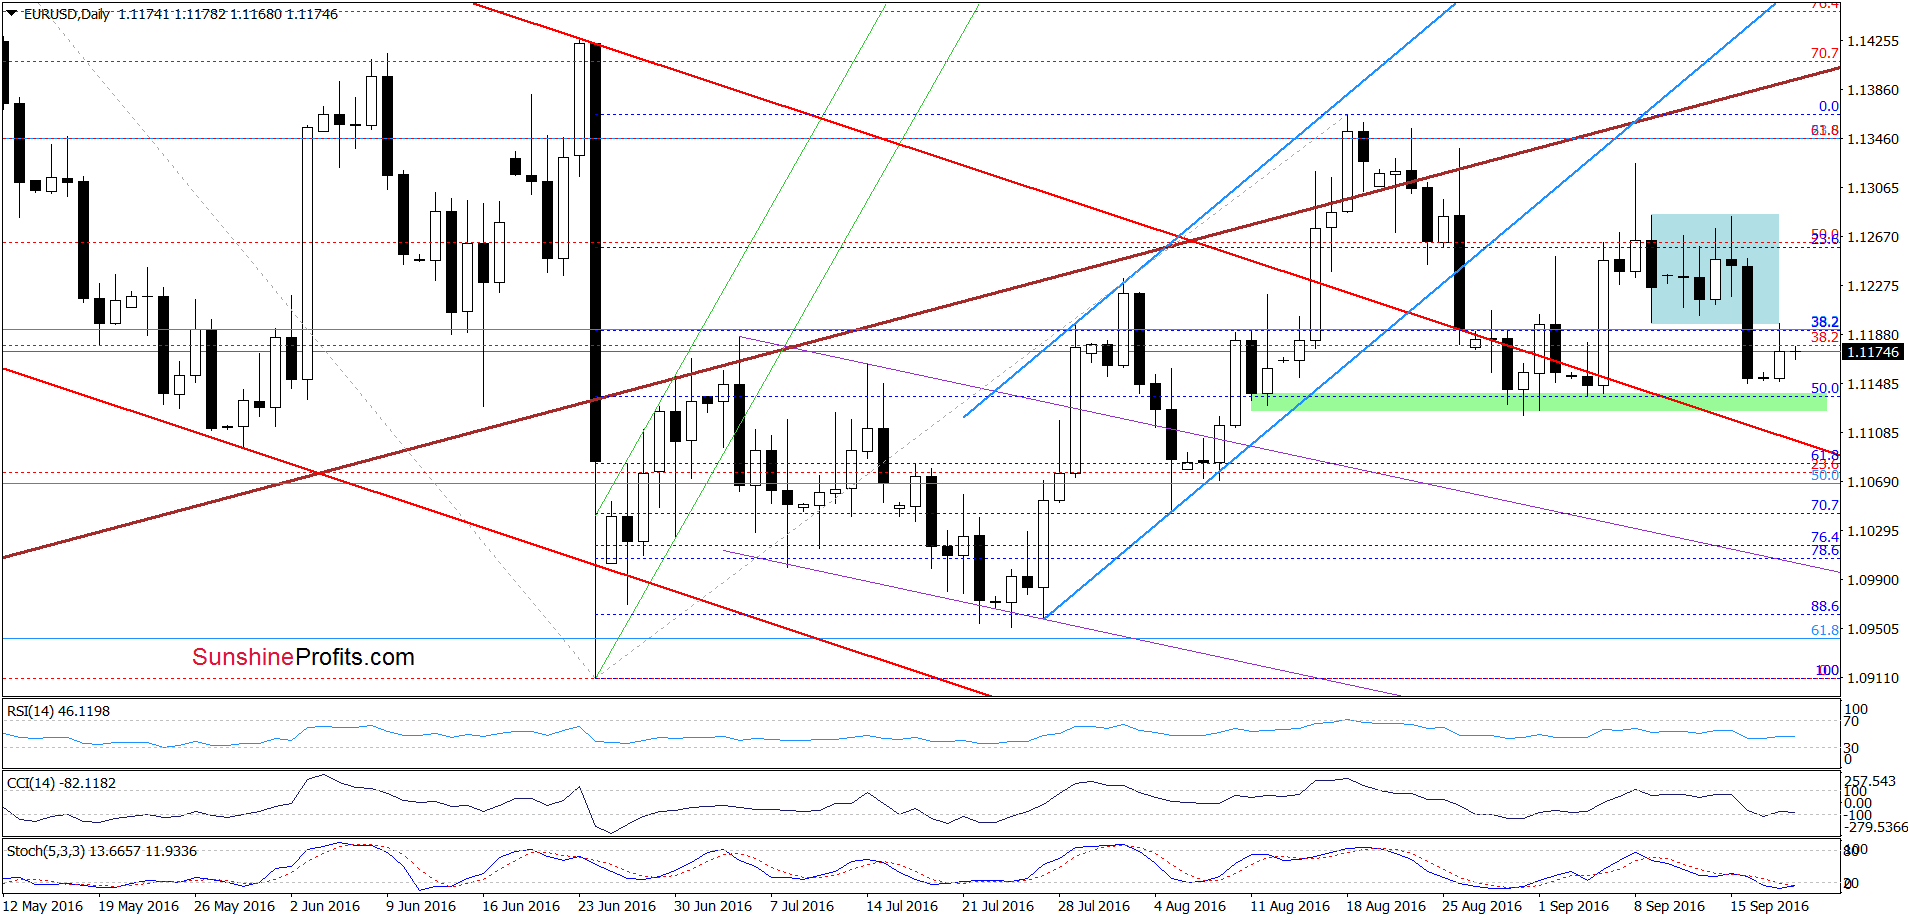
(…) in our opinion, as long as there won’t be breakout above the upper line of the formation (or a breakdown under the Sep 9 low of 1.1197) another bigger move is not likely to be seen. Nevertheless, (…) sell signals generated by the indicators remain in play, supporting currency bears, which suggests that if the pair extends declines, we’ll likely see a re-test of the green support zone and the upper border of the red declining trend channel in the following days.
From today’s point of view, we see that the situation developed in line with the above scenario and EUR/USD dropped under the lower border of the consolidation. With this sharp decline the exchange rate approached the green support zone, which encouraged currency bulls to act. As a result, the pair climbed to the previously-broken lower line of the formation, which looks like a verification of the breakdown. If this is the case, we’ll likely see another downswing and a re-test of the green zone (or even the upper border of the red declining trend channel). Nevertheless, the current position of the indicators (the CCI generated a buy signal, while the Stochastic Oscillator is very close to doing the same) suggests that the space for declines is limited and reversal in the coming day(s) is very likely.
Very short-term outlook: mixed
Short-term outlook: mixed
MT outlook: mixed
LT outlook: mixed
Trading position (short-term; our opinion): No positions are justified from the risk/reward perspective. We will keep you informed should anything change, or should we see a confirmation/invalidation of the above.
GBP/USD
Quoting our previous commentary on this currency pair:
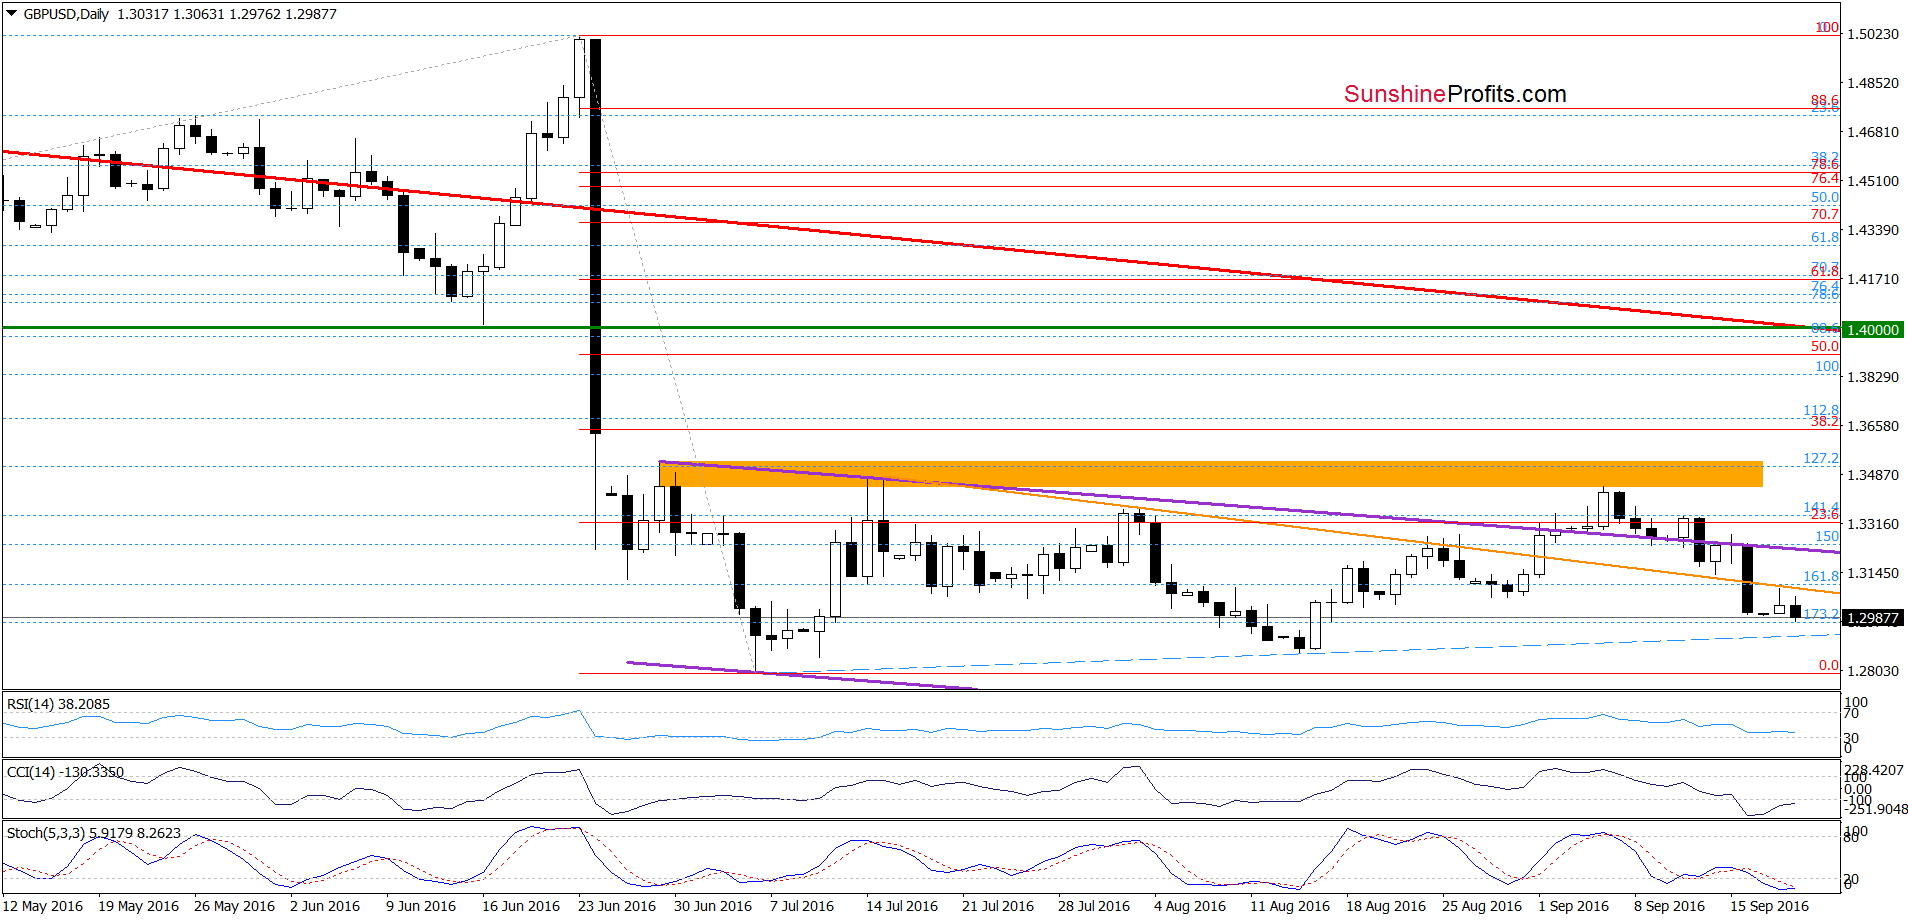
(…) In recent days currency bulls pushed the pair higher, but they didn’t manage to come back above the purple line. As a result, the exchange rate moved lower once again earlier today, which looks like a verification of the breakdown. If this is the case, it is a negative signal that suggests further deterioration and a drop to the orange support line or even to the late Aug lows around 1.30581.3079 in the coming days.
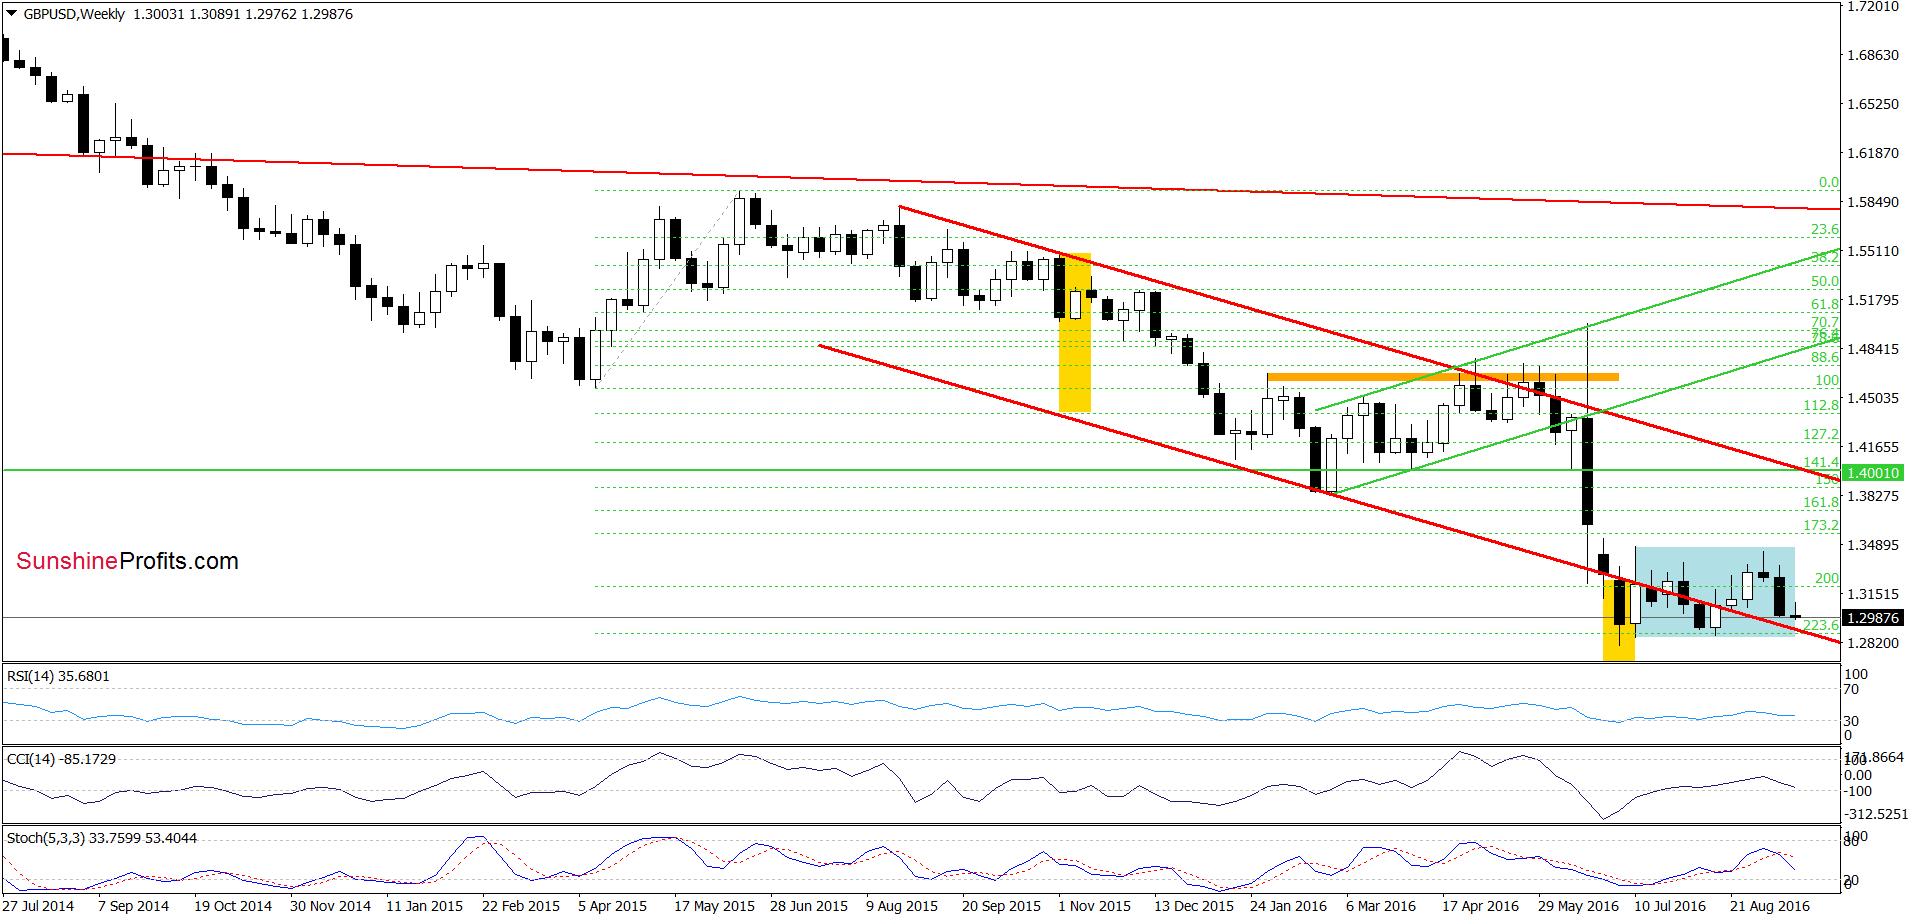
Looking at the daily chart, we see that currency bears not only took the exchange rate to our downside target, but also managed to push GBP/USD below it. Yesterday, the pair verified earlier breakdown below the orange line, which suggests further deterioration and a re-test of the Jul and Aug lows in the coming days.
Are there any factors that could stop declines? Firstly, the current position of the daily indicators (they are very close to generating buy signals). Secondly, and more importantly, the lower border of the red declining trend channel marked on the chart below.
Nevertheless, if currency bears manage to push the exchange rate below it and the lower border of the blue consolidation we’ll consider opening short positions.
Very short-term outlook: bearish
Short-term outlook: mixed
MT outlook: mixed
LT outlook: bearish
Trading position (short-term; our opinion): No positions are justified from the risk/reward perspective. We will keep you informed should anything change, or should we see a confirmation/invalidation of the above.
USD/JPY
On Thursday, we wrote:
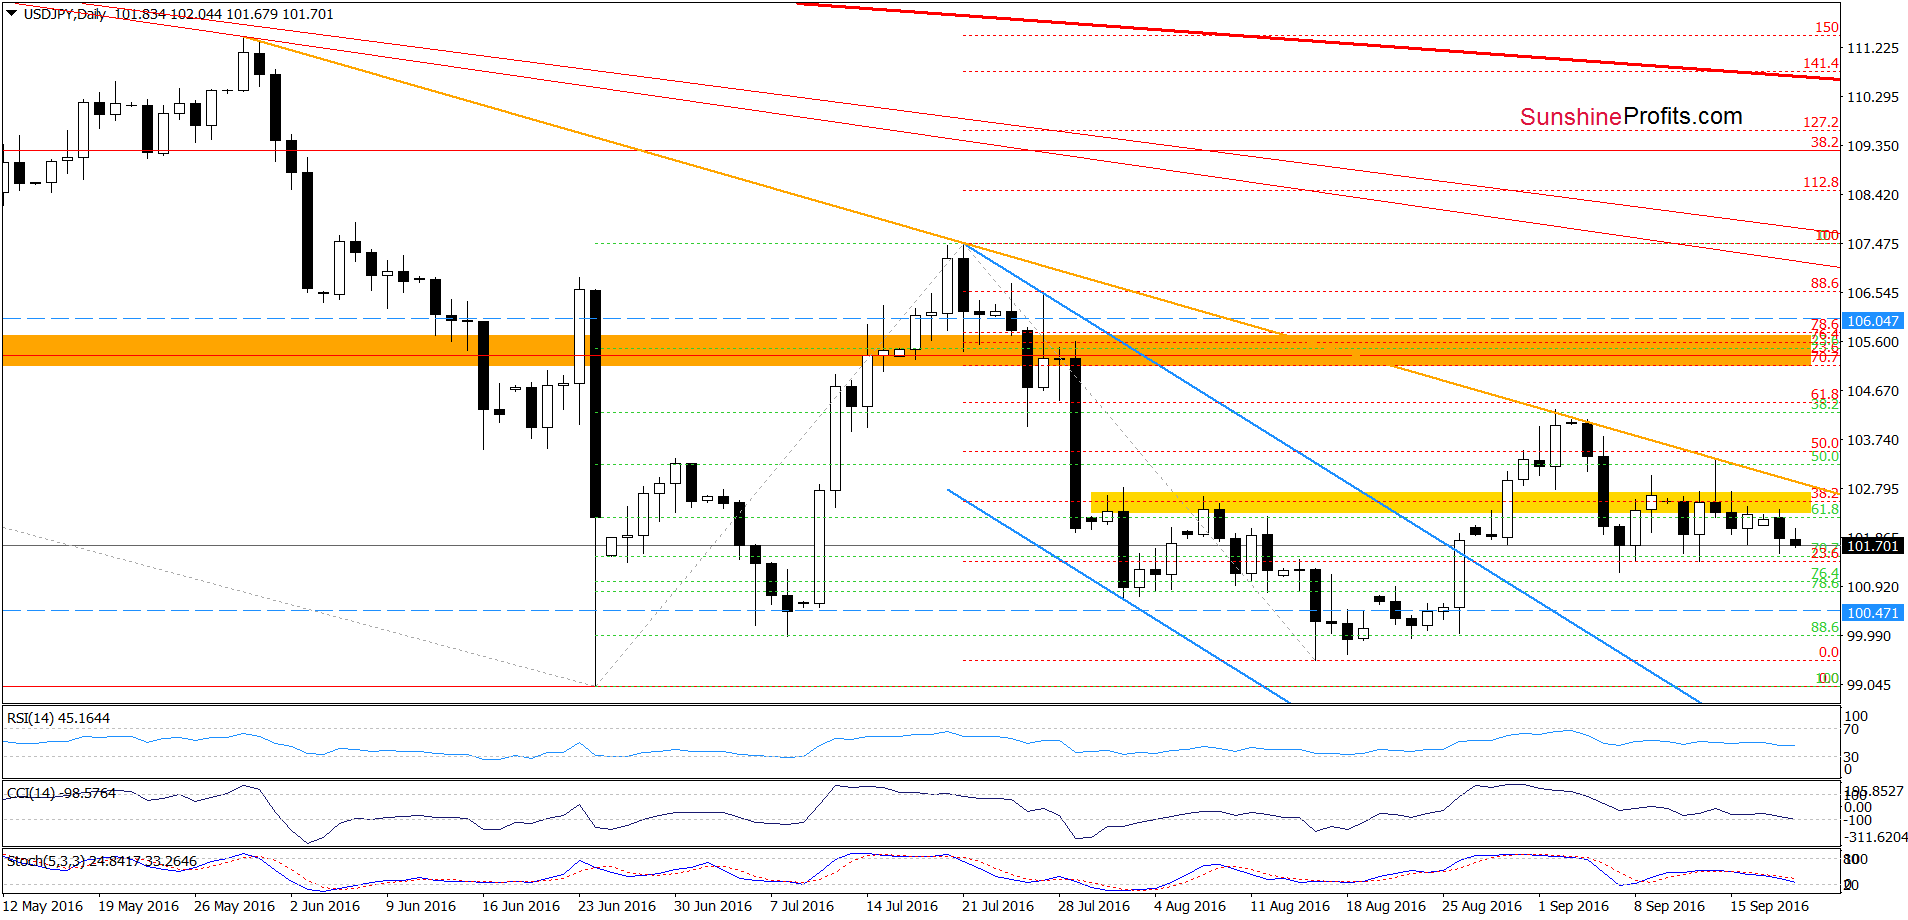
(…) the yellow resistance zone triggered a decline (…) Yesterday, the exchange rate moved above this area once again, but currency bulls didn’t manage to hold gained levels, which resulted in another invalidation of the breakout. Such price action doesn’t bode well for the exchange rate, suggesting lower values in the coming day(s) – especially if the Stochastic Oscillator generates a sell signal.
From today’s point of view, we see that currency bears pushed the exchange rate lower as we had expected. Additionally, yesterday, the pair verified earlier breakdown below the yellow zone, which in combination with sell signals generated by the indicators suggests a test of the Sep lows (or even the barrier of 100) in the coming day(s). Will we see further deterioration? In our opinion, not likely, because USD/JPY slipped to the blue support zone marked on the chart below.
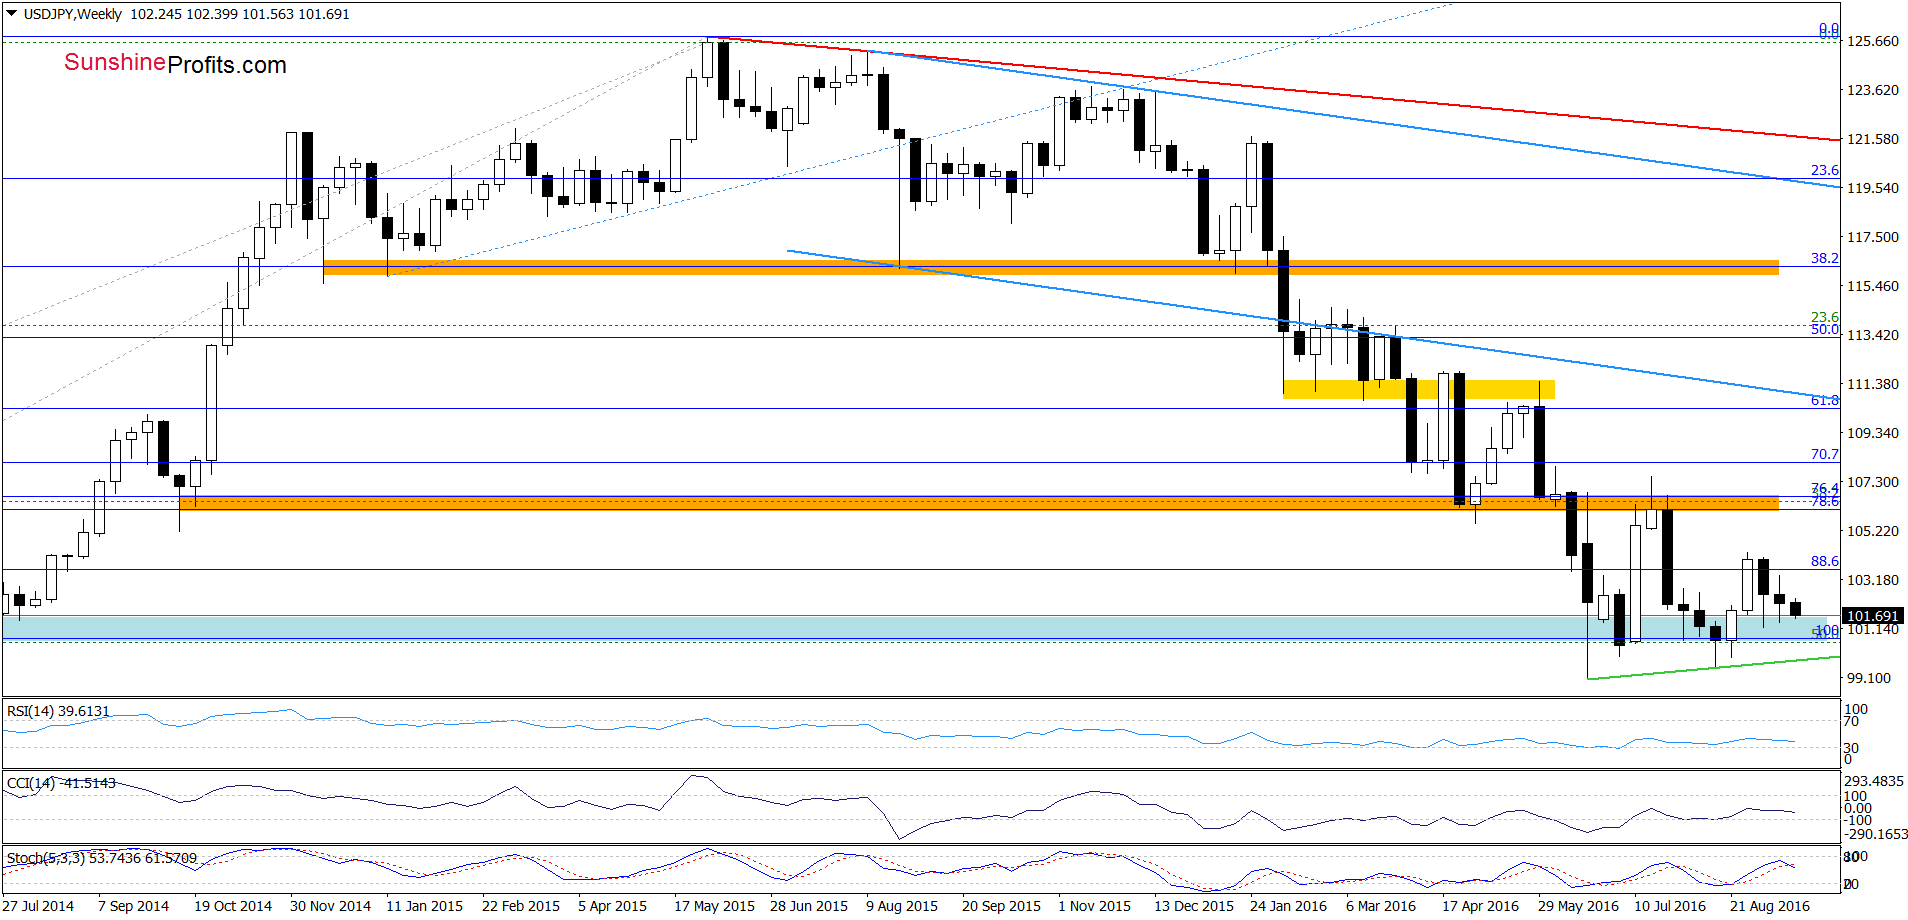
As you see, this area managed to stop currency bears in previous weeks, which suggests that we may see similar price action in near future – even if the exchange rate slips to the green support line based on the Jun and Aug lows first.
Very short-term outlook: mixed with bearish bias
Short-term outlook: mixed
MT outlook: mixed
LT outlook: mixed
Trading position (short-term; our opinion): No positions are justified from the risk/reward perspective. We will keep you informed should anything change, or should we see a confirmation/invalidation of the above.
USD/CAD
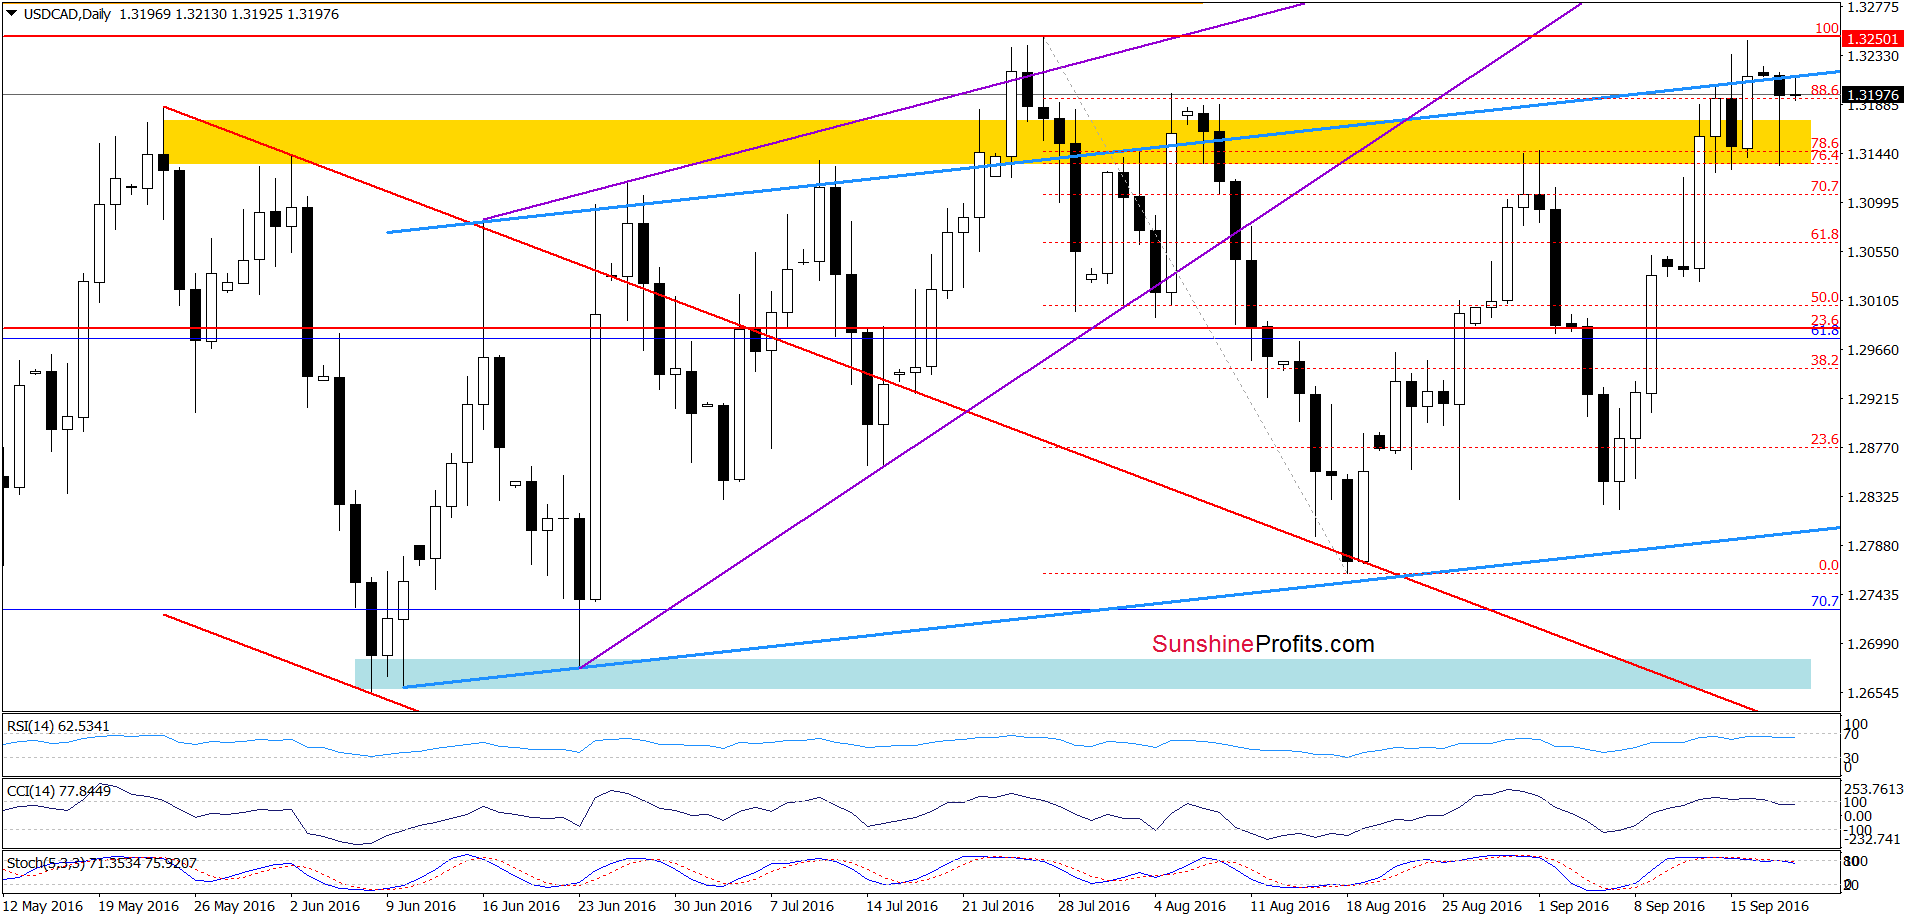
Looking at the daily chart, we see that USD/CAD declined and invalidated earlier breakout above the upper border of the blue rising trend channel yesterday. Although the pair rebounded after a drop to the yellow zone (which serves now as support), erasing most of earlier losses, we think that as long as there won’t be a daily closure above the blue resistance line all upswings will be nothing more than verification of yesterday’s breakdown. Additionally, the current position of the indicators suggests that the space for gains is limited and lower values of the exchange rate in the coming week are very likely (even if currency bulls re-test the recent highs). If this is the case and the pair moves lower from current levels, the initial downside target would be around 1.3028-1.3030, where this week’s lows are.
Finishing today’s commentary on this currency pair we would also like to draw your attention to the long-term picture below.
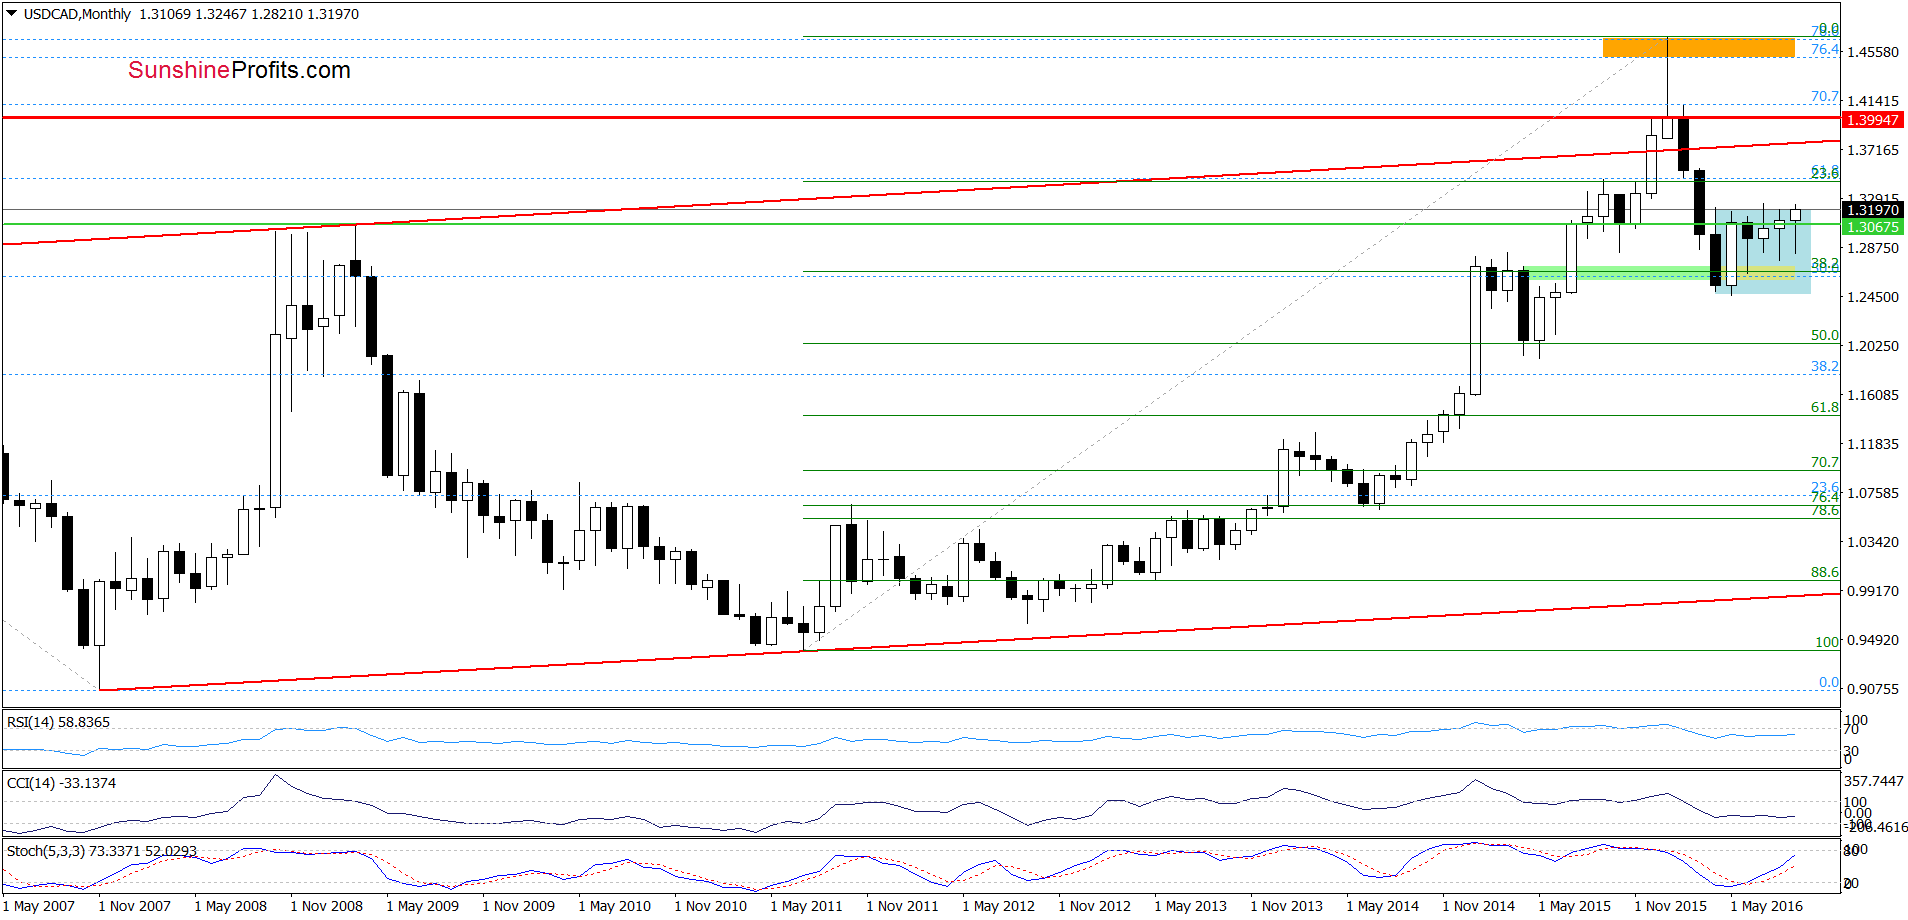
From the monthly perspective, we see that USD/CAD is trading in the blue consolidation and currently increased to the upper line of the formation. As you see, this area was strong enough to stop bulls in the previous months, which suggests that history will likely repeat itself once again and we’ll see a reversal and decline in the coming week.
Very short-term outlook: mixed with bearish bias
Short-term outlook: mixed with bearish bias
MT outlook: mixed
LT outlook: mixed with bearish bias
Trading position (short-term; our opinion): No positions are justified from the risk/reward perspective. Nevertheless, if we see another daily closure under the upper line of the blue rising trend channel (seen on the daily chart), we’ll consider opening short positions. We will keep you informed should anything change, or should we see a confirmation/invalidation of the above.
USD/CHF
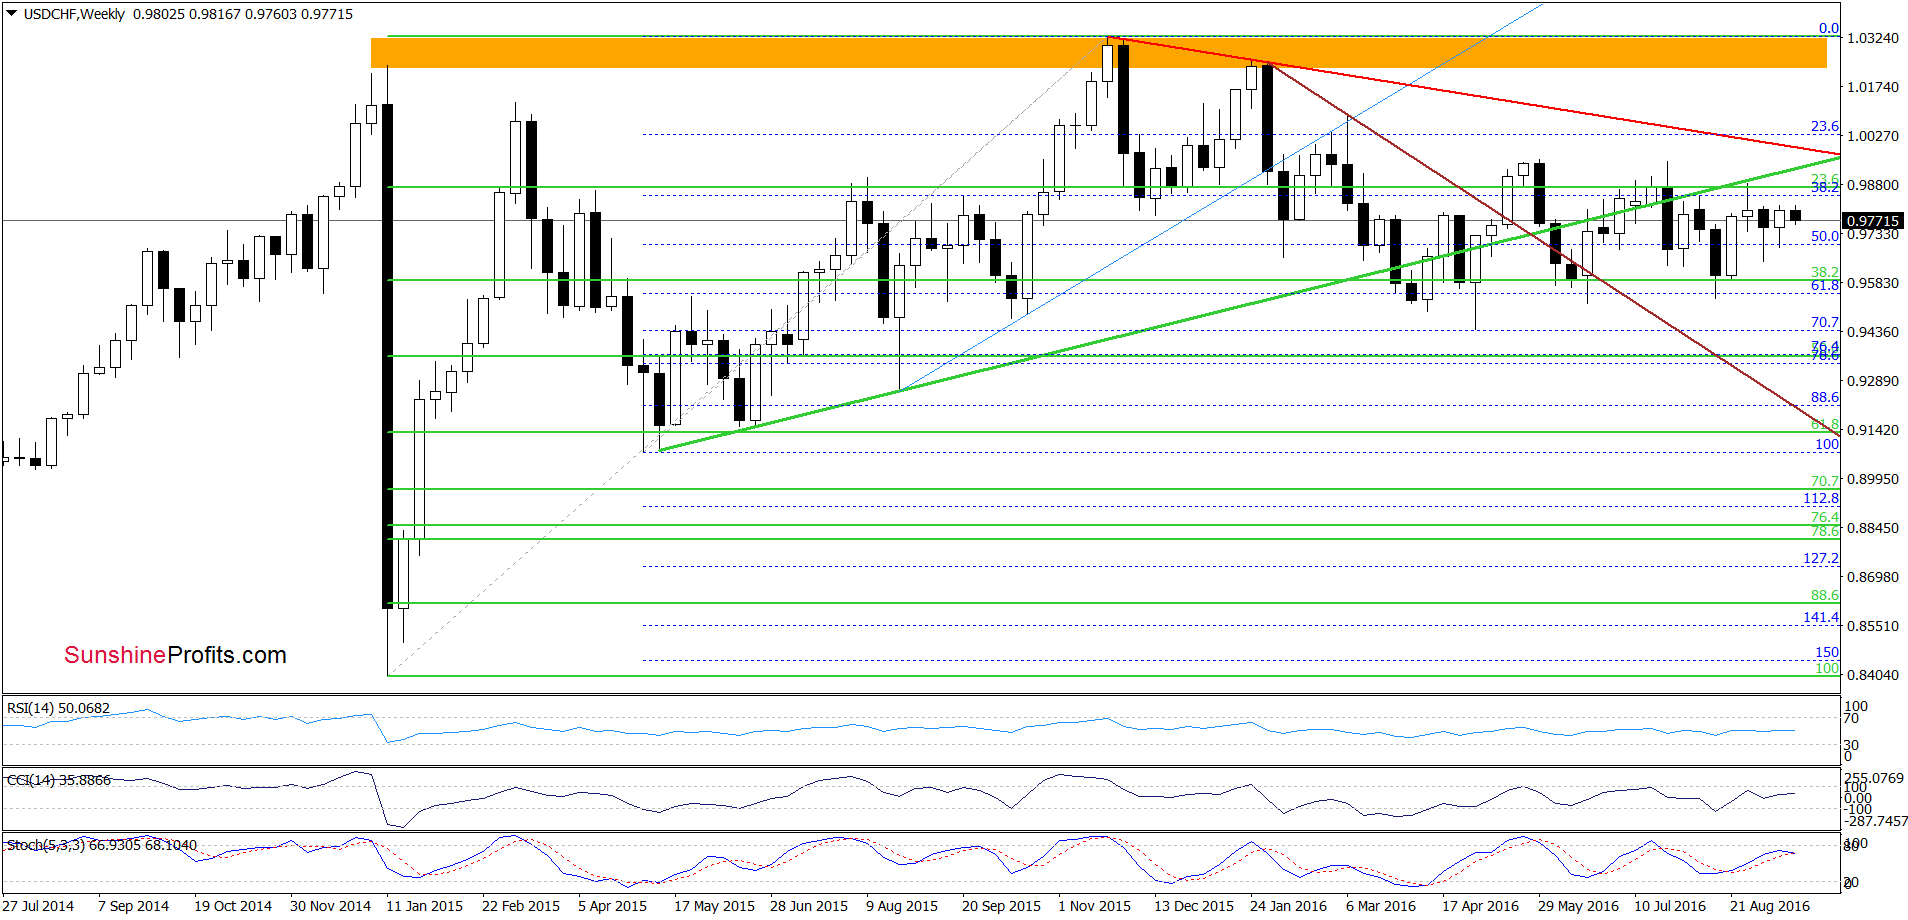
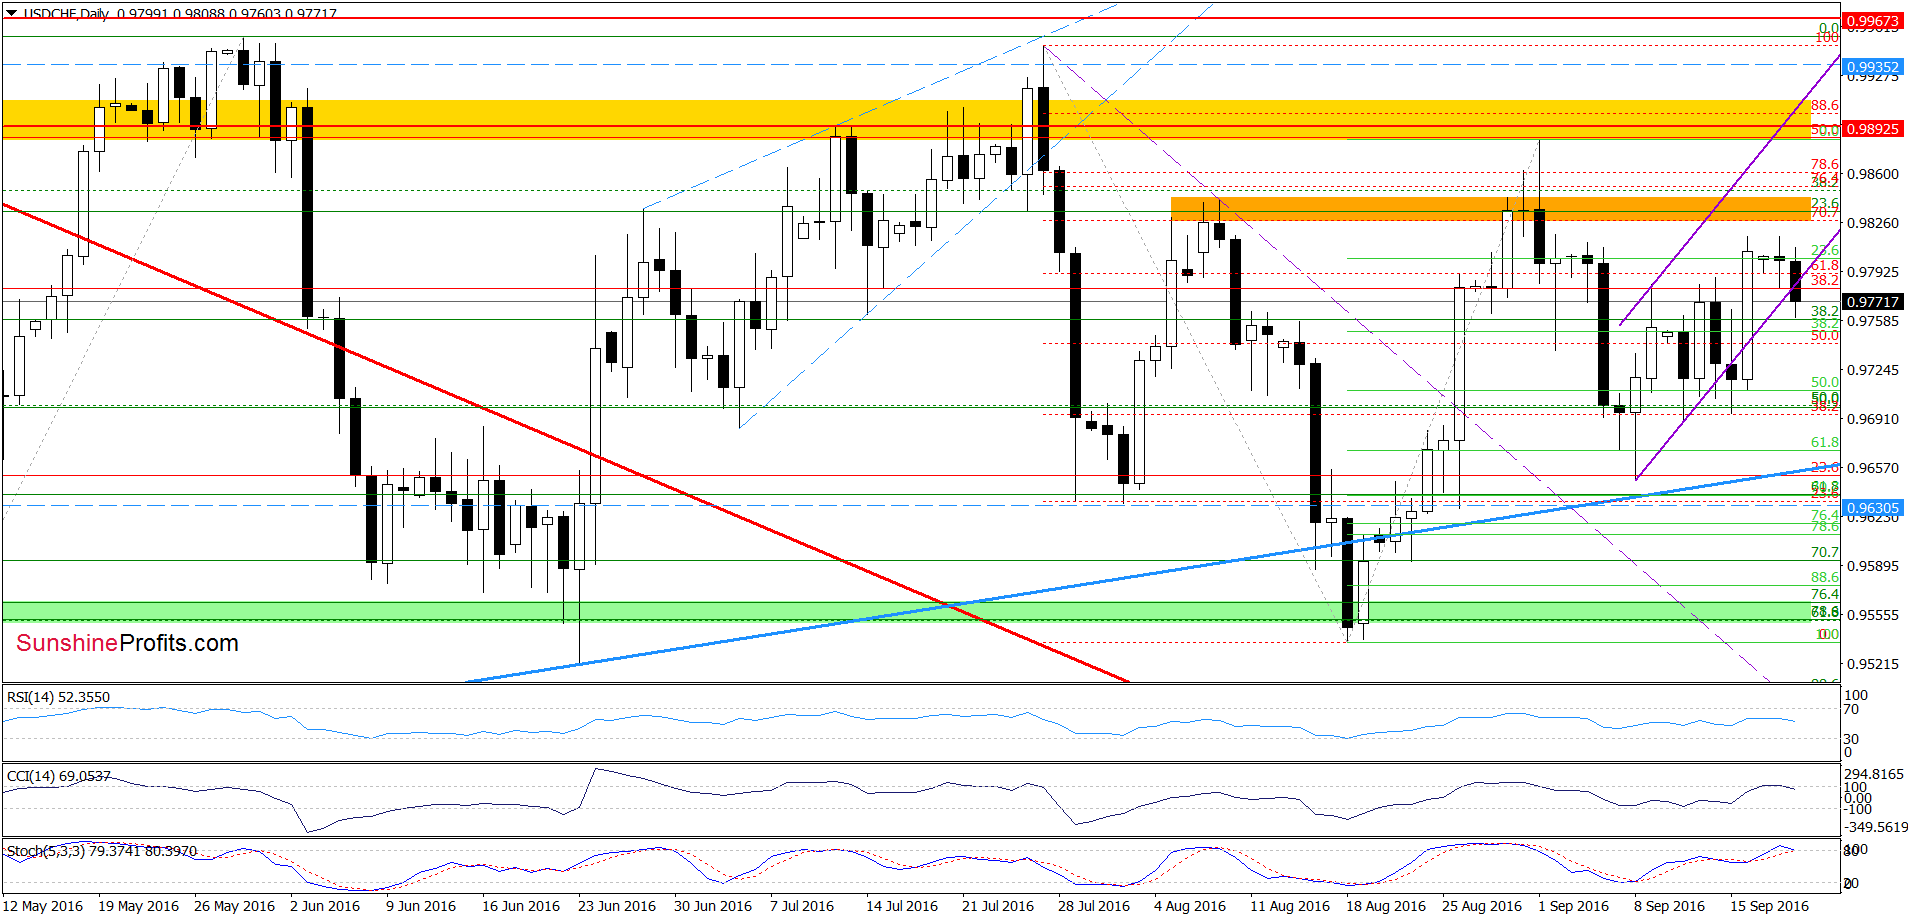
The first thing that catches the eye on the daily chart is breakdown under the lower border of the purple rising trend channel. Although this is a bearish signal that suggests further deterioration we should be careful, because we saw similar price action in the previous week. Back then, currency bulls invalidated the breakdown very quickly, which resulted in a sharp upswing. Therefore, in our opinion, further deterioration will be more likely and reliable if the exchange rate not only closes today’s session under the purple line, but also the CCI and Stochastic Oscillator generate sell signals, increasing the probability of declines. If we see such price action, USD/CHF may move not only to the last week’s lows, but even lower to around 0.9656, where the medium-term blue support line currently is.
Very short-term outlook: mixed with bearish bias
Short-term outlook: mixed
MT outlook: mixed
LT outlook: mixed
Trading position (short-term; our opinion): No positions are justified from the risk/reward perspective, however, if we see more bearish developments, we’ll consider opening sort positions. We will keep you informed should anything change, or should we see a confirmation/invalidation of the above.
AUD/USD
Quoting our Thursday s alert:
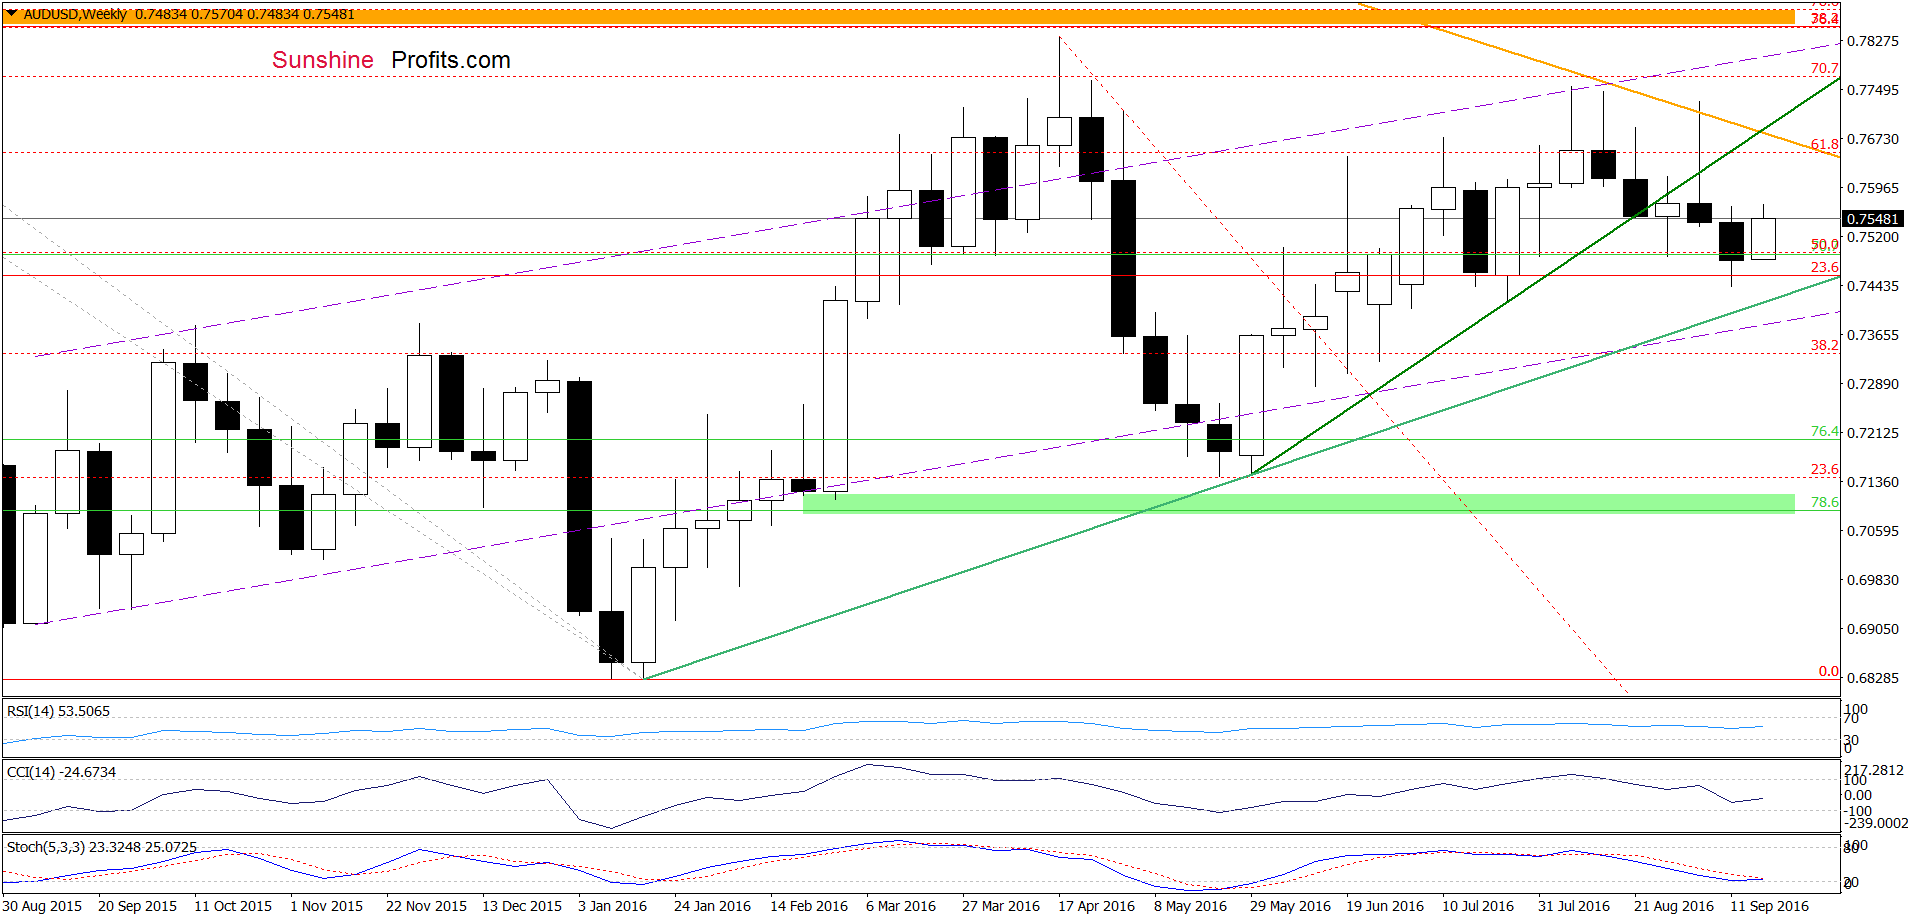
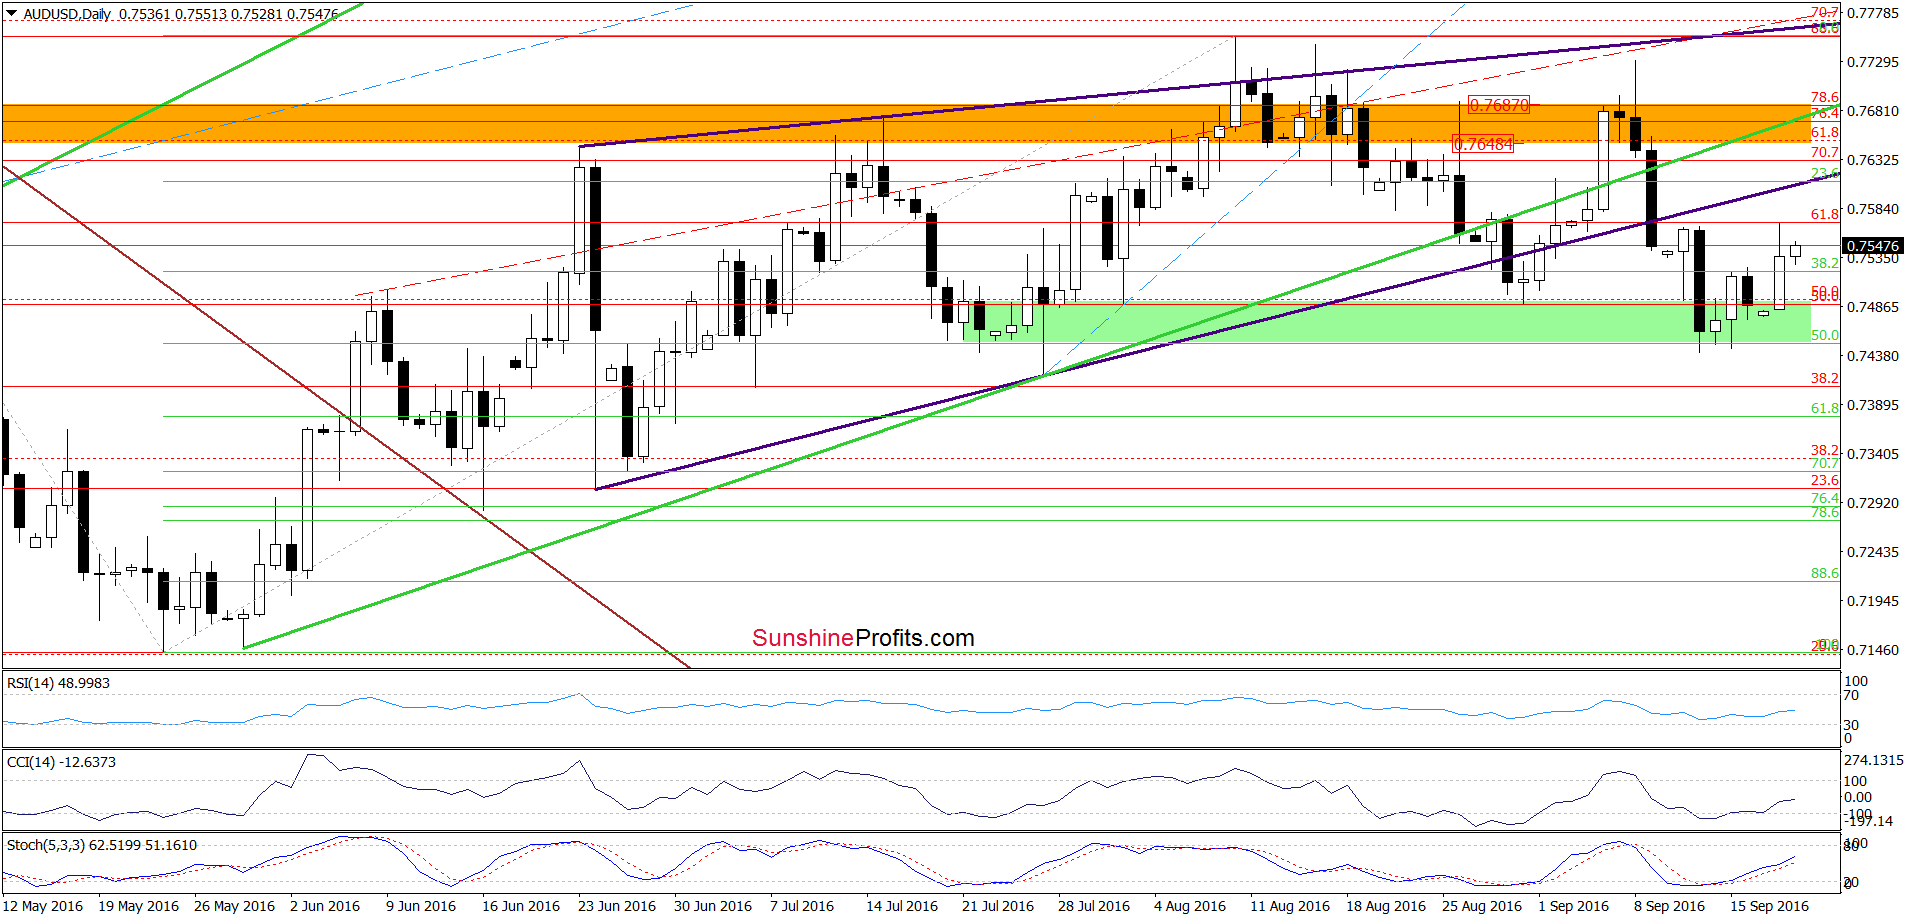
(…) AUD/USD slipped to our downside target. Yesterday, and also earlier today, this area managed to stop declines, which in combination with the current position of the indicators (the CCI and the Stochastic Oscillator is oversold and very close to generating buy signals) suggests that the space for declines may be limited and reversal is just around the corner.
From today’s perspective, we see that the situation developed in tune with our assumptions ad AUD/USD moved higher in recent days. What’s next? Taking into account buy signals generated by the indicators, we think that the exchange rate will extend gains in the coming days and test the previously-broken lower border of the purple rising wedge or even the orange resistance zone, which is currency intersected by the medium-term green line.
Very short-term outlook: bullish
Short-term outlook: mixed
MT outlook: mixed
LT outlook: mixed
Trading position (short-term; our opinion): No positions are justified from the risk/reward perspective. We will keep you informed should anything change, or should we see a confirmation/invalidation of the above.
Thank you.
Nadia Simmons
Forex & Oil Trading Strategist
Przemyslaw Radomski, CFA
Founder, Editor-in-chief, Gold & Silver Fund Manager
Gold & Silver Trading Alerts
Forex Trading Alerts
Oil Investment Updates
Oil Trading Alerts

