

Yesterday, the U.S. dollar climbed to its highest level since late Jul against its Canadian counterpart as declining price of crude oil continued to weigh on the commodity-linked Canadian currency. Thanks to these circumstances, USD/CAD broke above important resistances, but then gave up the gains and reversed. Did this price action change anything in the current picture of the exchange rate?
In our opinion the following forex trading positions are justified - summary:
EUR/USD
The situation in the medium-term hasn’t changed much as EUR/USD is trading between last week’s high and low. Today, we’ll focus on the daily chart.
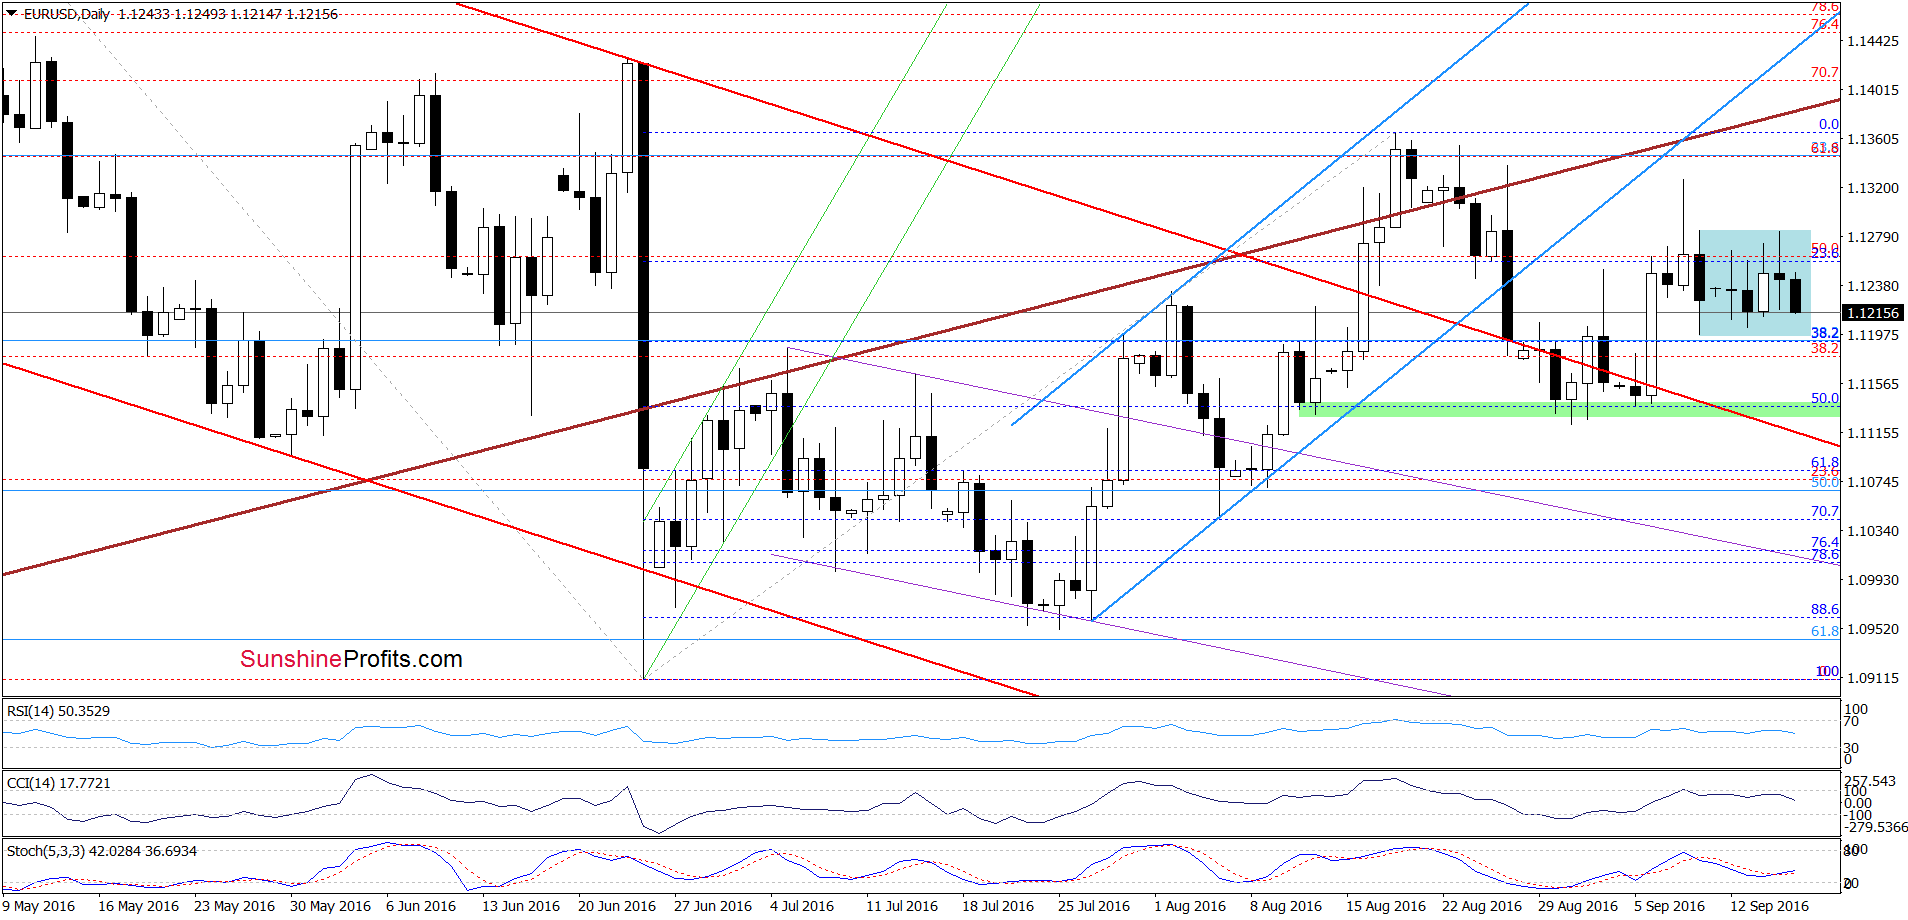
Looking at the daily chart, we see that although EUR/USD increased yesterday, the upper border of the blue consolidation stopped currency bulls, triggering a pullback. Earlier today, the exchange rate extended losses, however, such price action doesn’t change anything, because the pair remains in the blue consolidation. Therefore, our Wednesday’s commentary is up-to-date:
(…) in our opinion, as long as there won’t be breakout above the upper line of the formation (or a breakdown under the Sep 9 low of 1.1197) another bigger move is not likely to be seen. Nevertheless, we think it is worth considering both pro-growth and bearish scenarios. If currency bulls push EUR/USD above 1.1284, we’ll see further improvement and a test of the medium-term brown resistance line in the following days. On the other hand, sell signals generated by the indicators remain in play, supporting currency bears, which suggests that if the pair extends declines, we’ll likely see a re-test of the green support zone and the upper border of the red declining trend channel in the following days.
Very short-term outlook: mixed
Short-term outlook: mixed
MT outlook: mixed
LT outlook: mixed
Trading position (short-term; our opinion): No positions are justified from the risk/reward perspective. We will keep you informed should anything change, or should we see a confirmation/invalidation of the above.
GBP/USD
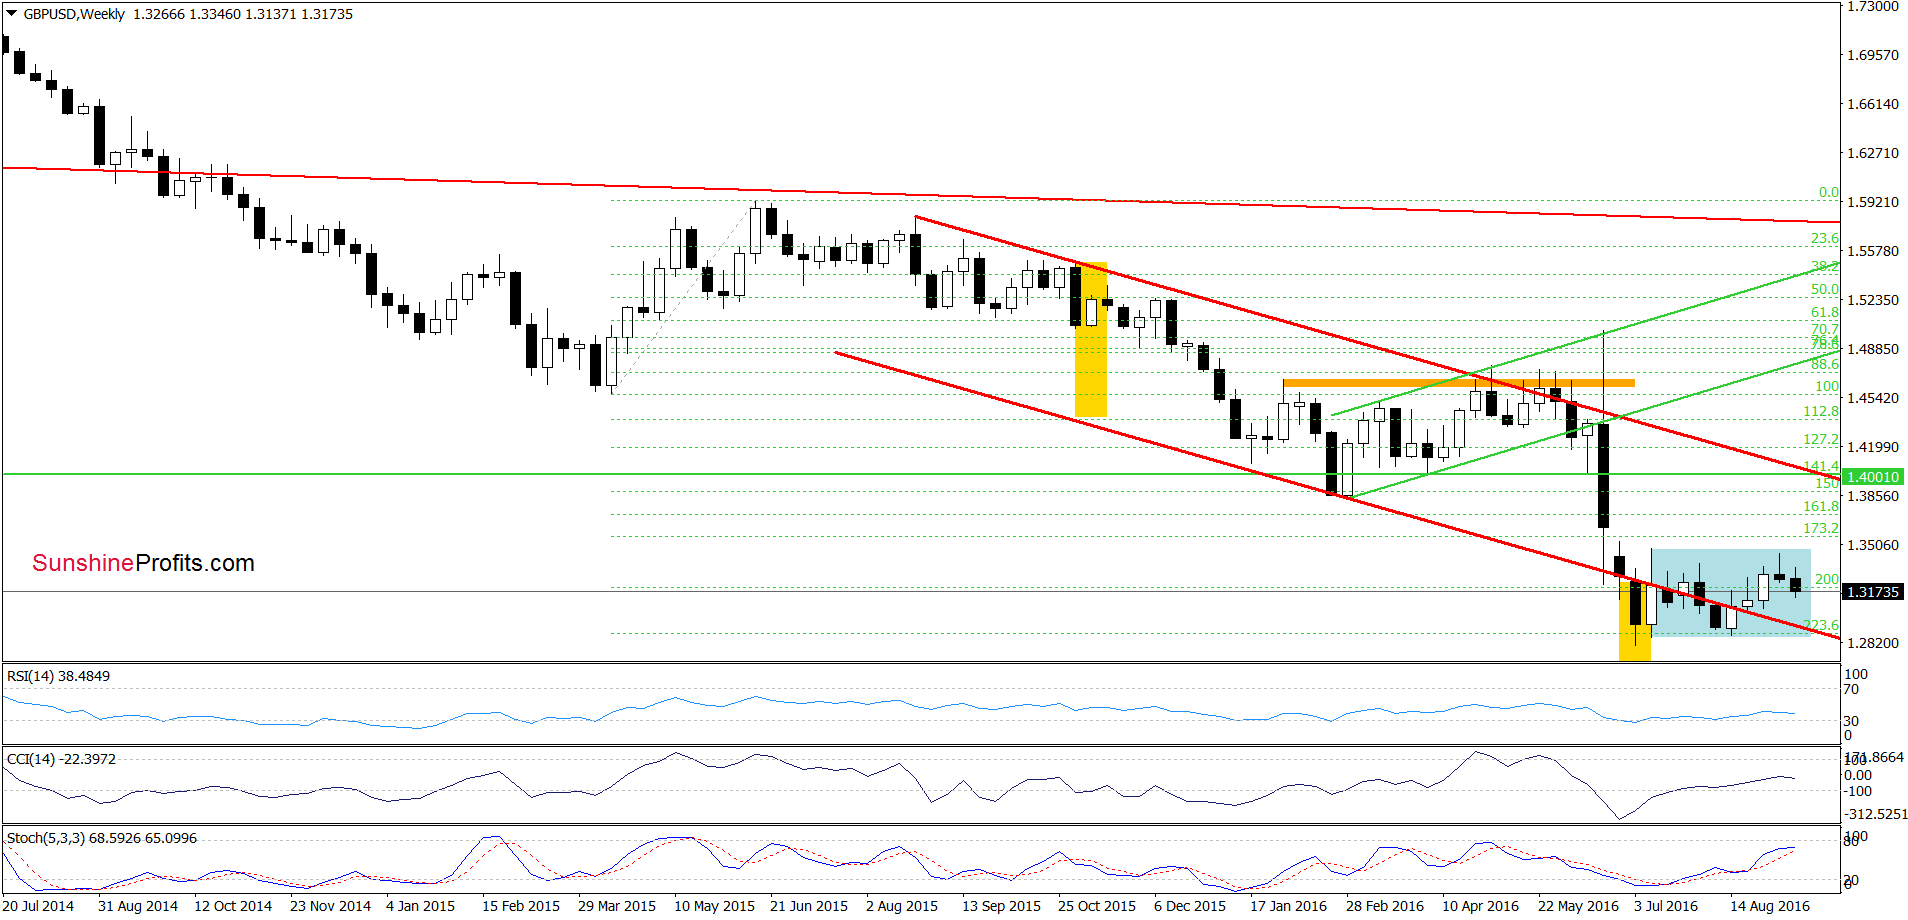
From the medium-term perspective, we see that although GBP/USD moved little lower this week, the overall situation hasn’t changed much as the exchange rate remains in the blue consolidation.
Where will the pair head next? Let’s examine the charts below and find out.
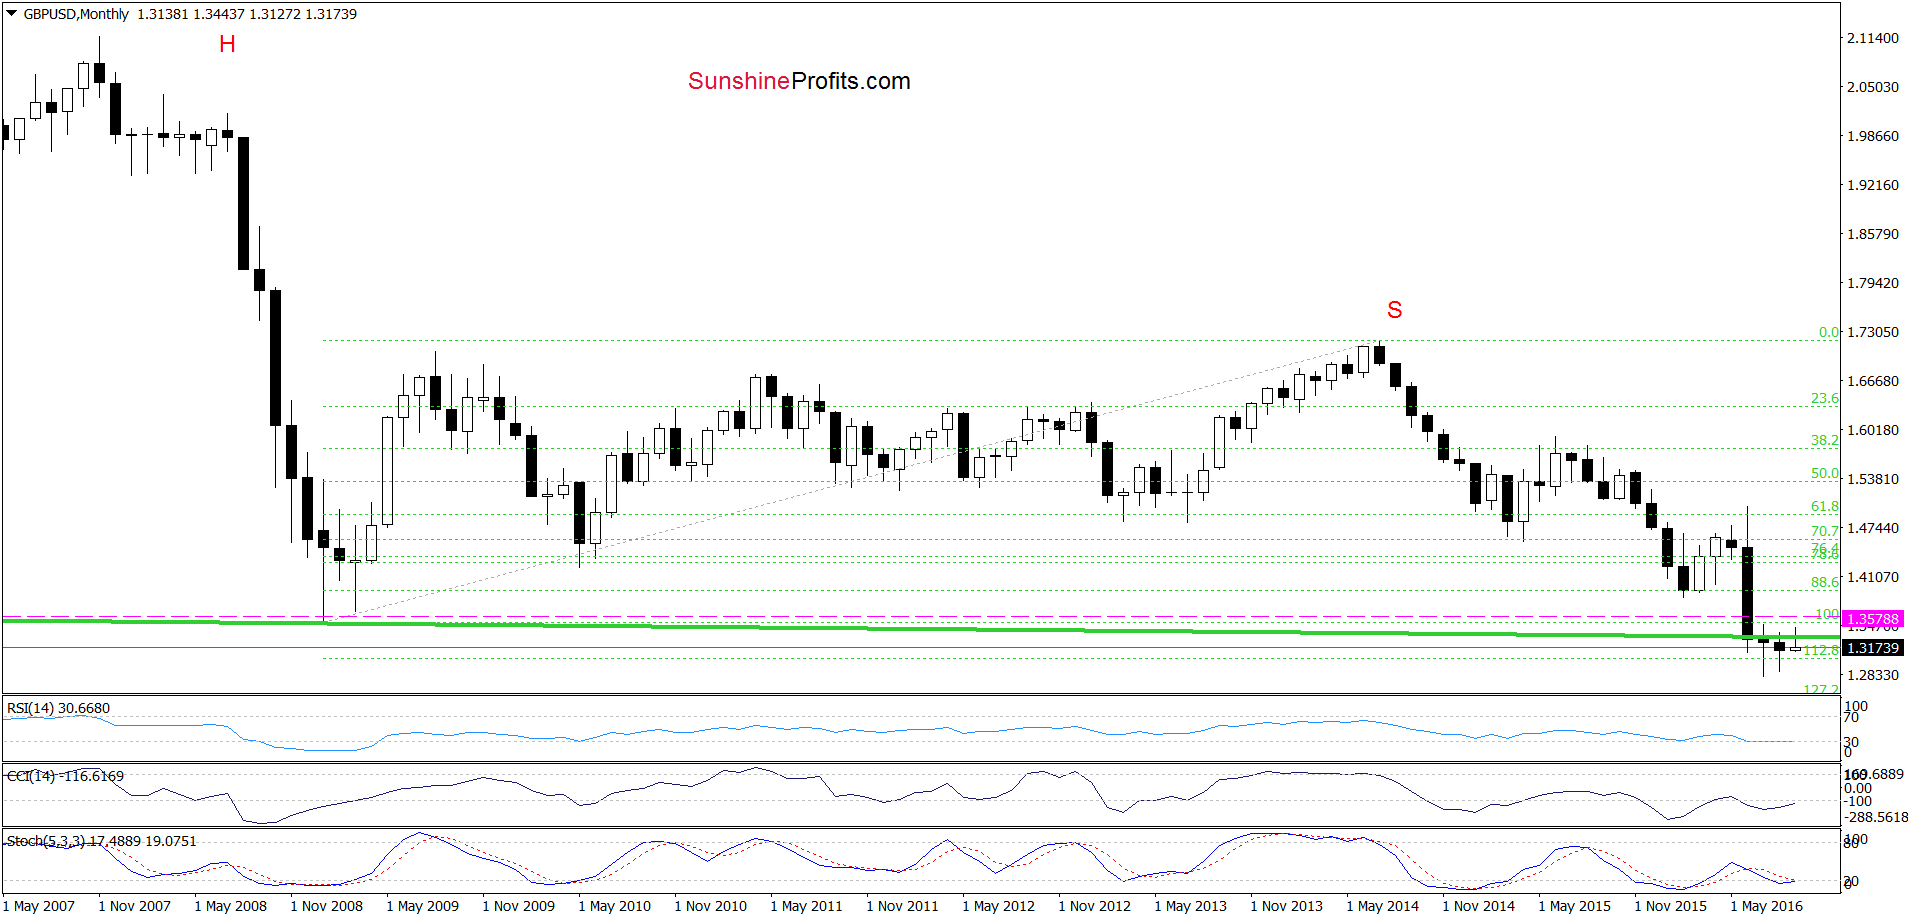
Looking at the monthly chart, we see that the long-term picture also hasn’t changed much, because although GBP/USD increased, the previously-broken neck line of the head and shoulders formation continues to keep gains in check. Such increase looks like another verification of earlier breakdown, which doesn’t bode well for the exchange rate in the coming week(s). But will we see declines in the coming days? Let’s examine the very short-term picture and find out.
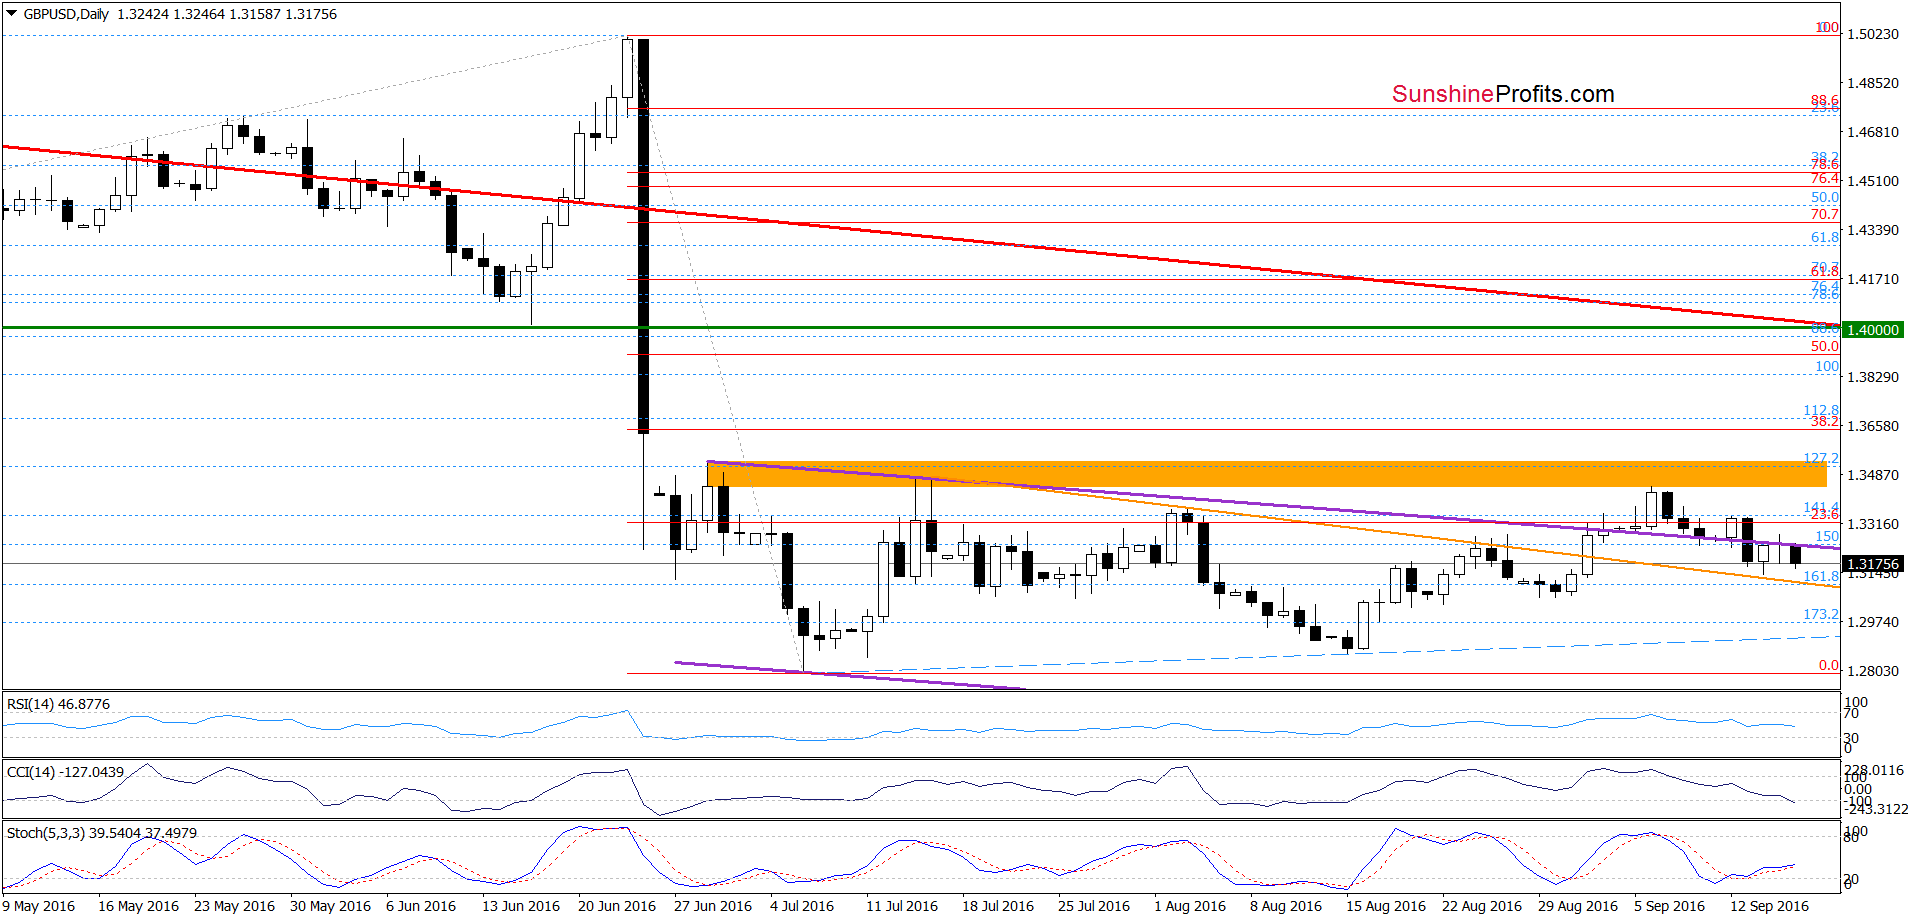
From this perspective, we see that although GBP/USD bounced off the medium-term purple line at the beginning of the week, this improvement was very temporary and the pair reversed on the following day, triggering a pullback, which invalidated earlier breakout. In recent days currency bulls pushed the pair higher, but they didn’t manage to come back above the purple line. As a result, the exchange rate moved lower once again earlier today, which looks like a verification of the breakdown. If this is the case, it is a negative signal that suggests further deterioration and a drop to the orange support line or even to the late Aug lows around 1.30581.3079 in the coming days.
Very short-term outlook: mixed with bearish bias
Short-term outlook: mixed
MT outlook: mixed
LT outlook: bearish
Trading position (short-term; our opinion): No positions are justified from the risk/reward perspective. We will keep you informed should anything change, or should we see a confirmation/invalidation of the above.
USD/CAD
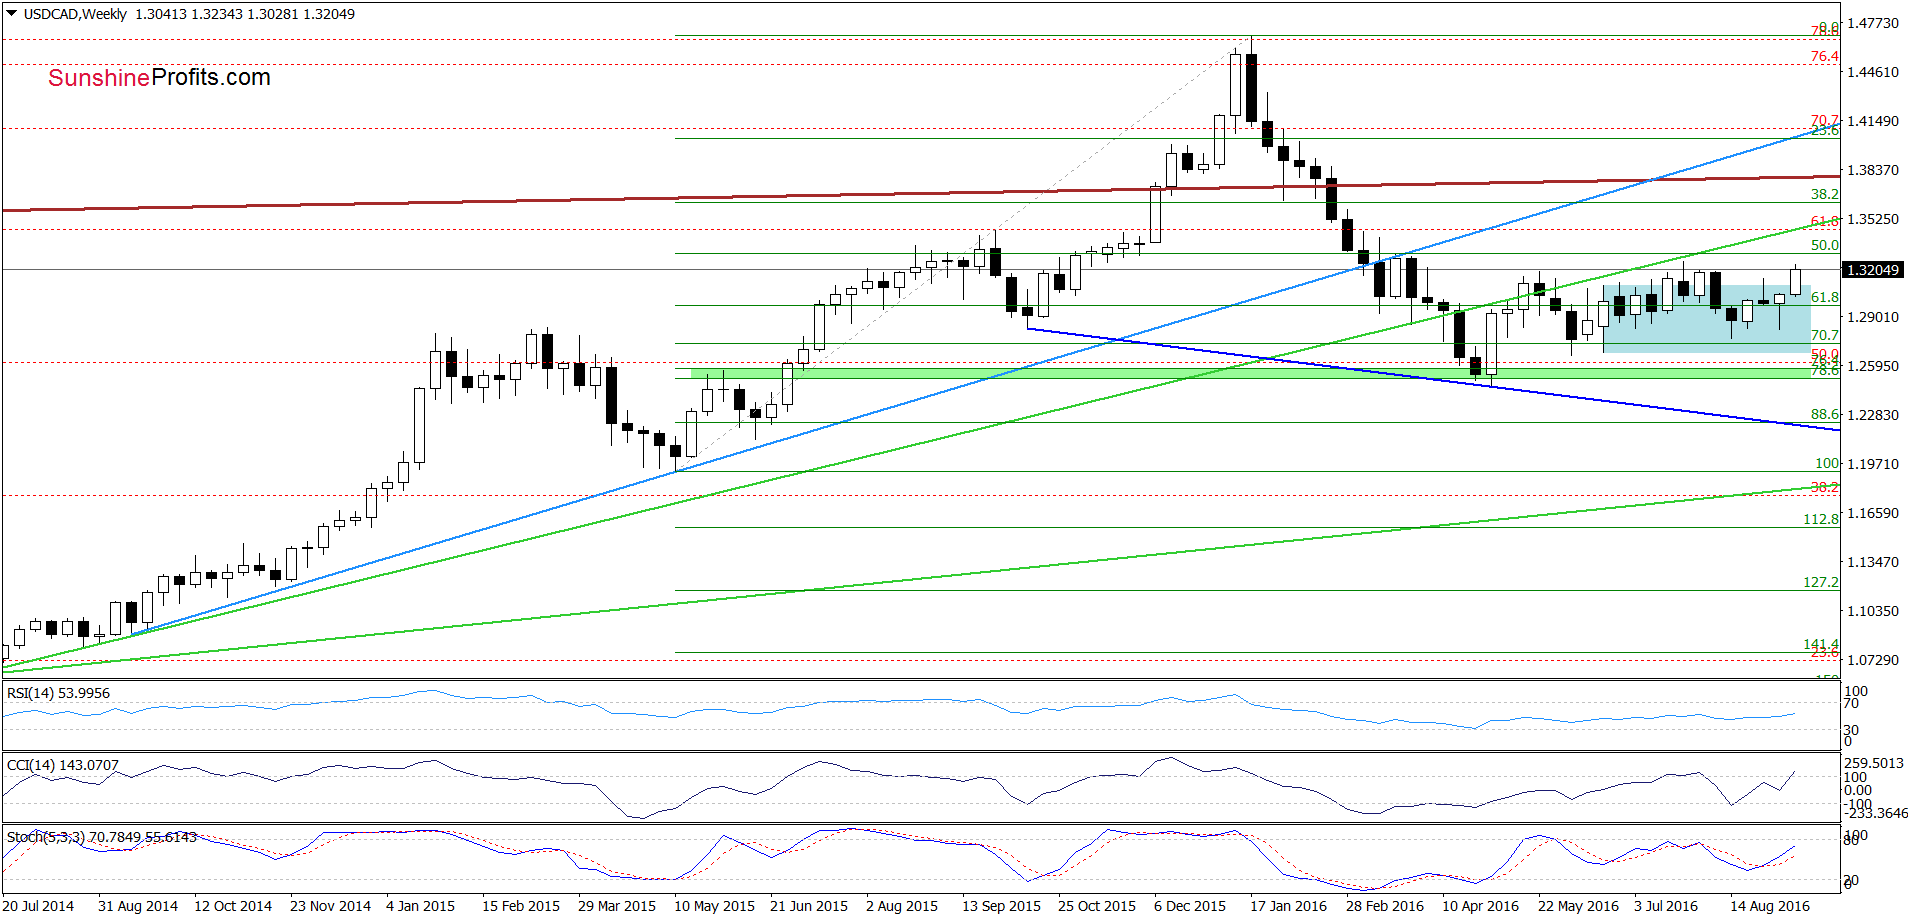
On the weekly chart, we see that USD/CAD extended gains above the upper border of the blue consolidation, which means that what we wrote on Monday is up-to-date:
(…) Although this is a positive signal, we saw similar price action at the end of Jul. Back then, the proximity to the long-term green rising resistance line was enough to trigger a reversal and decline. Another similar situation we saw at the end of Aug, but currency bulls didn’t manage to hold gained levels once again. Therefore, in our opinion, as long as there won’t be invalidation of the breakdown under green resistance line another sizable move to the upside is not likely to be seen. Nevertheless, buy signal generated by the Stochastic Oscillator suggests that USD/CAD will likely re-test recent highs in the coming week.
How the recent price action affect the very short-term picture? Let’s check.
On Monday, we wrote the following:
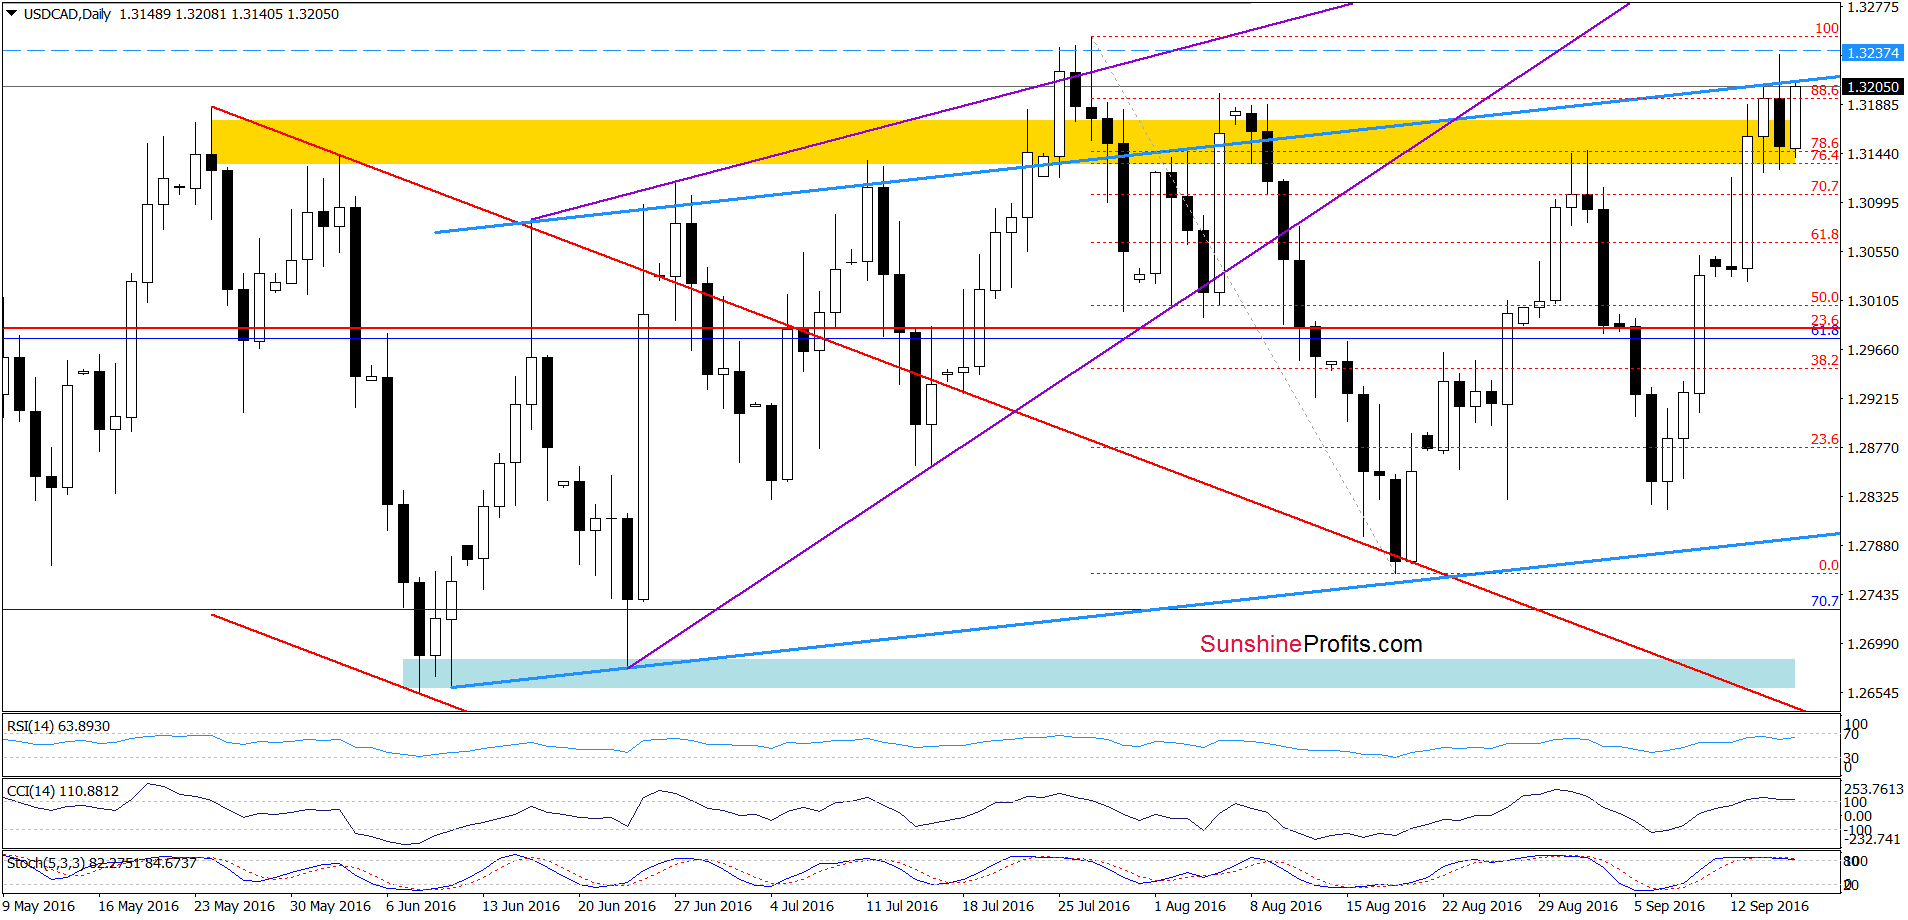
(…) USD/CAD rebounded sharply, which took the pair to the Sep high. With this upward move, the exchange rate also approached the yellow resistance zone once again. As you see on the daily chat, this area stopped currency bulls at the beginning of Aug and also at the turn of Aug and Sep, which suggests that we may see similar price action later this week. Nevertheless, as long as there won’t be sell signals generated by the indicators another upswing (even to the Aug highs) is likely.
From today’s point of view, we see that currency bulls pushed the pair higher as we had expected. With this week’s increase USD/CAD not only broke above the yellow resistance zone, but also climbed above the upper border of the blue rising trend channel. As you see, this improvement was very temporary and the exchange rate reversed yesterday, which triggered a pullback. Thanks to this drop, the pair invalidated earlier breakout, which in combination with the current position of the indicators suggests that lower values of the exchange rate in the coming week should not surprise us. At this point, it is worth noting that USD/CAD rebounded and erased almost all of yesterday’s losses earlier today. Nevertheless, in our opinion, as long as there won’t be a daily closure above the blue resistance line all upswings will be nothing more than verification of yesterday’s breakdown. If this is the case and the pair moves lower from current levels, the initial downside target would be around 1.3028-1.3030, where this week’s lows are.
Finishing today’s commentary on this currency pair we would also like to draw your attention to the long-term picture below.
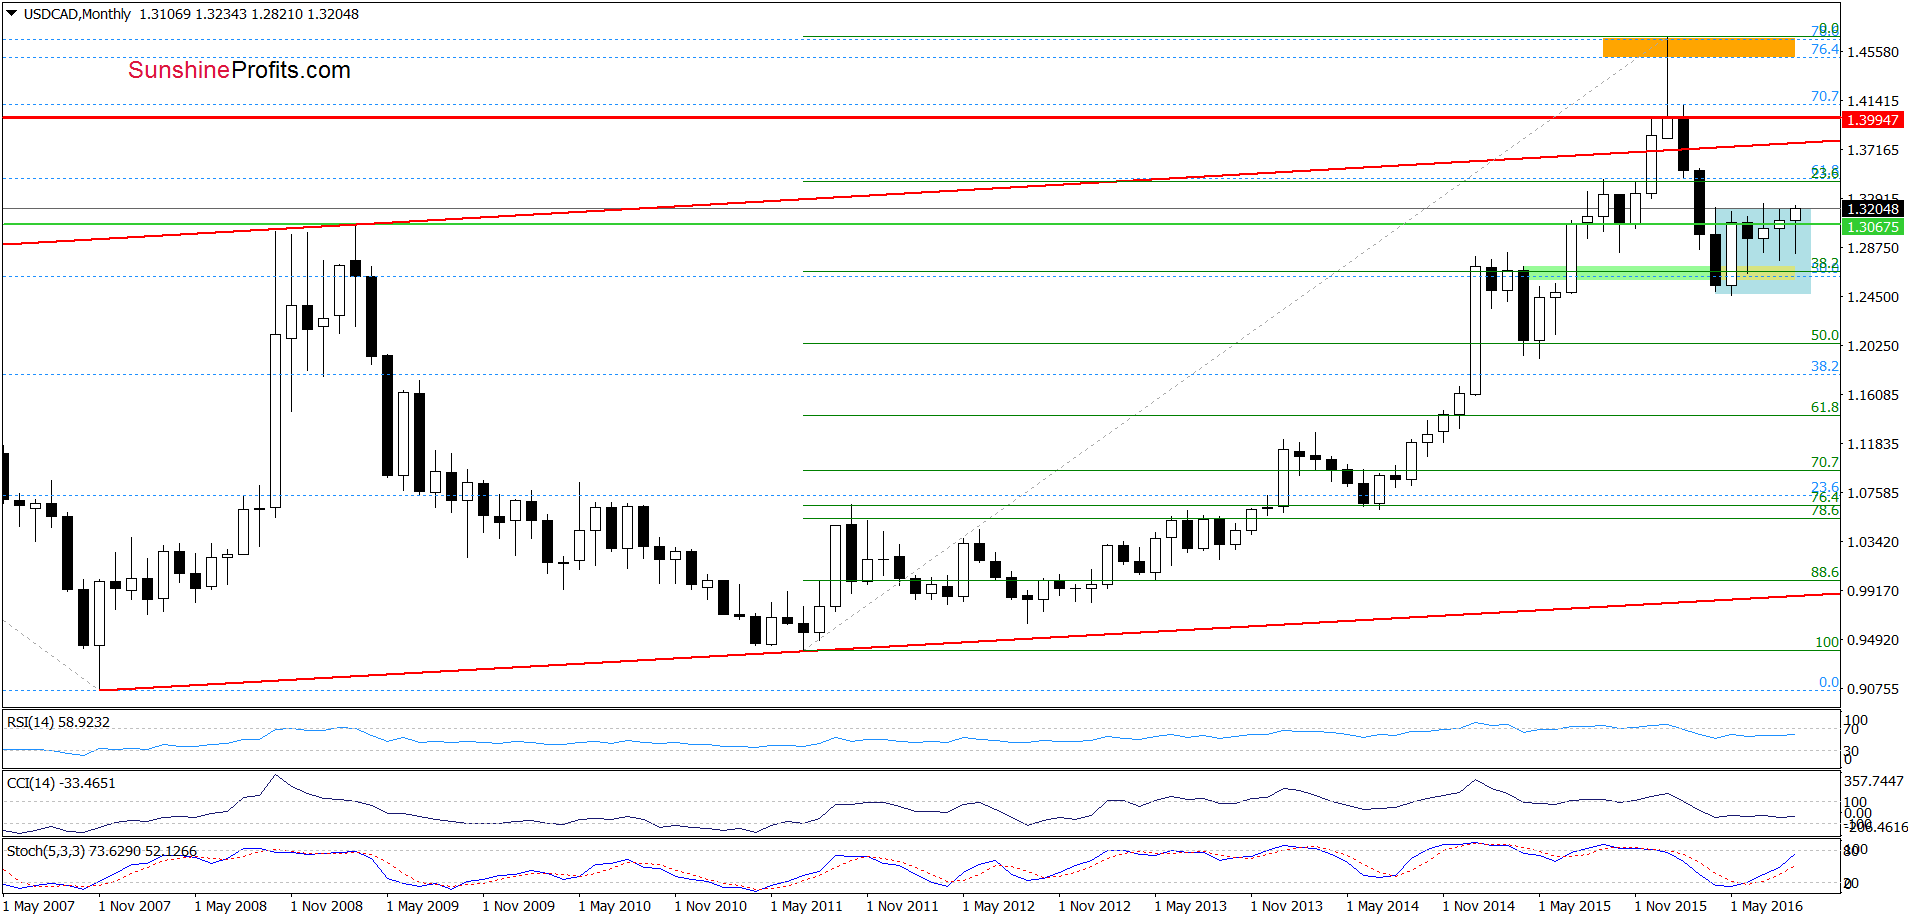
From the monthly perspective, we see that USD/CAD is trading in the blue consolidation and currently increased to the upper line of the formation. As you see, this area was strong enough to stop bulls in the previous months, which suggests that history will likely repeat itself once again and we’ll see a reversal and decline in the coming week.
Very short-term outlook: mixed with bearish bias
Short-term outlook: mixed with bearish bias
MT outlook: mixed
LT outlook: mixed with bearish bias
Trading position (short-term; our opinion): No positions are justified from the risk/reward perspective. Nevertheless, if we see another show of currency bulls’ weakness, we’ll consider opening short positions in very near future (maybe even on Monday). We will keep you informed should anything change, or should we see a confirmation/invalidation of the above.
Thank you.
Nadia Simmons
Forex & Oil Trading Strategist
Przemyslaw Radomski, CFA
Founder, Editor-in-chief, Gold & Silver Fund Manager
Gold & Silver Trading Alerts
Forex Trading Alerts
Oil Investment Updates
Oil Trading Alerts

