

Earlier today, the yen moved higher against the greenback as safe havens buying supported the Japanese currency. In this environment, USD/JPY slipped under the previously-broken resistance zone, invalidating earlier breakout. What does it mean for the exchange rate?
In our opinion the following forex trading positions are justified - summary:
EUR/USD
The situation in the medium-term hasn’t changed much as EUR/USD is trading between last week’s high and low. Today, we’ll focus on the daily chart.
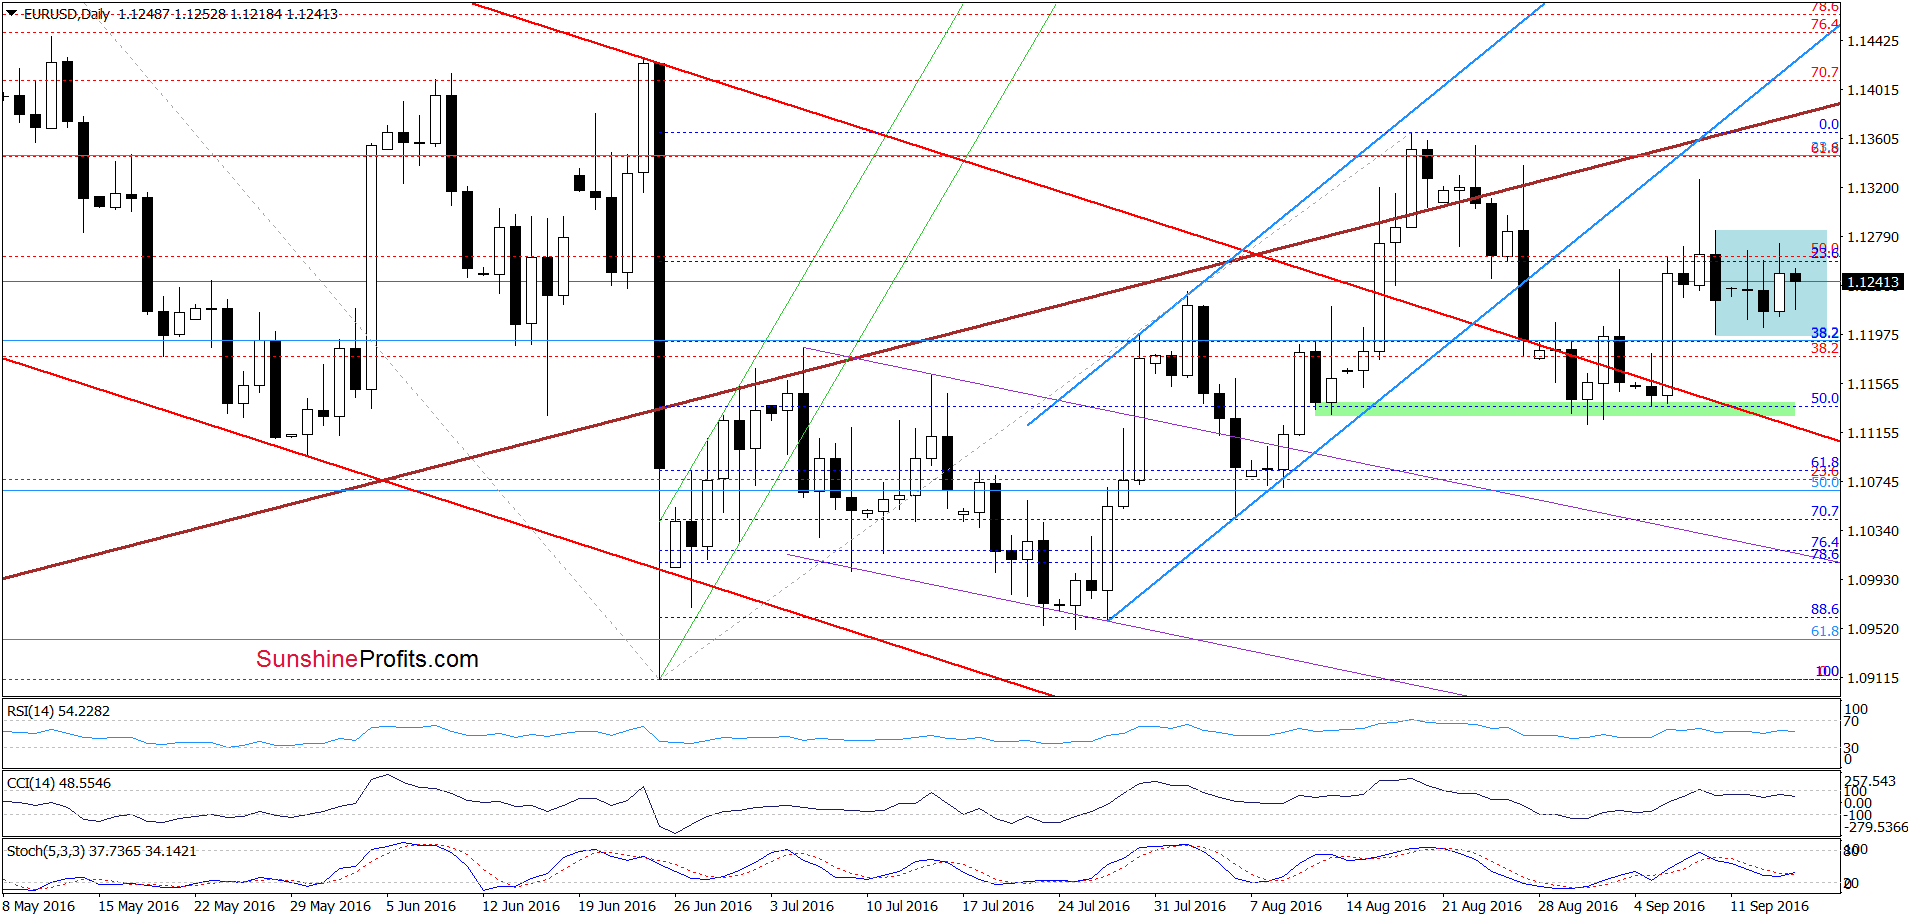
From today’s point of view, we see that the very short-term picture also remains almost unchanged as EUR/USD is trading in the blue consolidation. Therefore, our previous commentary is up-to-date:
(…) in our opinion, as long as there won’t be breakout above the upper line of the formation (or a breakdown under the Sep 9 low of 1.1197) another bigger move is not likely to be seen. Nevertheless, we think it is worth considering both pro-growth and bearish scenarios. If currency bulls push EUR/USD above 1.1284, we’ll see further improvement and a test of the medium-term brown resistance line in the following days. On the other hand, sell signals generated by the indicators remain in play, supporting currency bears, which suggests that if the pair extends declines, we’ll likely see a re-test of the green support zone and the upper border of the red declining trend channel in the following days.
Very short-term outlook: mixed
Short-term outlook: mixed
MT outlook: mixed
LT outlook: mixed
Trading position (short-term; our opinion): No positions are justified from the risk/reward perspective. We will keep you informed should anything change, or should we see a confirmation/invalidation of the above.
USD/JPY
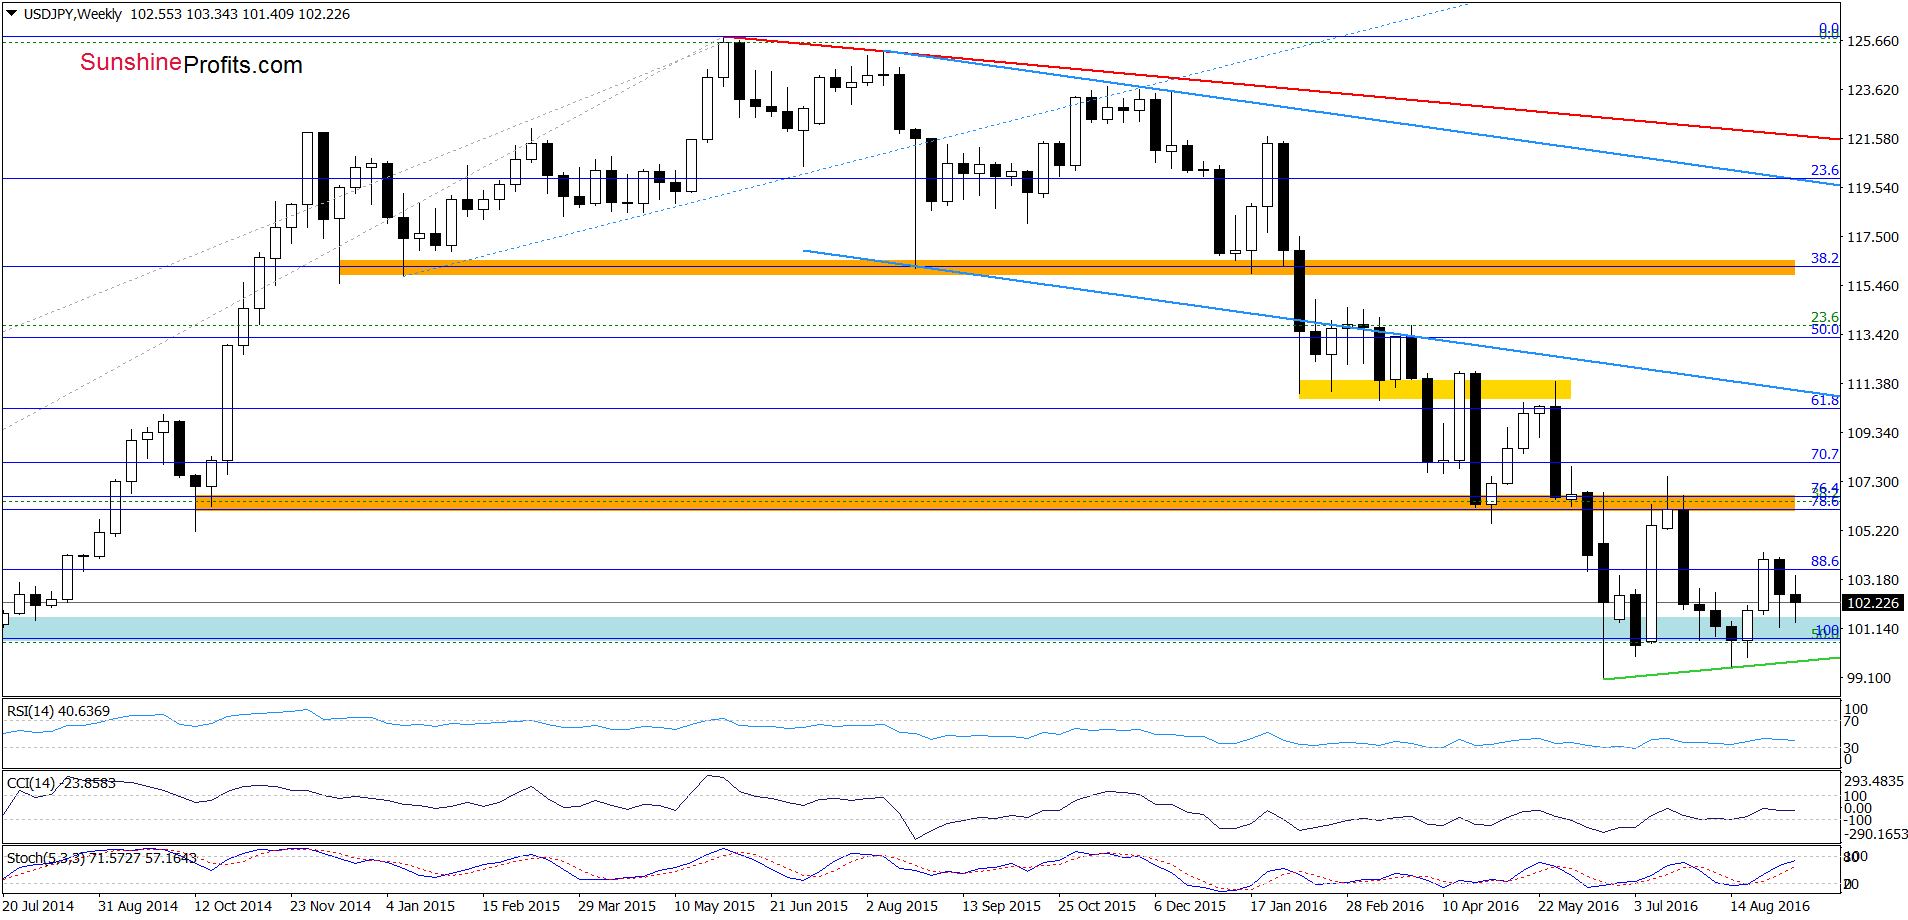
On the weekly chart, we see that USD/JPY is still trading above the blue support zone. In the previous week there was similar price action, which suggests that further improvement is likely – especially when we factor in buy signals generated by the indicators. But are there any technical factors that could hinder the realization of the above scenario? Let’s examine the very short-term chart and find out.
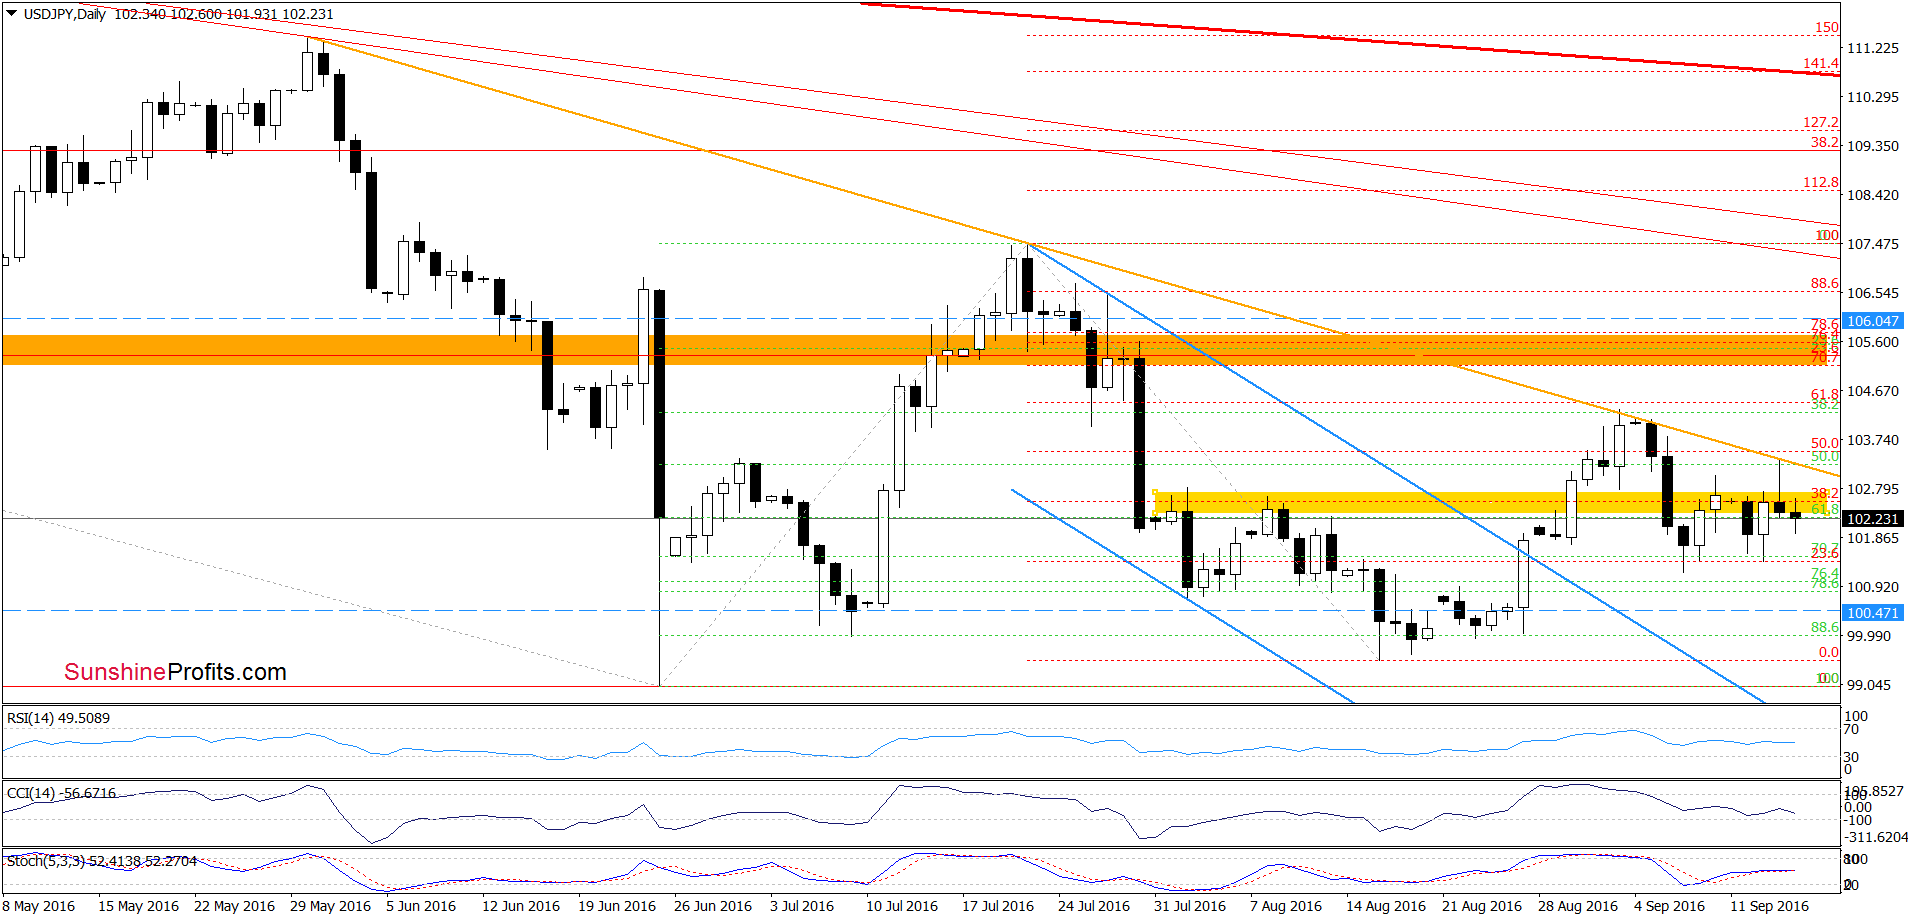
From this perspective, we see that although USD/JPY rebounded in the previous week the yellow resistance zone triggered a decline, which erased most of that increase. Yesterday, the exchange rate moved above this area once again, but currency bulls didn’t manage to hold gained levels, which resulted in another invalidation of the breakout. Such price action doesn’t bode well for the exchange rate, suggesting lower values in the coming day(s) – especially if the Stochastic Oscillator generates a sell signal. Finishing today’s commentary on this currency pair please keep in mind that, in our opinion, as long as there won’t be breakout above the orange resistance zone, further improvement is questionable and another re-test of the barrier of 100 should not surprise us.
Very short-term outlook: mixed with bearish bias
Short-term outlook: mixed
MT outlook: mixed
LT outlook: mixed
Trading position (short-term; our opinion): No positions are justified from the risk/reward perspective. We will keep you informed should anything change, or should we see a confirmation/invalidation of the above.
AUD/USD
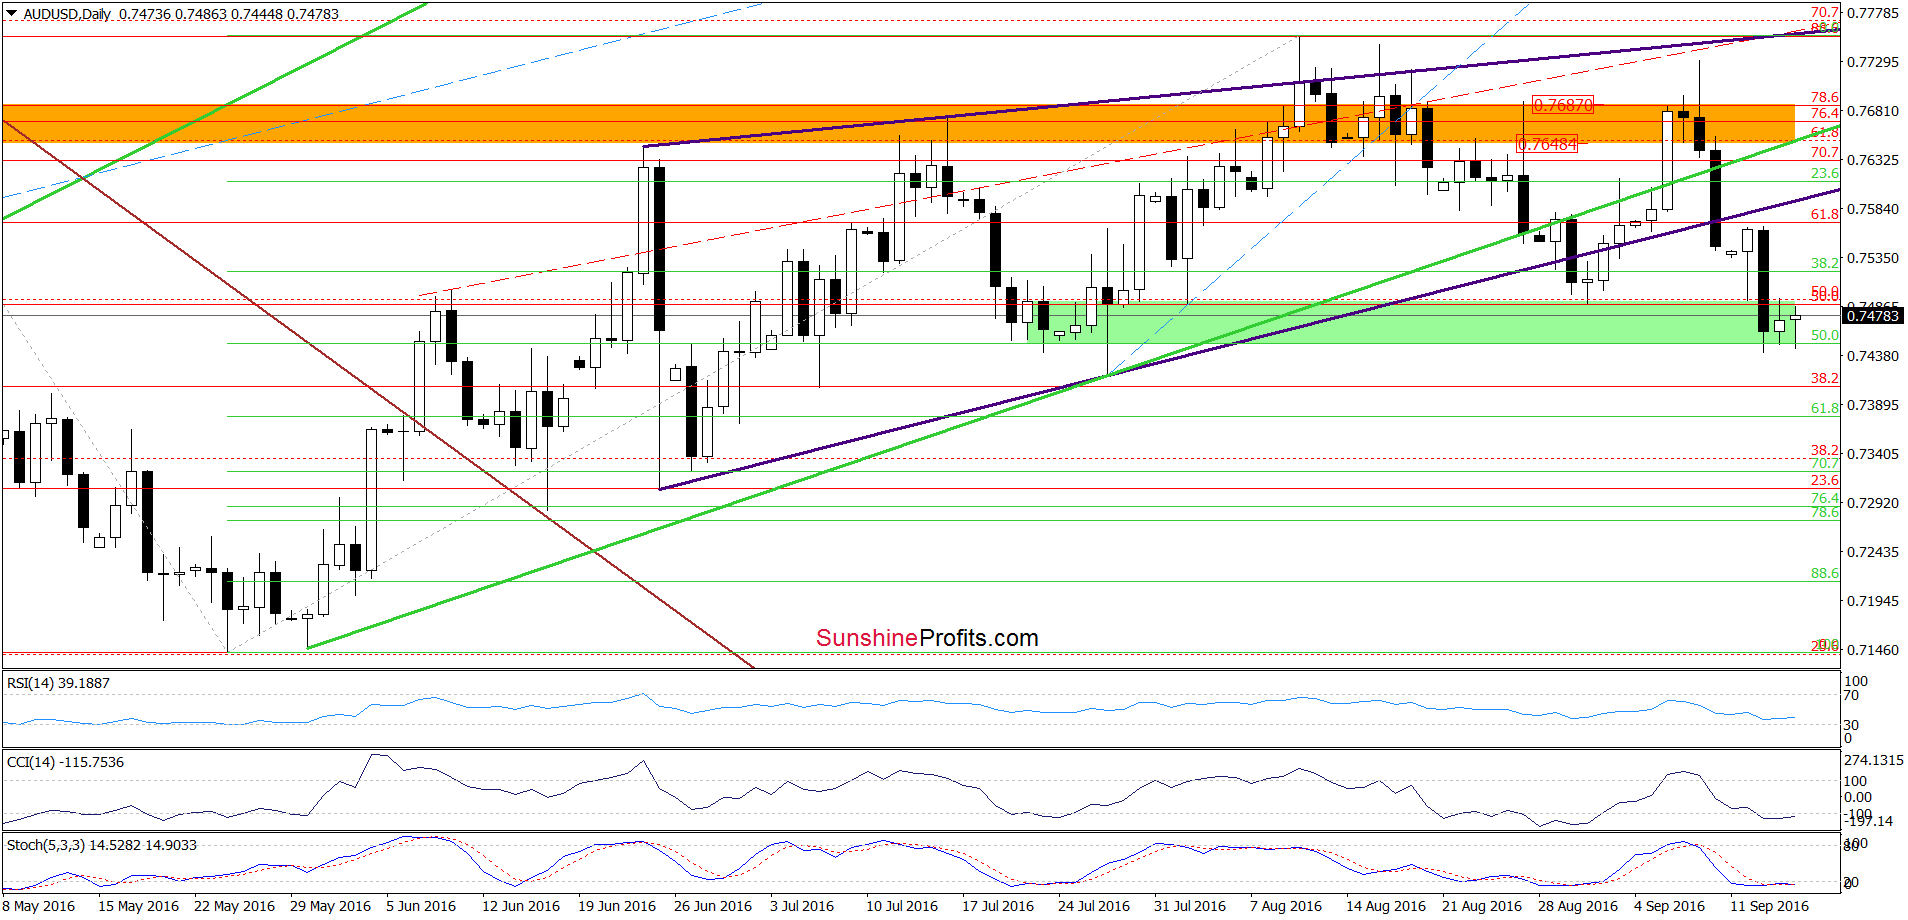
On Tuesday, we wrote the following:
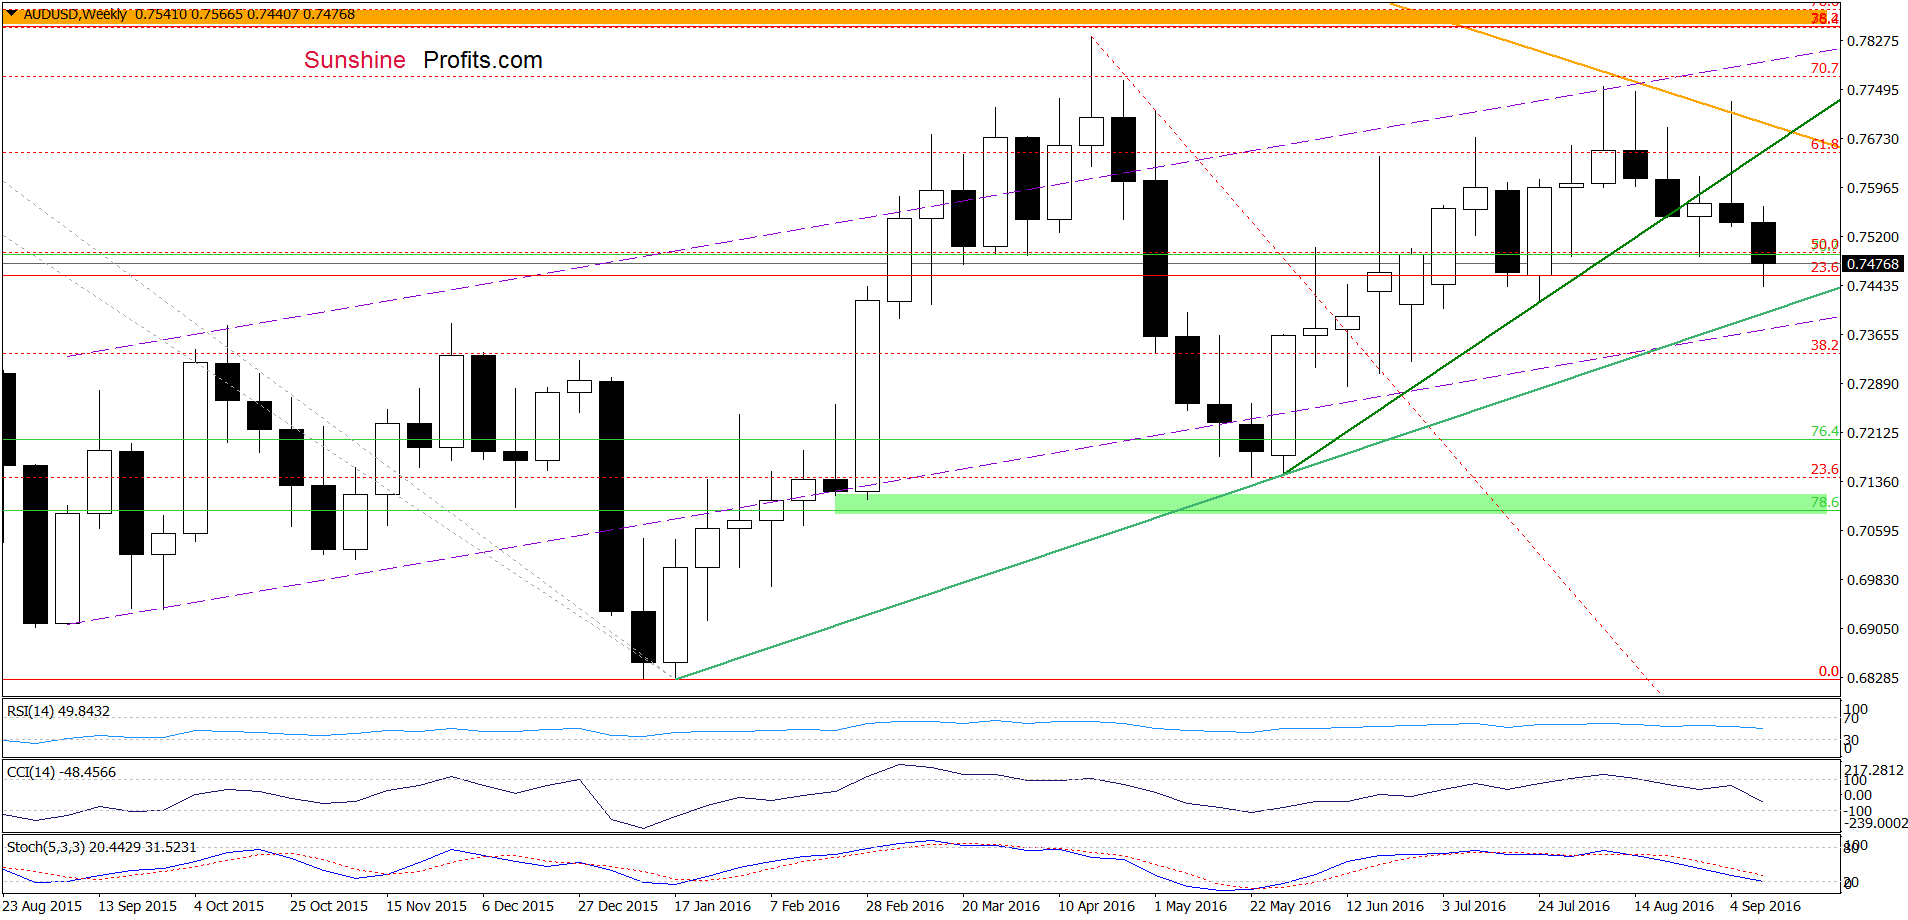
(…) invalidation of the breakout above the orange resistance zone triggered a sharp decline, which took AUD/USD not only under the medium-term green support line, but also below the lower border of the navy blue rising wedge. Yesterday, the green support zone triggered a rebound, but despite this increase, the exchange rate didn’t even reach the lower navy blue line, which showed currency bulls’ weakness and resulted in another downswing earlier today. What’s next? Taking all the above into account, we think that the pair will re-test the green zone and the 50% Fibonacci retracement in the coming days.
Looking at the daily chart, we see that he situation developed in line with the above scenario and AUD/USD slipped to our downside target. Yesterday, and also earlier today, this area managed to stop declines, which in combination with the current position of the indicators (the CCI and the Stochastic Oscillator is oversold and very close to generating buy signals) suggests that the space for declines may be limited and reversal is just around the corner.
Very short-term outlook: mixed
Short-term outlook: mixed
MT outlook: mixed
LT outlook: mixed
Trading position (short-term; our opinion): No positions are justified from the risk/reward perspective. We will keep you informed should anything change, or should we see a confirmation/invalidation of the above.
Thank you.
Nadia Simmons
Forex & Oil Trading Strategist
Przemyslaw Radomski, CFA
Founder, Editor-in-chief, Gold & Silver Fund Manager
Gold & Silver Trading Alerts
Forex Trading Alerts
Oil Investment Updates
Oil Trading Alerts

