

Earlier today, the U.S. dollar extended gains against its Canadian counterpart as disappointing unemployment data from Canada (the unemployment rate increased to 7.0% in the previous month) and declining price of crude oil continued to weigh on investors’ sentiment. Thanks to these circumstances, USD/CAD approached the Sep high and the key resistance zone. Will it stop further rally?
In our opinion the following forex trading positions are justified - summary:
EUR/USD
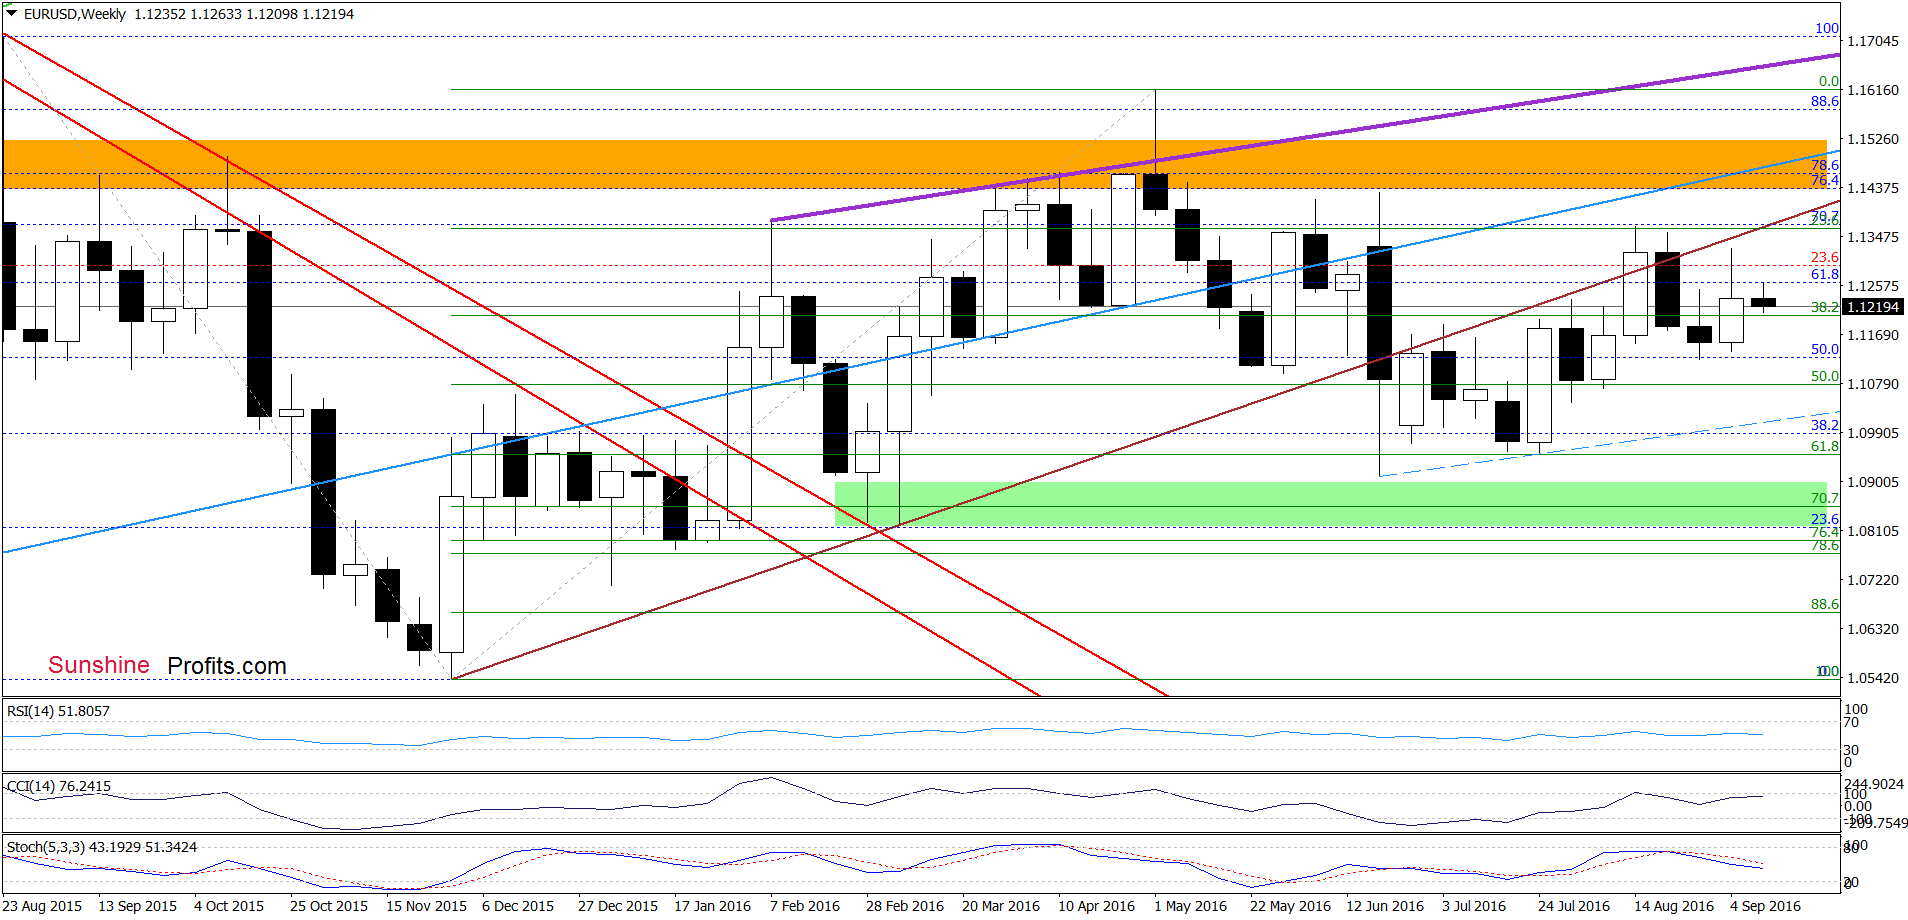
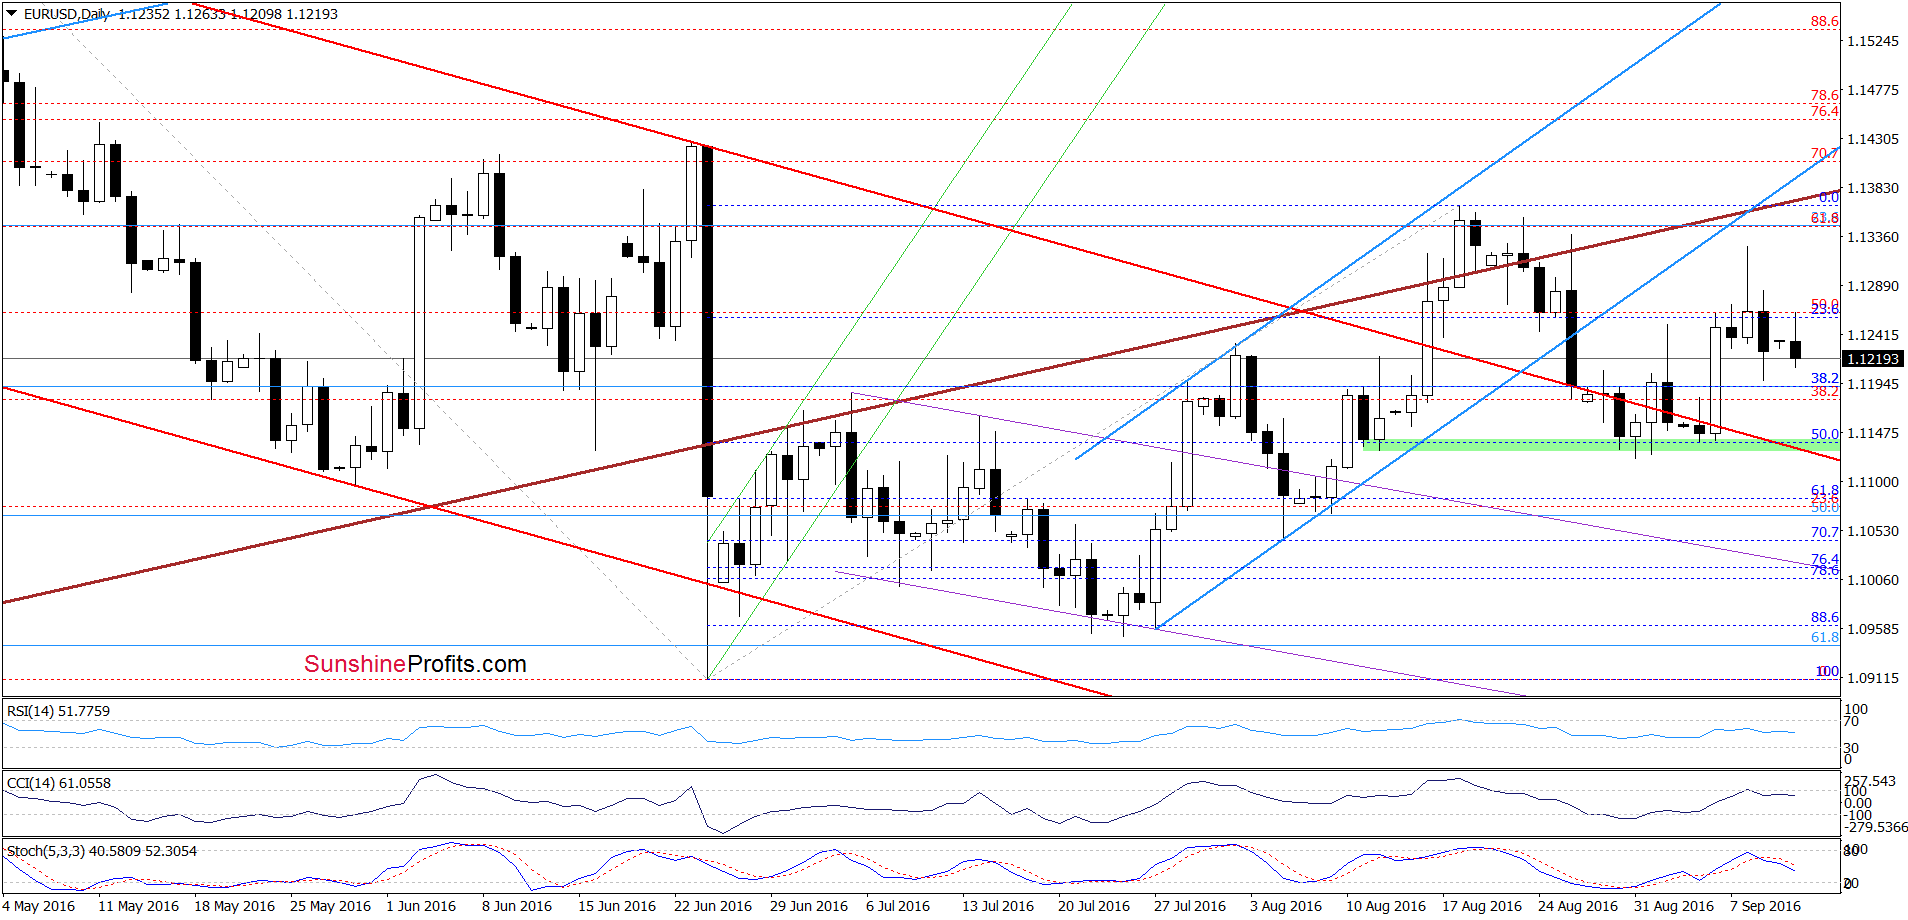
From today’s point of view, we see that although EUR/USD moved higher earlier today, currency bulls didn’t manage to push the exchange rate above Friday’s high, which resulted in another pullback. Additionally, sell signals generated by the indicators remain in play, which suggest further declines. If this is the case and the pair extends losses, we’ll see a re-test of the green support zone and the upper border of the red declining trend channel in the coming week.
Very short-term outlook: bearish
Short-term outlook: mixed
MT outlook: mixed
LT outlook: mixed
Trading position (short-term; our opinion): No positions are justified from the risk/reward perspective. We will keep you informed should anything change, or should we see a confirmation/invalidation of the above.
GBP/USD
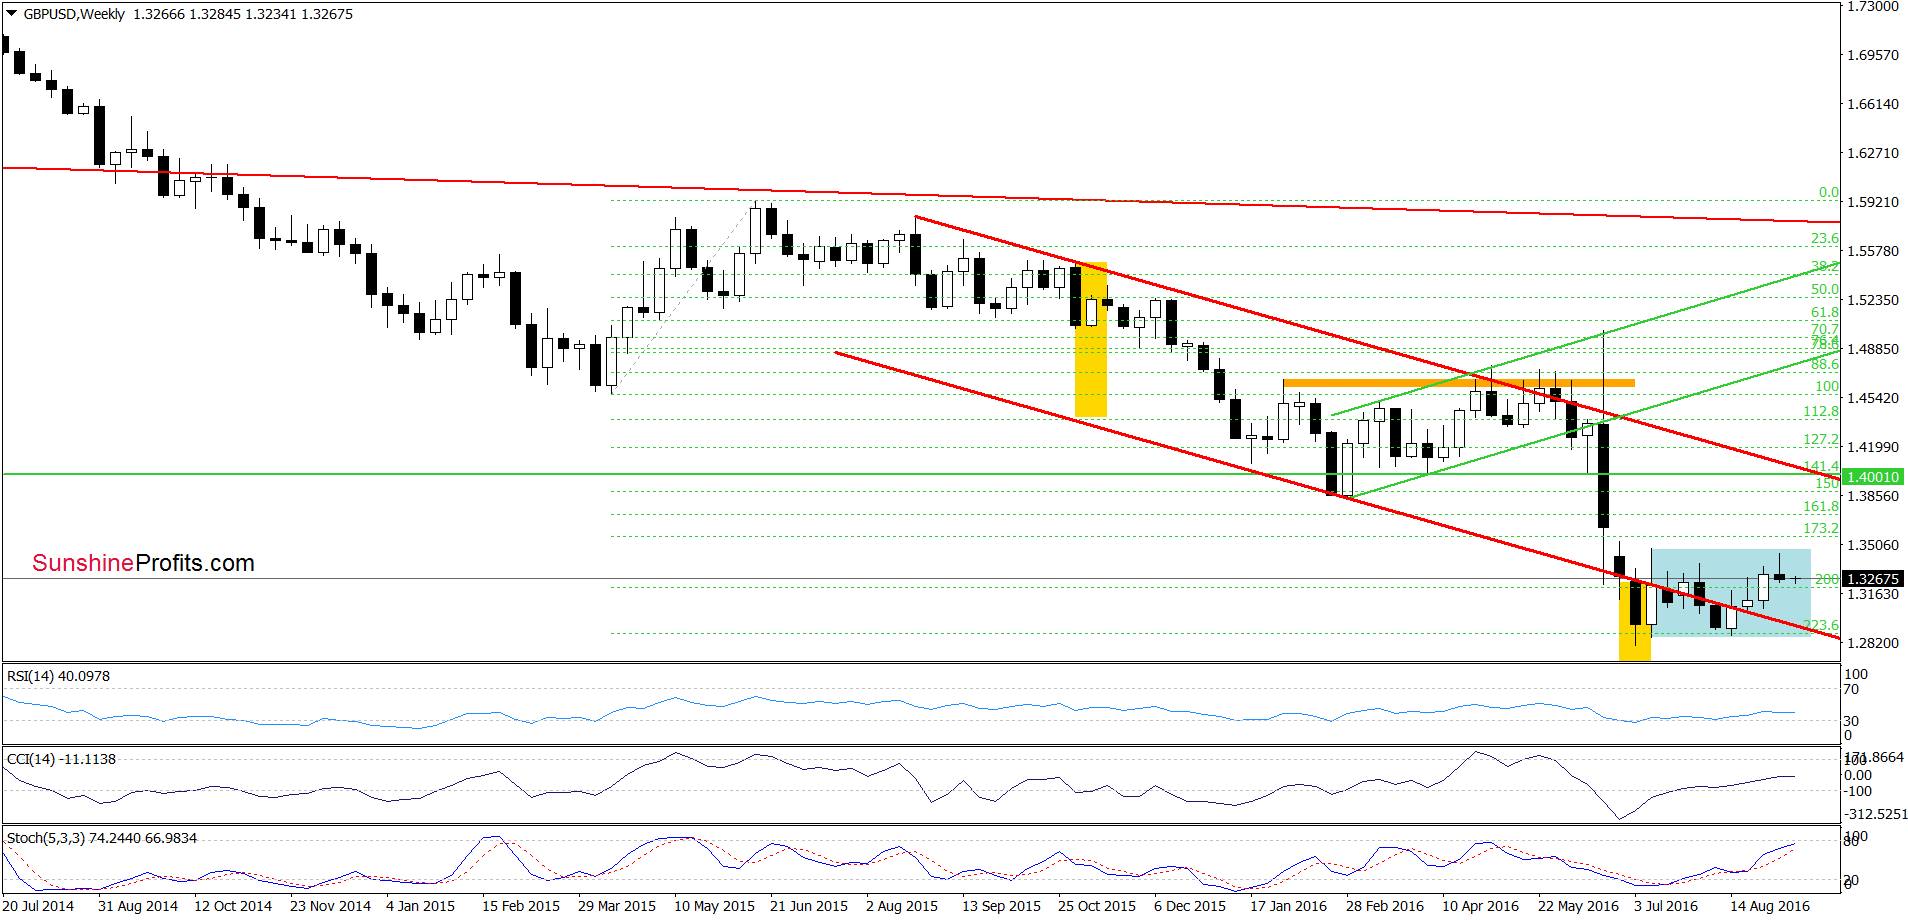
From the medium-term perspective, we see that although GBP/USD moved higher in the previous week, the overall situation hasn’t changed much as the exchange rate remains in the blue consolidation.
Where will the pair head next? Let’s examine the charts below and find out.
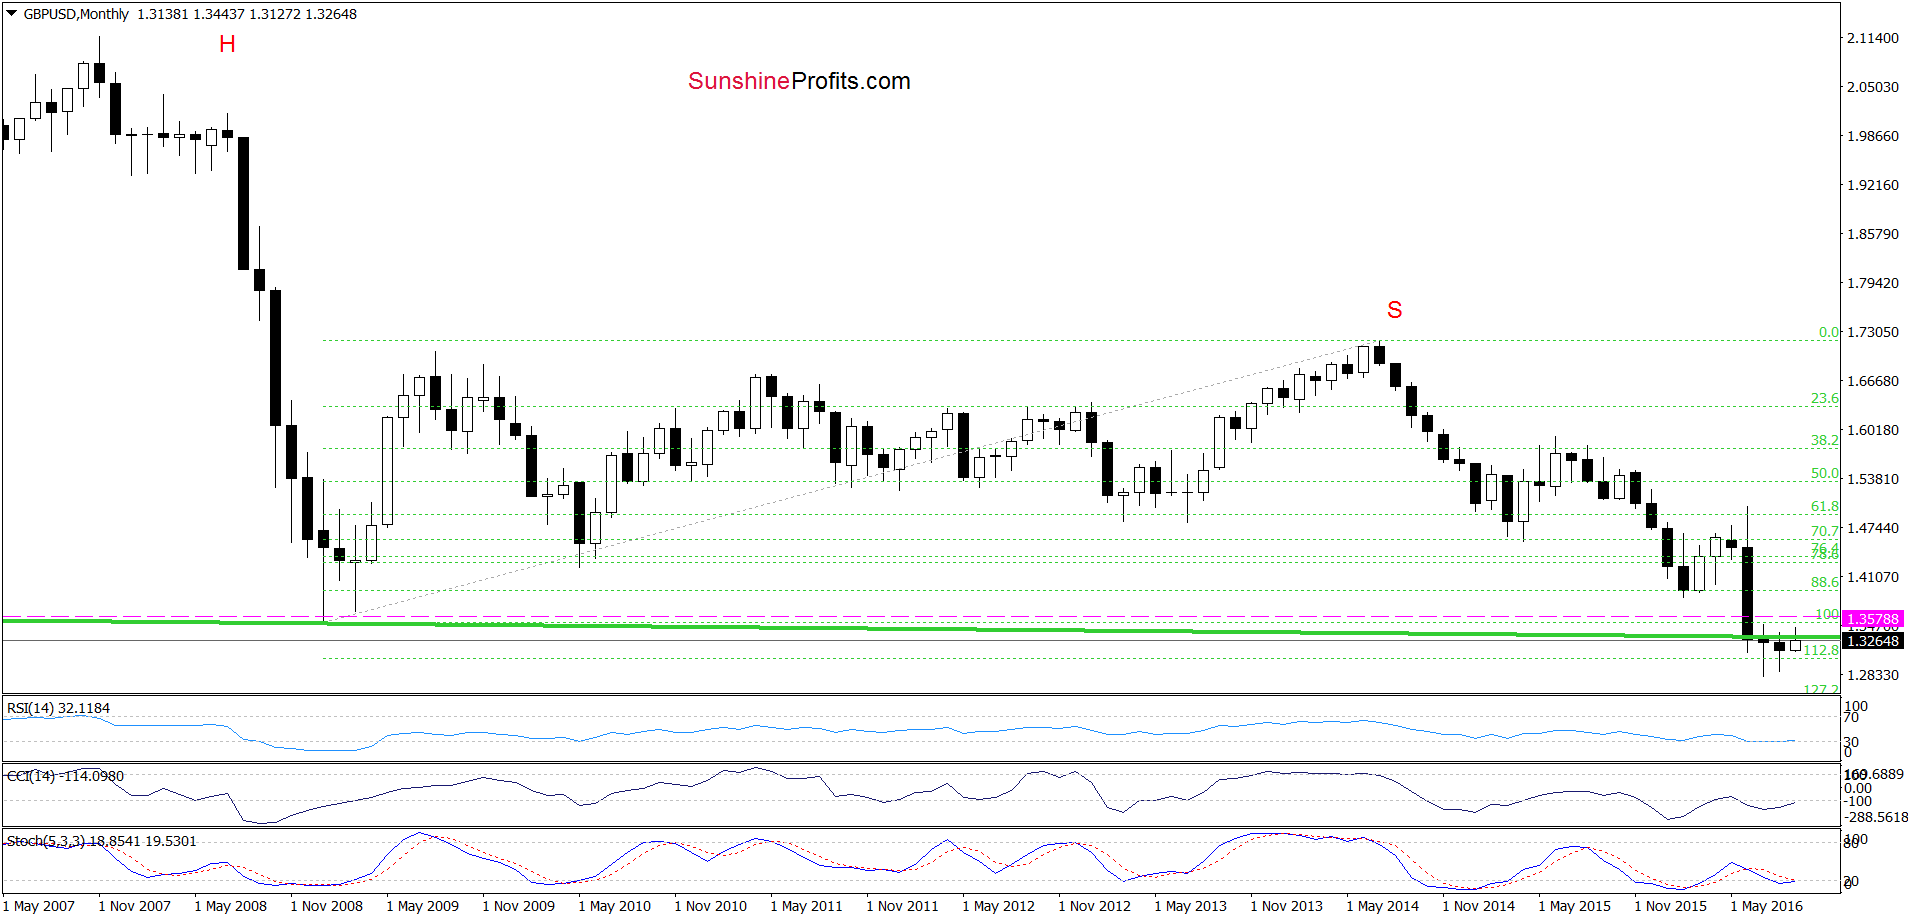
Looking at the monthly chart, we see that the long-term picture also hasn’t changed much, because although GBP/USD increased, the previusly-broken neck line of the head and shoulders formation continues to keep gains in check. Such increase looks like another verification of earlier breakdown, which doesn’t bode well for the exchange rate in the coming week(s). But will we see declines in the coming days? Let’s examine the very short-term picture and find out.
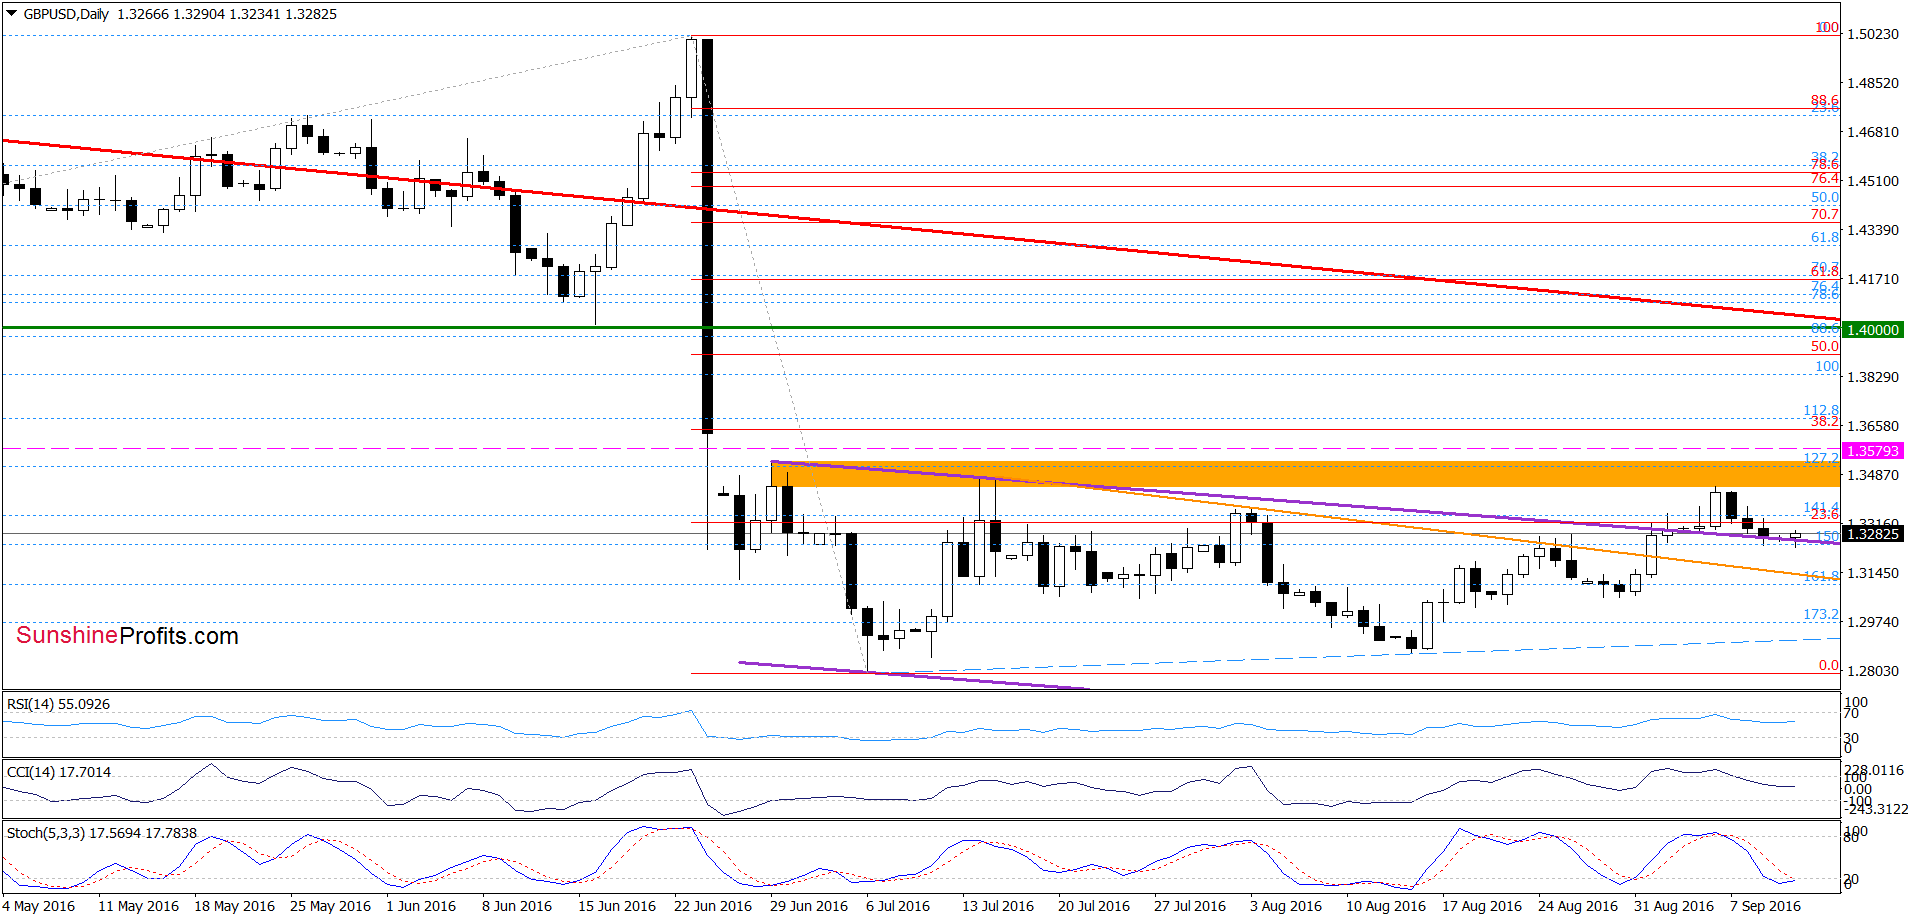
From this perspective, we see that the key rsistance zone (marked with orange) stopped currency bulls once again. As a result GBP/USD pulled back to the previously-broken medium-term purple line, which looks like a veryfiatio of earlier breakout (a positive sign). Additionally, the current position of the Stochastic Oscillator (very close to generatng a buy signal) suggests that higher values of the exchange rate are just around the corner. If this is the case and the pair rebunds from here, the initial upside target would be the orange resistance zone and the neck line of the head and shoulders formation (marked on the monthly chart).
Very short-term outlook: mixed with bullish bias
Short-term outlook: mixed
MT outlook: mixed
LT outlook: mixed
Trading position (short-term; our opinion): No positions are justified from the risk/reward perspective. We will keep you informed should anything change, or should we see a confirmation/invalidation of the above.
USD/CAD
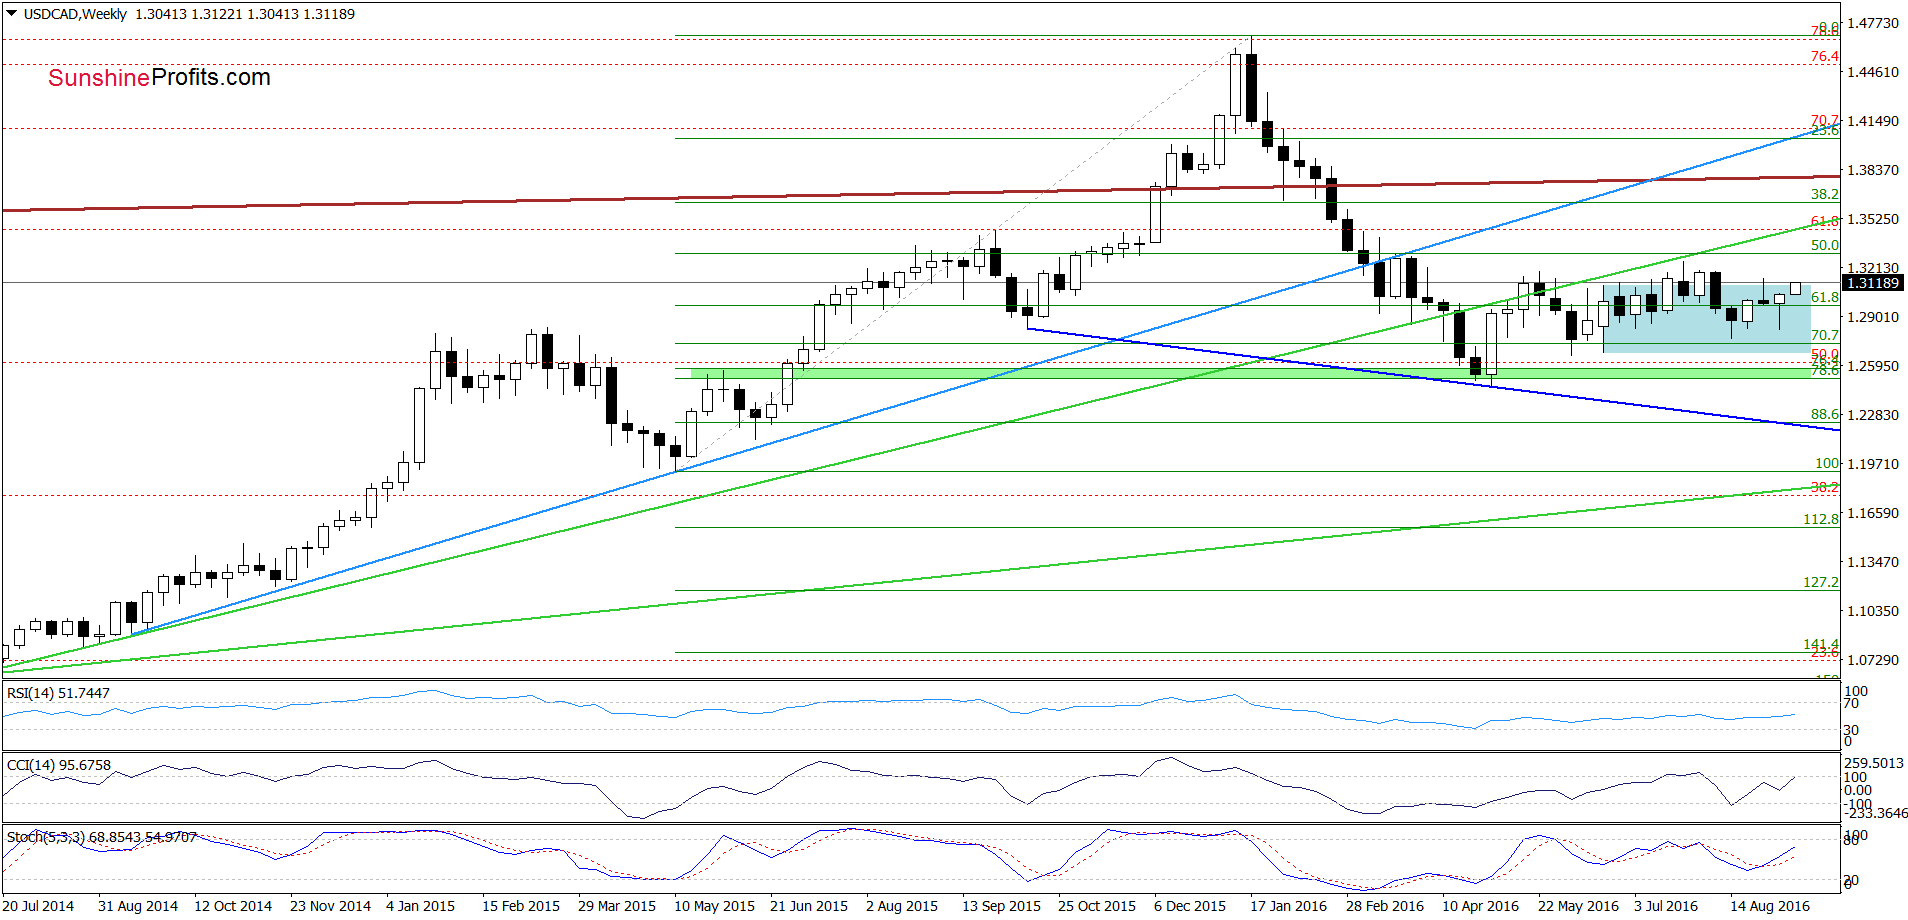
On the weekly chart, we see that USD/CAD reversed and came back to the upper border of the blue consolidation. Although this is a positive signal, we saw similar price action at the end of Jul.Back then, the proximity to the long-term green rising resistance line was enough to trigger a reversal and decline. Another similar situation we saw at the end of Aug, but currency bulls didn’t manage to hold gained levels once again. Therefore, in our opinion, as long as there won’t be invalidation of the breakdown under green resistance line another sizable move to the upside is not likely to be seen. Nevertheless, buy signal generated by the Stochastic Oscillator suggests that USD/CAD will likely re-test recent highs in the coming week.
Having said the above, let’s examine the very short-term picture of the exchange rate.
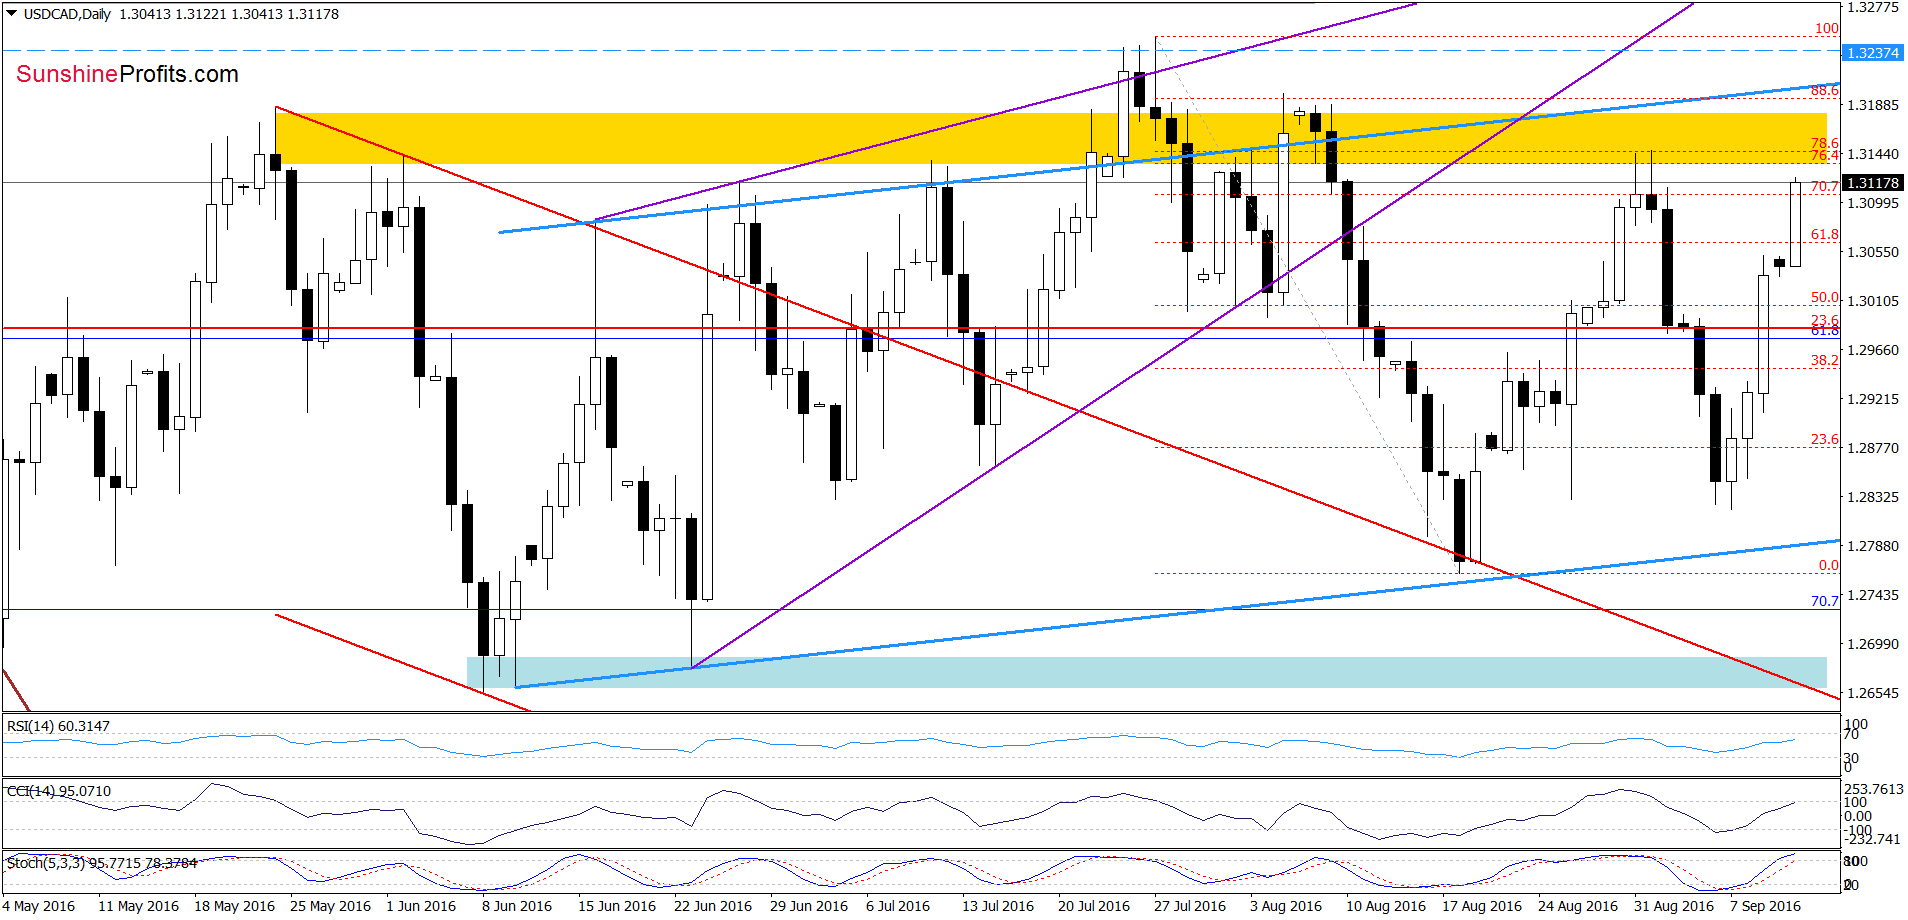
Looking at the daily chart, we see that USD/CAD rebounded sharply, which took the pair to the Sep high. With this upward move, the exchange rate also approached the yellow resistance zone once again. As you see on the daily chat, this area stopped currency bulls at the beginning of Aug and also at the turn of Aug and Sep, which suggests that we may see similar price action later this week. Neverheless, as long as there won’t be sell signals geerated by the indicators another another upswing (even to the Aug highs) is likely.
Very short-term outlook: mixed with bullish bias
Short-term outlook: mixed
MT outlook: mixed
LT outlook: mixed
Trading position (short-term; our opinion): No positions are justified from the risk/reward perspective. We will keep you informed should anything change, or should we see a confirmation/invalidation of the above.
Thank you.
Nadia Simmons
Forex & Oil Trading Strategist
Przemyslaw Radomski, CFA
Founder, Editor-in-chief, Gold & Silver Fund Manager
Gold & Silver Trading Alerts
Forex Trading Alerts
Oil Investment Updates
Oil Trading Alerts

