

Earlier today, the Australian dollar moved higher against its U.S. counterpart after the Reserve Bank of Australia left its interest rate at 1.50%. As a result, AUD/USD invalidated earlier breakdown under the medium-term support line. Will this event trigger further rally in the coming days?
In our opinion the following forex trading positions are justified - summary:
- EUR/USD: long (stop-loss at 1.1056; initial upside target at 1.1304)
- GBP/USD: short (a stop-loss at 1.3579; initial downside target at 1.2519)
- USD/JPY: short (stop-loss at 106.04; initial downside target at 100.47)
- USD/CAD: short (stop-loss at 1.3237; initial downside target at 1.2877)
- USD/CHF: short (stop-loss at 0.9935; initial downside target at 0.9630)
- AUD/USD: none
EUR/USD
The situation in the medium term hasn’t changed much since our previous alert was posed as EUR/USD remains under the previously-broken brown resistance line. Today, we’ll focus on the very short-term changes.
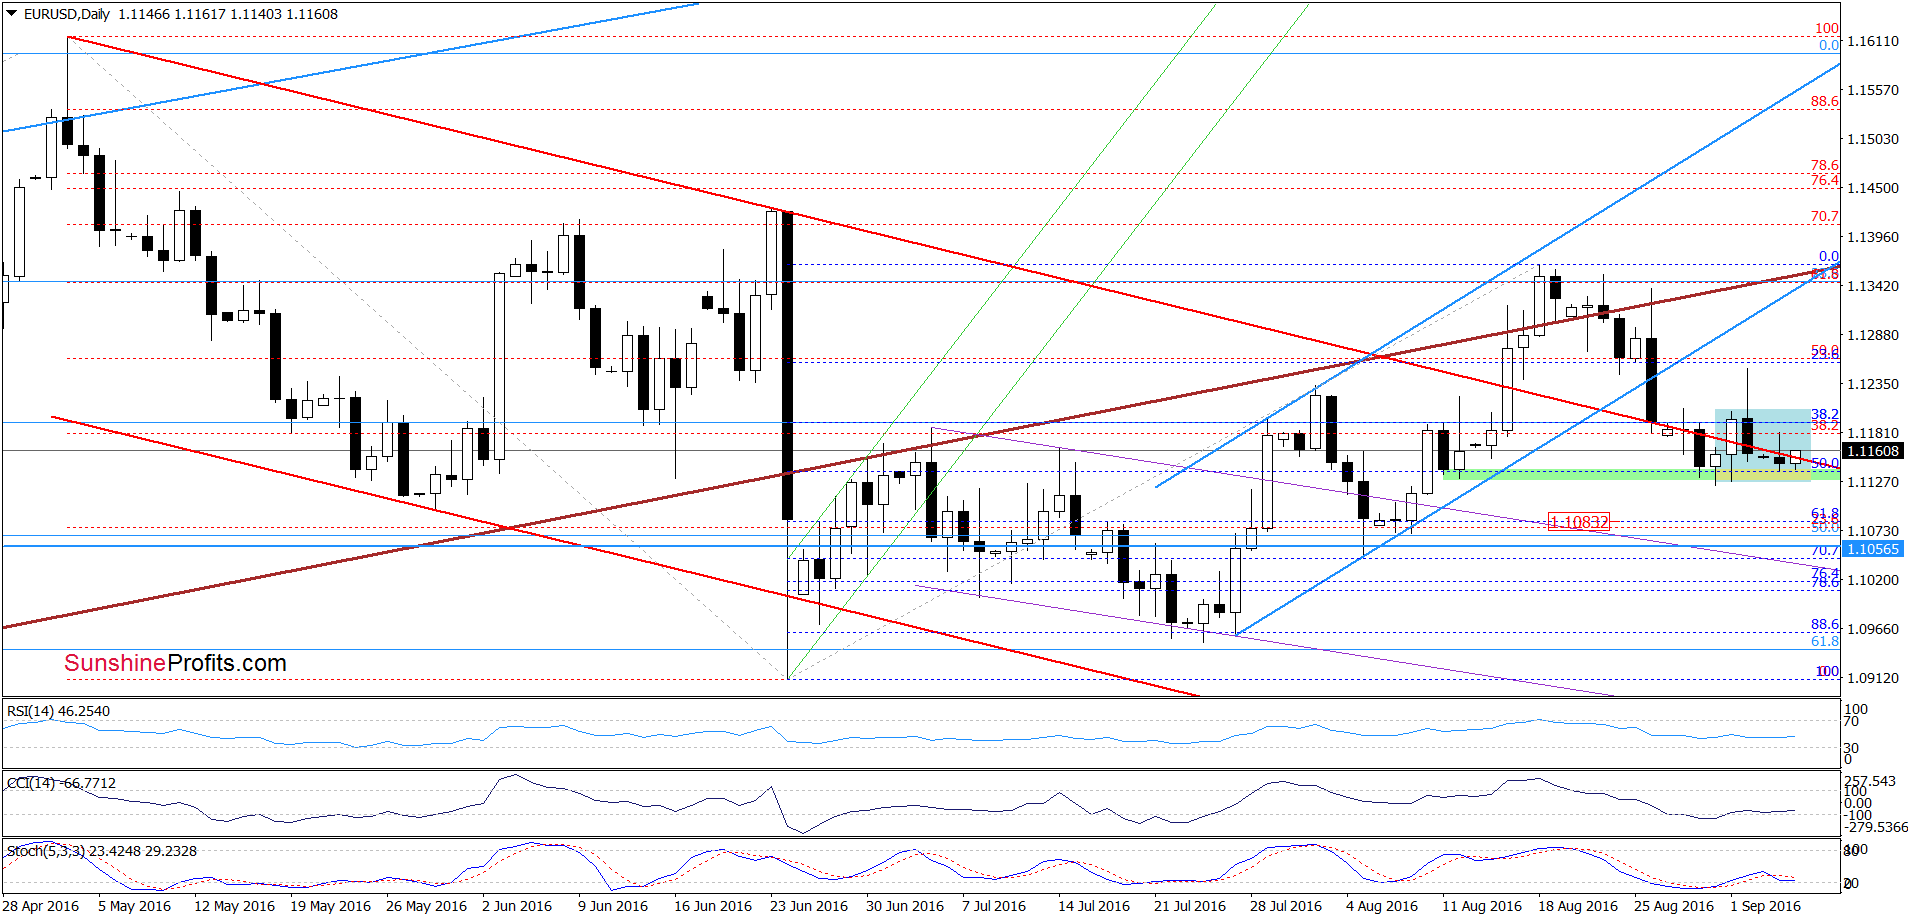
Looking at the daily chart, we see that despite Friday’s decline EUR/USD came back above the previously-broken upper border of the red declining trend channel, invalidating earlier breakdown, which is a positive signal. Nevertheless, in our opinion, another sizable upward move will be more reliable if the pair climbs above the upper border of the blue consolidation. In this is the case, the exchange rate will extend gains and increase to around 1.1335, where the previously-broken lower border of the blue rising trend channel currently is. If it is broken, we’ll see a test of the brown resistance line in the following days (currently at 1.1351).
Very short-term outlook: bullish
Short-term outlook: mixed with bullish bias
MT outlook: mixed
LT outlook: mixed
Trading position (short-term; our opinion): Long positions (with a stop-loss order at 1.1056 and initial upside target at 1.1304) are justified from the risk/reward perspective. We will keep you informed should anything change, or should we see a confirmation/invalidation of the above.
USD/CAD
On Thursday, we wrote the following:
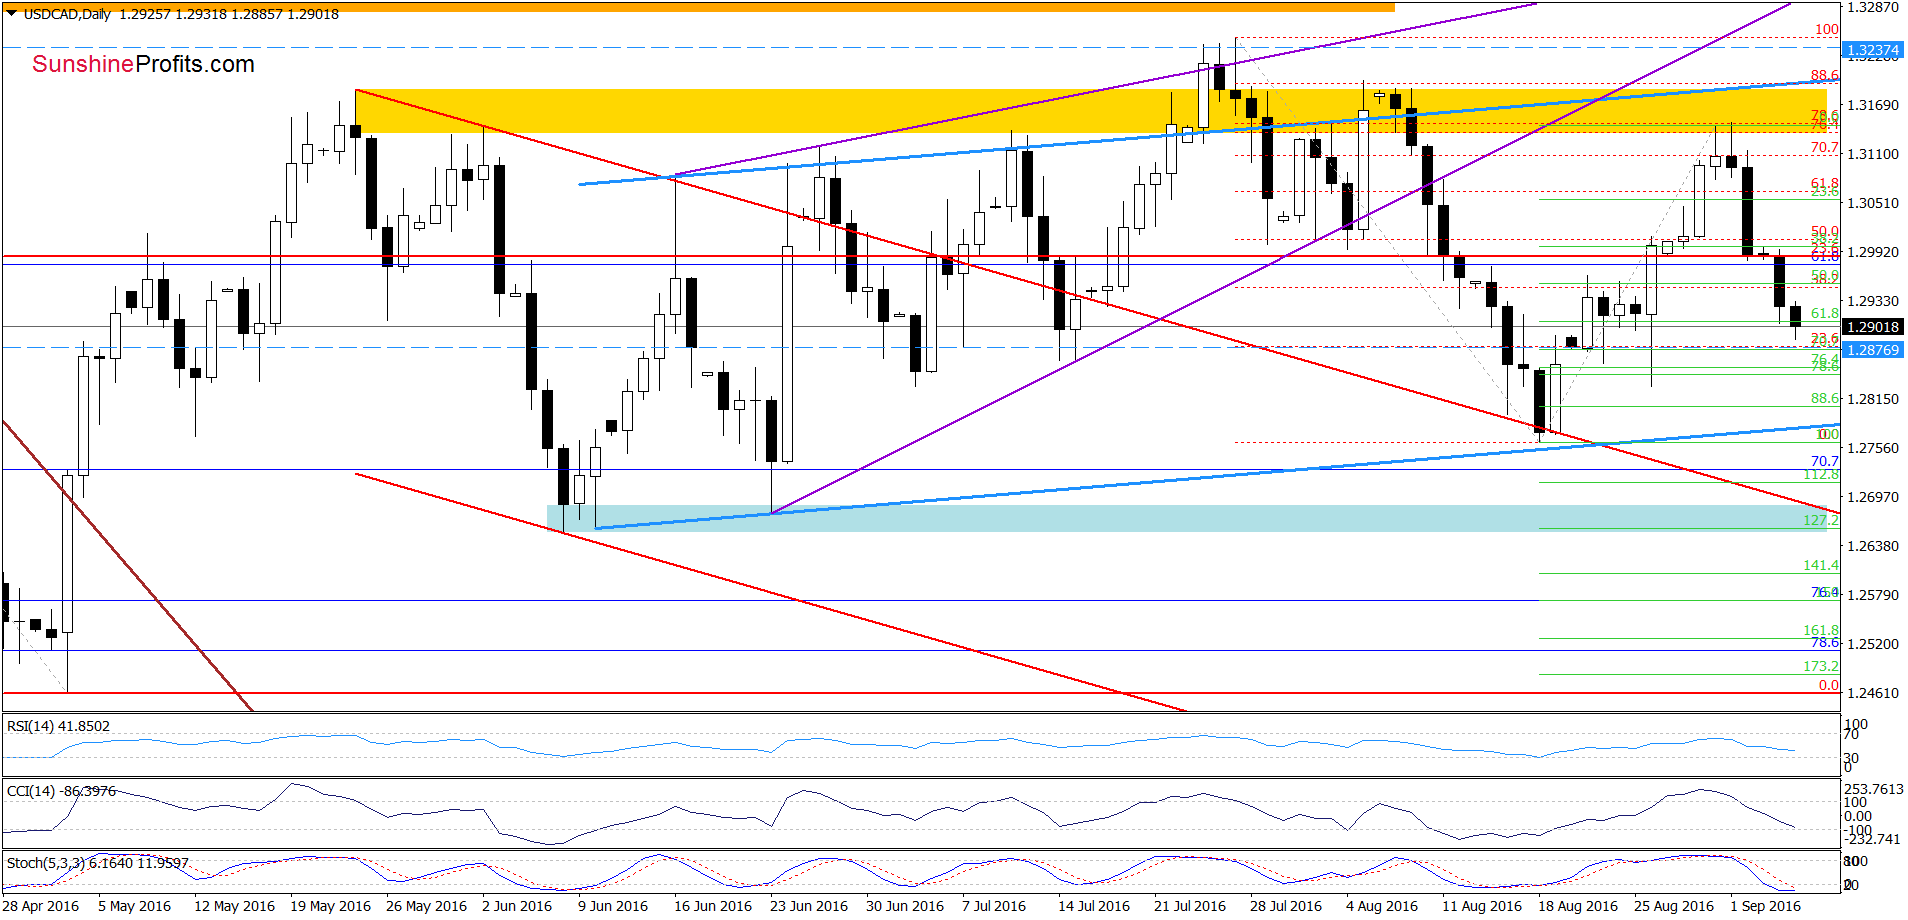
(…) breakout above the upper border of the blue consolidation. Although this is a positive signal, we saw similar price action at the end of Jul. Back then, the proximity to the long-term green rising resistance line was enough to trigger a reversal and decline.
(…) USD/CAD extended gains and reached the yellow resistance zone once again. As you see on the daily chat, this area stopped currency bulls at the beginning of Aug, which suggests that we may see similar price action in the coming days – especially when we factor in the current position of the daily indicators (the CCI and Stochastic Oscillator are very close to generating sell signals, which increases the probability of reversal in very near future - maybe even tomorrow).
From today’s point of view, we see that currency bears pushed the exchange rate lower as we had expected. As a result, USD/CAD declined to the blue consolidation, invalidating the breakout above the upper line of the formation, which triggered further deterioration earlier this week. Thanks to this drop, the pair approached the Aug 22 low and the 70.7% Fibonacci retracement based on the Aug upward move (and our initial downside target), which could pause further declines. However, in our opinion, as long as there won’t be buy signals generated by the indicators, another attempt to move lower is very likely. Therefore, if the exchange rate extends declines and drops under the above-mentioned support area, the next downside target would be the blue support line based on the previous lows (currently around 1.2782).
Very short-term outlook: bearish
Short-term outlook: mixed
MT outlook: mixed
LT outlook: mixed
Trading position (short-term; our opinion): Short positions (which are already profitable as we opened them around 1.3100) are justified from the risk/reward perspective. We will keep you informed should anything change, or should we see a confirmation/invalidation of the above.
AUD/USD
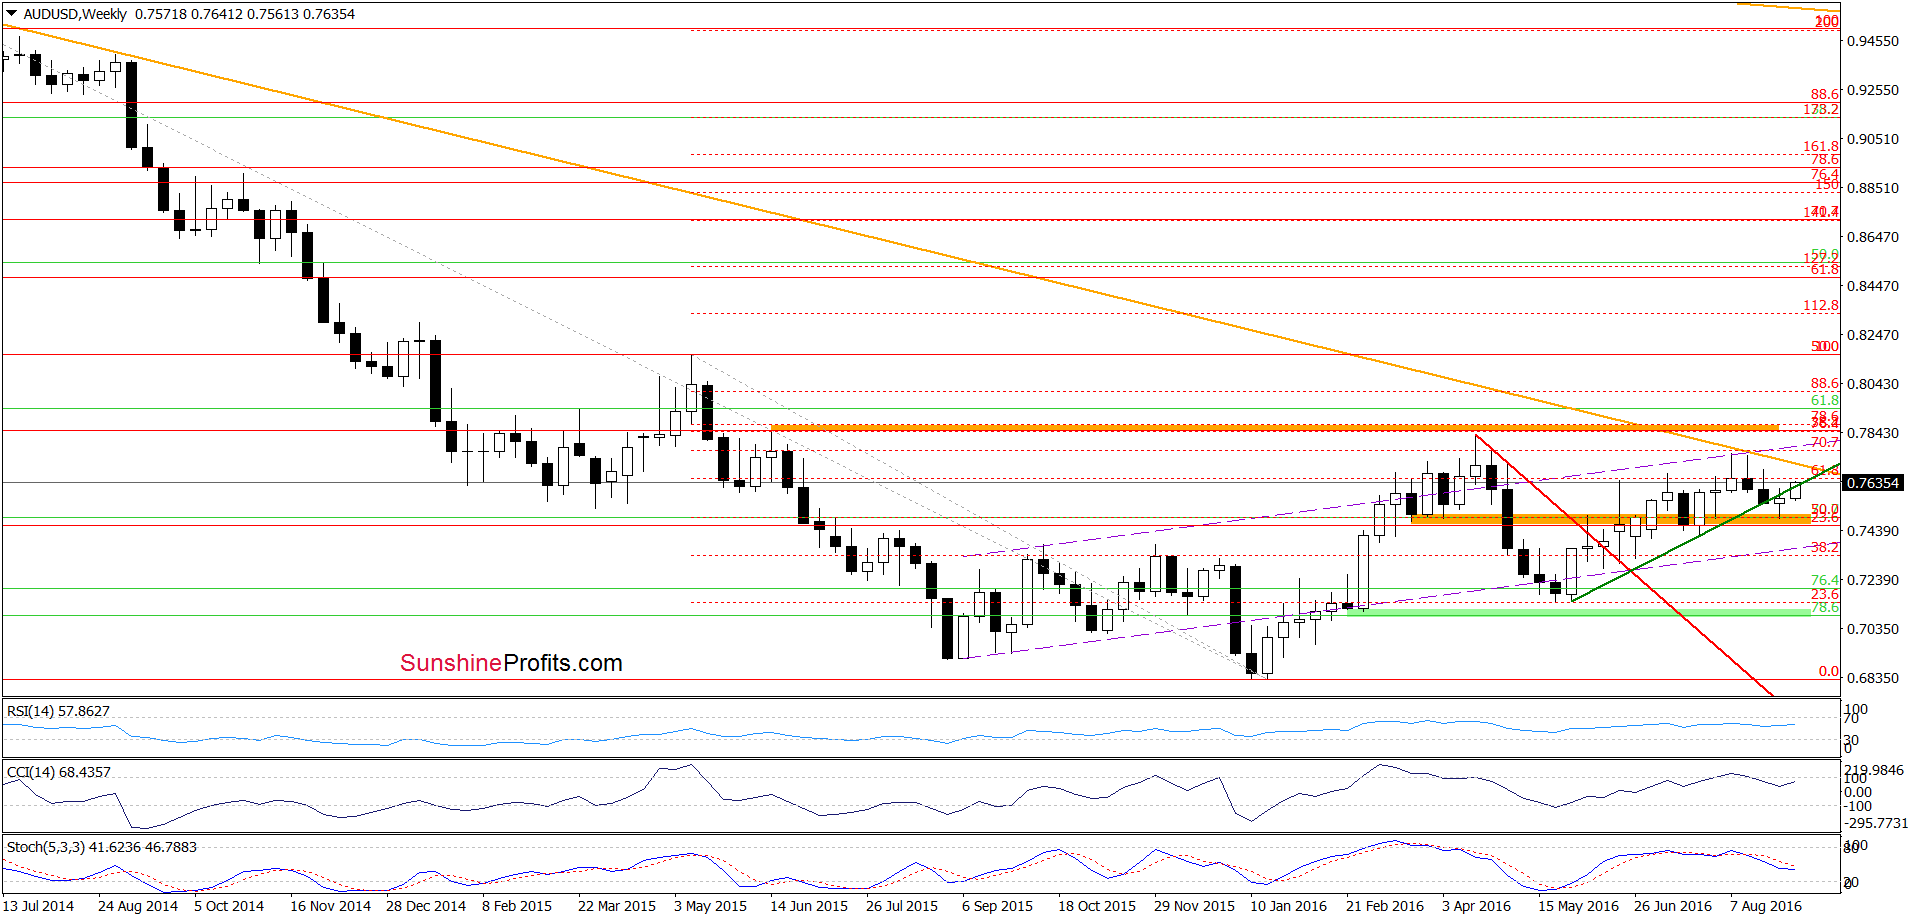
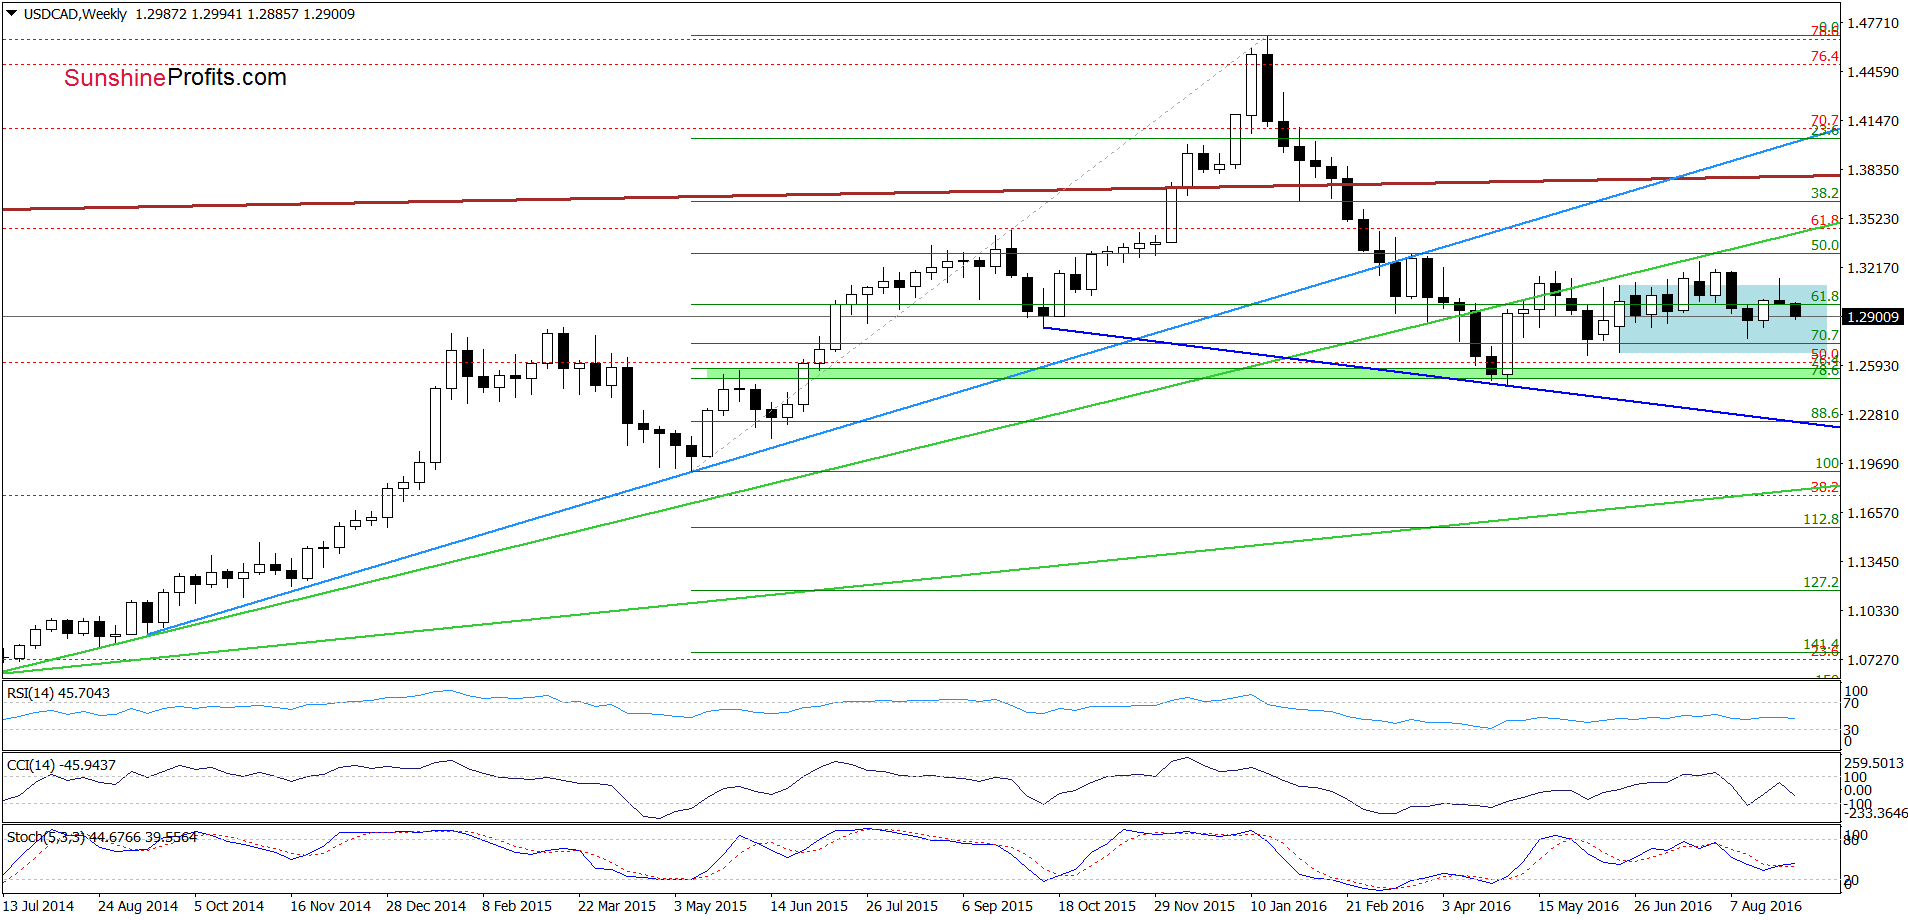
The first thing that catches the eye on the weekly chart is invalidation of the breakdown under the medium-term green line, which is a positive signal (it will turn into bullish if the exchange rate closes the week above this important support line) that suggests further improvement in the coming week.
How high could the exchange rate go? Let’s examine the daily chart and find out.
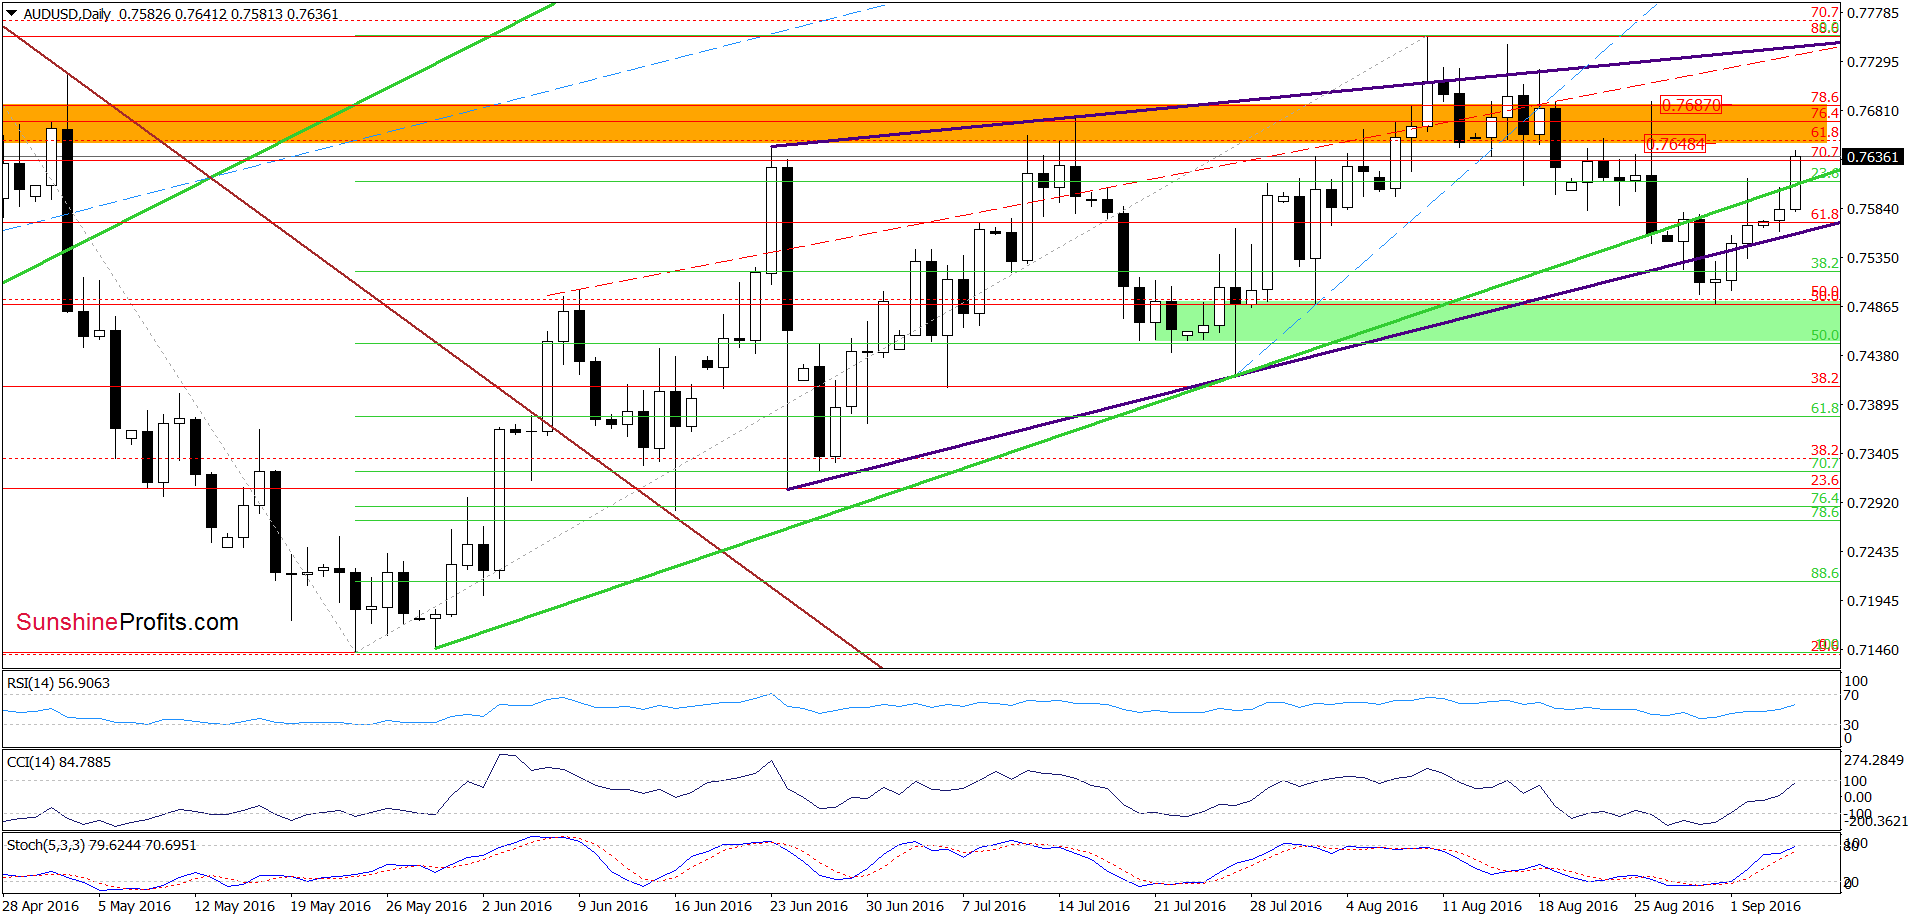
Looking at the daily chart, we see that invalidation of the breakdown under the lower border of the purple rising wedge and the medium-term green line encouraged currency bulls to act, which approached AUD/USD to the orange resistance zone. As you see, this area stopped further improvement at the end of Aug, which suggests that we may see similar price action in the coming day(s). Nevertheless, we think that as long as there won’t be sell signals generated by the indicators another attempt to move higher is likely. If this is the case and AUD/USD breaks above the orange zone, the next upside target would be around 0.7745, where the upper border of the navy blue rising wedge currently is.
Very short-term outlook: mixed with bullish bias
Short-term outlook: mixed
MT outlook: mixed
LT outlook: mixed
Trading position (short-term; our opinion): No positions are justified from the risk/reward perspective. We will keep you informed should anything change, or should we see a confirmation/invalidation of the above.
Thank you.
Nadia Simmons
Forex & Oil Trading Strategist
Przemyslaw Radomski, CFA
Founder, Editor-in-chief, Gold & Silver Fund Manager
Gold & Silver Trading Alerts
Forex Trading Alerts
Oil Investment Updates
Oil Trading Alerts

